Polycyclic Aromatic Hydrocarbons in Road Dust in Changchun City, Northeast China: Spatial Distribution, Source Appointment, and Human Health Risk Assessment
Abstract
This study thoroughly examined the impact of coal burning on the emission of polycyclic aromatic hydrocarbons (PAHs) and their subsequent long-lasting presence in different environmental matrices, including road dust. The aim was to identify the origin, extent, spatial arrangement, and cancer-causing potential associated with PAHs in road dust in Changchun City, Northeast China. The levels of Σ16 PAHs in the road dust samples ranged from 0.314 to 17.418 mg/kg, with an average concentration of 1.4452 mg/kg, exhibiting lower values than cities worldwide. In Changchun City, PAH levels in various regions follow the order of Chaoyang (CY) > Lvyuan (LY) > Kuancheng (KC) > Jingyue (JY) > Nanguan (NG) > Er’dao (ErD). Road dust primarily comprised PAHs containing 4–5 rings among these substances. The incremental lifetime cancer risk (ILCR) analysis indicated that adults faced potential risk (>10−6) at 97.7% of the sampling sites, while children faced potential risk (>10−6) at 48.8%. The principal component analysis (PCA) model identified five potential origins of PAHs, including petroleum (22.2%), coal burning (19.1%), biomass burning (30.5%), fossil fuel burning (15.8%), and transportation (12.4%). Further investigations are required to scientifically and systematically determine the carcinogenic risks associated with PAHs in the total environment, despite estimating only potential risks from PAHs in road dust and human exposure to various environmental matrices.
1. Introduction
Polycyclic aromatic hydrocarbons (PAHs) are a class of persistent organic pollutants ubiquitous in the environment and can be found in air, water, soil, and sediments [1, 2]. Besides natural forest fire sources, PAHs are primarily generated from incomplete combustion during anthropogenic consumption of organic materials, including coal, oil, petrol, and wood. The United States Environmental Protection Agency (USEPA) has classified 16 PAHs as priority pollutants based on their toxicity, mutagenic, and carcinogenic properties [3].
The PAHs’ structure, chemical composition, and molecular weight determine their physical–chemical properties. PAHs containing up to four and five rings are categorized as light PAHs (LPAHs) and heavy PAHs (HPAHs), respectively. The LPAHs are more water soluble and volatile, whereas HPAHs are mostly absorbed into particulate matter. HPAHs are more stable and more toxic than LPAHs. The LPAHs include naphthalene (Nap), acenaphthylene (Acy), acenaphtaene (Acen), fluorene (Flu), phenanthrene (Phe), anthracene (Ant), fluoranthene (Flt), pyrene (Pyr), banzo(a)anthracene (BaA), and chrysene (Chr). The HPAHs include benzo(b)fluoranthene (BbF), benzo(k)fluoranthene (BkF), benzo (a) pyrene (BaP), di-benzo(a,h)anthracene (DBA), indeno (123cd) pyrene (Inp), and benzo (ghi) pyrelene (Bghip). Among the 16 PAHs, BaP, BbF, BkF, and Chr are classified as carcinogenic or potentially carcinogenic chemicals by the International Agency for Research on Cancer.
The emission of PAHs in China was 32,720 tons in 2016, which decreased because of the prohibited crop residue burning (indoor and outdoor burning). However, it accounted for approximately 20% of the world’s emissions of PAHs, as reported by the World Bank. In recent years, the prevalence of lung cancer due to PAH pollution exposure has been about 1.6% in China [4]. Once the PAHs are released, the final destination is the sediment and soil through precipitation and rainfall. The PAHs in air, water, or soil can be directly and indirectly inhaled, ingested, and touched through the skin, harming human health.
The PAH contamination in road dust has been extensively observed globally. Several studies [5–7] have reported PAHs and the photolysis reaction of PAH products in the road dust environment, suggesting that adults face a greater susceptibility to cancer compared to children.
Changchun City, the capital of Jilin province, is located in Northeast China. The mean yearly temperature is 4.6°C, with a heating period from October to April. Recently, the air quality in these areas has worsened due to the rapid increase in industrial production, construction, and traffic volume. In 2022, the coal consumption was more than 2.7 × 10⁷ t, the highest in the Jilin province. Given the potential health risks of PAH exposure, including cancer and other adverse health effects, understanding their distribution, sources, and behavior in road dust is critical for urban environmental management. This study is the initial assessment of PAH pollution, human health risk, spatial distribution, and source apportionment in Changchun City, Northeast China, as previous studies have reported PAHs polluting road dust in different cities [8–11].
Our primary objectives include the following: (1) investigating the extent and spatial spread of PAH contamination; (2) evaluating the cancer-causing risk of PAHs for children and adults; (3) identifying the origins of PAHs emissions in road dust. This information can be a scientific foundation for developing policies to control urban environmental conditions.
2. Materials and Methods
2.1. Sampling
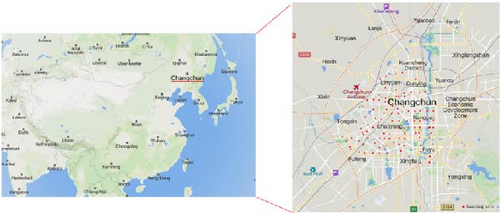
One hundred and thirty-one road dust samples were collected through Changchun City which was depicted in Figure 1, and the sampling area was divided into six districts, including Chaoyang (CY, n = 26), Lvyuan (LY, n = 30), Kuancheng (KC, n = 7), Jingyue (JY, n = 24), Nanguan (NG, n = 35), and Er’dao (ErD, n = 9). The sampling was conducted on sunny days without rainfall for at least 7 days. The dust sample was obtained and mixed from three randomly selected 1 m2 squares along the diagonal. Brush and paper dustpan were used for sample collection. The samples were stored in sealed pouches in a 4 L cooler with freezer blocks at 5°C during transportation to the laboratory. A 100-mesh sieve removed coarse particles and waste from the road dust samples. Compared with the previous studies, the fine fraction was selected for analysis. Before analysis, the samples were kept at a temperature of −20°C.
2.2. Chemical Analysis of PAHs in Road Dust
A total of 16 PAHs were selected for analysis, including Nap, Acy, acenaphthene 2 (Ane), fluoranthracene (Fla), Phe, Ant, Flu, Pyr, BaA, Chr, BbF, BkF, Bap, Inp, DBA, and Bghip.
Each 5.0 g road dust samples (Sartorius Germany, precision of 0.0001 g) was subjected to extract using an ultrasonic extractor (KQ-700E, China) with a solvent mixture of acetone and hexane in a 1:1 ratio for 30 min. The concentrated extraction was obtained using a rotary evaporator (xiande-2000A). Then, N2 was gently pumped through the extract fractions after extraction to combine and concentrate. A mixture of dichloromethane and hexane (v/v = 1/9) was used to condition the extracted samples, followed by purification through silica gel columns using a dispersive solid phase extraction technique. Then, the samples were concentrated to 0.5–1.0 mL and reconstituted with acetone/hexane (v/v = 1:1).
The concentrations of PAHs in road dust samples were analyzed using gas chromatography with a mass-selective detector (GC-MS, Agilent Technologies 7890B, Agilent, Santa Clara, CA, USA). The quartz capillary column used for chromatography was a 122-5532UI column with dimensions of 30 m × 0.25 mm × 0.25 μm. The voltage for ionization by electron impact was 70 eV, with Helium as the carrier gas. When detecting PAHs, the injection volume for splitless mode was adjusted to 1 μL. The temperature program for PAHs in the oven was adjusted by increasing the column temperature to 280°C at 10°C per minute. The thermal program for the measurement of PAH was followed as described previously [7].
2.3. Data Analysis
ArcGIS 10.2 (ESRI, USA) was employed using the inverse distance weighted (IDW) technique to analyze the dispersion patterns of PAH concentrations in road dust samples. IDW interpolation explicitly makes the assumption that things that are close to one another are more alike than those that are farther apart. The Statistical Package for the Social Sciences software (version 22.0 IBM Corp., USA) was used for principal component analysis (PCA). PCA, a general statistical method, can reduce the number of dimensions in large datasets to principal components that retain most of the original information.
2.4. Quality Assurance and Quality Control
Quality assurance and quality control were achieved using duplicates and method blanks. Analytical blanks, standards, and sample spikes were analyzed for every nine samples to ensure accuracy and precision. High-performance liquid chromatography-grade chemicals from Yuwang Chemical in Shandong, China, were used for analysis. Each experiment was performed in triplicates. The environmental procedures followed the Chinese Technical Specification for Ambient Air and Stationary Source Emissions HJ 646-2014. The detection limits of PAHs ranged between 0.05 and 0.49 ng/g. The recovery percentage ranged from 78% to 105%, depending on the specific PAH.
2.5. Human Health Assessment
The variables IRingestion, IRinhalation, BW, EF, ED, AT, SA, AF, ABS, PEF, CSFingestion, CSFdermal, and CSFinhalation represent different factors related to dust exposure. IRingestion and IRinhalation represent the rates of dust ingestion and inhalation, respectively. BW represents body weight, kg. EF represents the exposure frequency, days per year. ED represents the exposure duration, years. AT represents the average time during exposure, days. SA represents the dermal surface area of exposure, cm2. AF represents the dermal adherence factor, mg/cm2/d. ABS represents the adsorption factor of BaP. PEF represents the particulate emission factor, m3/kg. CSFingestion, CSFdermal, and CSFinhalation represent the carcinogenic slope factor for ingestion, dermal contact, and inhalation, respectively, kg·d·mg−1. Relevant parameters in toxicity formula are listed in previous published manuscript [18]. As the USEPA guideline, ILCR values greater than 10−4, ranging from 10−6 to 10−4, and less than or equal to 10−6 indicate high, potential, and negligible risk, respectively [17].
2.6. Source Appointment
The sources of PAH emissions are extensively identified through the analysis of diagnostic ratios. According to previous studies [23], the analysis of diagnostic ratios has the advantage of examining data to investigate the origins of PAH contamination in urban and rural Chongqing, China. This approach enables the investigation of the origins of PAH contamination in the sediment of a wastewater treatment facility [15].
3. Results and Discussion
3.1. PAH Contamination in Road Dust
The chromatograms illustrating PAHs are depicted in Figure S1. The levels of individual PAH and ∑16 PAHs are listed in Table 1. The PAH concentrations in street dust varied significantly, while 16 PAHs ranged between 0.314 and 17.418 mg/kg, with an average concentration of 1.445 mg/kg.
| Rings | Nap | Acy | Ane | Flu | Phe | Ant | Flt | Pyr | BaA | Chr | BbF | BkF | BaP | DBA | Inp | Bghip |
|---|---|---|---|---|---|---|---|---|---|---|---|---|---|---|---|---|
| 2 | 3 | 4 | 5 | 6 | ||||||||||||
| TEF | 0.0010 | 0.0010 | 0.0010 | 0.0010 | 0.0010 | 0.0100 | 0.0010 | 0.0010 | 0.1000 | 0.0100 | 0.1000 | 0.1000 | 1.0000 | 1.0000 | 0.1000 | 0.0100 |
| CY | ||||||||||||||||
| Max | 0.0226 | 0.0564 | 0.2568 | 0.3236 | 1.6984 | 0.7265 | 2.2989 | 1.8250 | 2.1148 | 1.9843 | 2.3719 | 0.7383 | 1.5382 | 0.2355 | 0.7365 | 0.5200 |
| Min | 0.0000 | 0.0000 | 0.0000 | 0.0000 | 0.0157 | 0.0336 | 0.0379 | 0.0432 | 0.0585 | 0.0349 | 0.0402 | 0.0133 | 0.0286 | 0.0000 | 0.0077 | 0.0000 |
| Average | 0.0031 | 0.0310 | 0.0274 | 0.0632 | 0.1634 | 0.1342 | 0.2420 | 0.2026 | 0.2105 | 0.2080 | 0.2376 | 0.1352 | 0.1737 | 0.0915 | 0.1252 | 0.0988 |
| ∑16PAHs | 2.1473 ± 3.2212 | |||||||||||||||
| % | 0.14% | 19.52% | 40.19% | 29.71% | 10.43% | |||||||||||
| ErD | ||||||||||||||||
| Max | 0.0224 | 0.0423 | 0.0354 | 0.0752 | 0.1146 | 0.1559 | 0.1595 | 0.1474 | 0.1344 | 0.1379 | 0.1449 | 0.1332 | 0.1116 | 0.1379 | 0.1243 | 0.1118 |
| Min | 0.0000 | 0.0000 | 0.0000 | 0.0000 | 0.0203 | 0.0336 | 0.0448 | 0.0502 | 0.0615 | 0.0341 | 0.0494 | 0.0131 | 0.0364 | 0.0000 | 0.0130 | 0.0000 |
| Average | 0.0048 | 0.0168 | 0.0133 | 0.0301 | 0.0649 | 0.0715 | 0.0950 | 0.0836 | 0.0852 | 0.0805 | 0.0908 | 0.0663 | 0.0704 | 0.0416 | 0.0481 | 0.0363 |
| ∑16PAHs | 0.8993 ± 0.5250 | |||||||||||||||
| % | 0.54% | 21.86% | 38.29% | 29.93% | 9.39% | |||||||||||
| KC | ||||||||||||||||
| Max | 0.0224 | 0.0464 | 0.0455 | 0.0773 | 0.1868 | 0.1026 | 0.3198 | 0.2326 | 0.2012 | 0.1616 | 0.2212 | 0.1545 | 0.1761 | 0.1383 | 0.1652 | 0.1342 |
| Min | 0.0000 | 0.0047 | 0.0155 | 0.0385 | 0.0669 | 0.0570 | 0.0846 | 0.0514 | 0.0632 | 0.0916 | 0.0503 | 0.0753 | 0.0760 | 0.0074 | 0.0184 | 0.0113 |
| Average | 0.0079 | 0.0349 | 0.0298 | 0.0574 | 0.1120 | 0.0984 | 0.1623 | 0.1227 | 0.1203 | 0.1189 | 0.1295 | 0.1164 | 0.1041 | 0.0882 | 0.0880 | 0.0801 |
| ∑16PAHs | 1.4709 ± 0.5142 | |||||||||||||||
| % | 0.54% | 22.61% | 35.64% | 29.79% | 11.43% | |||||||||||
| LY | ||||||||||||||||
| Max | 0.0230 | 0.0537 | 0.0486 | 0.0822 | 0.3489 | 0.1613 | 0.8856 | 0.7264 | 1.1859 | 0.4386 | 0.5431 | 0.4069 | 0.4108 | 0.4529 | 0.3026 | 0.1737 |
| Min | 0.0000 | 0.0000 | 0.0000 | 0.0007 | 0.0754 | 0.0376 | 0.0975 | 0.0639 | 0.0669 | 0.0491 | 0.0586 | 0.0189 | 0.0365 | 0.0000 | 0.0129 | 0.0000 |
| Average | 0.0041 | 0.0303 | 0.0220 | 0.0551 | 0.1239 | 0.1060 | 0.1960 | 0.1613 | 0.1895 | 0.1538 | 0.1726 | 0.1265 | 0.1289 | 0.0923 | 0.1055 | 0.0864 |
| ∑16PAHs | 1.7541 ± 0.9455 | |||||||||||||||
| % | 0.23% | 19.23% | 39.94% | 29.66% | 10.94% | |||||||||||
| NG | ||||||||||||||||
| Max | 0.0287 | 0.0483 | 0.0367 | 0.0904 | 0.2290 | 0.1861 | 0.4188 | 0.3669 | 0.3450 | 0.3199 | 0.4782 | 0.2248 | 0.3497 | 0.2192 | 0.3202 | 0.2418 |
| Min | 0.0000 | 0.0000 | 0.0000 | 0.0000 | 0.0222 | 0.0345 | 0.0393 | 0.0458 | 0.0605 | 0.0354 | 0.0428 | 0.0144 | 0.0298 | 0.0000 | 0.0099 | 0.0000 |
| Average | 0.0008 | 0.0108 | 0.0067 | 0.0236 | 0.0735 | 0.0707 | 0.1196 | 0.1073 | 0.1041 | 0.1015 | 0.1269 | 0.0635 | 0.0844 | 0.0395 | 0.0622 | 0.0378 |
| ∑16PAHs | 1.0330 ± 0.7643 | |||||||||||||||
| % | 0.08% | 17.94% | 41.87% | 30.43% | 9.68% | |||||||||||
| JY | ||||||||||||||||
| Max | 0.0000 | 0.0438 | 0.0241 | 0.0764 | 0.1444 | 0.0760 | 0.3129 | 0.2966 | 0.2117 | 0.2472 | 0.2834 | 0.1411 | 0.2126 | 0.0164 | 0.1716 | 0.0251 |
| Min | 0.0000 | 0.0000 | 0.0000 | 0.0034 | 0.0544 | 0.0438 | 0.0617 | 0.0685 | 0.0842 | 0.0551 | 0.0761 | 0.0402 | 0.0720 | 0.0039 | 0.0102 | 0.0091 |
| Average | 0.0000 | 0.0088 | 0.0163 | 0.0401 | 0.0837 | 0.0744 | 0.1188 | 0.1145 | 0.1096 | 0.0964 | 0.1249 | 0.0948 | 0.0984 | 0.0278 | 0.0551 | 0.0328 |
| ∑16PAHs | 1.0965 ± 0.4637 | |||||||||||||||
| % | 0.00% | 20.37% | 40.06% | 31.55% | 8.01% | |||||||||||
| Changchun | ||||||||||||||||
| Max | 0.0287 | 0.0564 | 0.2568 | 0.3236 | 1.6984 | 0.7265 | 2.2989 | 1.8250 | 2.1148 | 1.9843 | 2.3719 | 0.7383 | 1.5382 | 0.4529 | 0.7365 | 0.5200 |
| Min | 0.0000 | 0.0000 | 0.0000 | 0.0000 | 0.0157 | 0.0336 | 0.0379 | 0.0432 | 0.0585 | 0.0341 | 0.0402 | 0.0131 | 0.0286 | 0.0000 | 0.0077 | 0.0000 |
| Average | 0.0025 | 0.0206 | 0.0178 | 0.0440 | 0.1062 | 0.0936 | 0.1618 | 0.1391 | 0.1454 | 0.1332 | 0.1567 | 0.1009 | 0.1150 | 0.0625 | 0.0837 | 0.0623 |
| ∑16PAHs | 1.4452 ± 0.8100 | |||||||||||||||
| 0.17% | 19.53% | 40.10% | 30.10% | 10.10% | ||||||||||||
- Abbreviations: Acy, acenaphthylene; Ane, acenaphthene 2; Ant, anthracene; BaA, banzo(a)anthracene; BaP, benzo(a)pyrene; BbF, benzo(b)fluoranthene; Bghip, benzo (ghi) pyrelene; BkF, benzo(k)fluoranthene; Chr, chrysene; CY, Chaoyang; DBA, di-benzo(a,h)anthracene; ErD, Er’dao; Flt, fluoranthene; Flu, fluorene; Inp, indeno (123cd) pyrene; JY, Jingyue; KC, Kuancheng; LY, Lvyuan; Nap, naphthalene; NG, Nanguan; PAH, polycyclic aromatic hydrocarbon; Phe, phenanthrene; Pyr, pyrene; TEF, toxic equivalent factor.
The PAH levels in Changchun were comparatively lower than in Nanjing [24, 25]. The increased automobile exhaust emissions and the need for economic growth have contributed to a higher concentration of PAHs in road dust in Nanjing. Table 1 displays the calculated BaPeq levels at 0.2321 mg/kg. The BaP concentration was below the 0.55 mg/kg limit by the Soil Environmental Quality Construction Land Risk Control Standard (GB36600-2018) for construction land. The contribution of each substance in TEQi to Bap in different regions were: Bap > DBA > BbF > BaA > BkF > Inp > Chr > Ant > Bghip > Flt > Pyr > Phe > Flu > Ane > Acy > Nap.
The distribution of the PAHs, with a higher concentration of HPAHs and a lower concentration of LPAHs, can be attributed to the elevated vapor pressures of the lighter compounds. PAHs with high ring numbers have a high contribution and a significant TEF, which is also a factor that cannot be ignored in the distribution of different PAHs. Overall, the proportion of HPAHs accounted for 80.3% across the region. Gasoline combustion is primarily responsible for the relatively high proportion of Flt, Pyr, BaA, and Chr in the four-ring road, leading to this situation. There are automobile companies, businesses, and hospitals near heavily polluted areas, which can increase the content of four-rings.
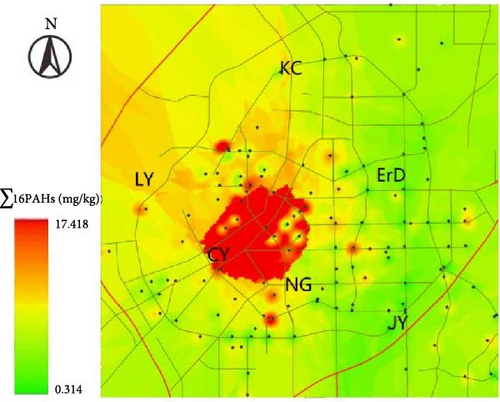
The spatial variation of 16 PAHs was mapped, as illustrated in Figure 2. The highest value occurred in the CY district (2.1473 mg/kg) with human and commercial activities, which indicated more vehicular emission, while the lowest values occurred in the ErD region (0.8993 mg/kg). The trend of PAH concentration in various regions was as follows: the highest concentration was in the CY district, followed by LY, KC, JY, NG, and ErD. The BbF level was at its peak in the two regions, while Nap was at its minimum concentration. LPAHs primarily exist in the gas phase and are easy to degrade, which results in low adsorption efficiency of Nap in road and air dust.

3.2. Risk Assessment for Human Health
Ingestion, inhalation, and dermal exposure were all considered routes of exposure in estimating and summing up human carcinogenic risks from PAHs. This observation indicates that there were 128 sites with potential health risks for adults and 64 for children. The general health situation of adults and children with ILCR in various regions is depicted in Figure 3. It is concluded that adults are at greater risk than children because of their higher respiratory rate and longer skin exposure time. Consequently, PAHs must be evaluated holistically for their risks.
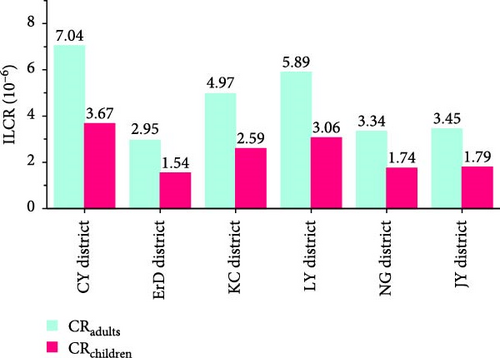
The ILCRtotal values for adults and children varied between 2.95 × 10⁻⁶ and 7.04 × 10⁻⁶ (mean = 4.60 × 10⁻⁶) and between 1.54 × 10⁻⁶ and 3.67 × 10⁻⁶ (mean = 2.39 × 10⁻⁶), respectively (Figure 3). Compared to children, adults were more susceptible to cancer caused by PAHs found in road dust. After considering all the locations where samples were collected, it was found that 97.7% of them have a carcinogenic risk that exceeds the threshold value (10−6) for adults. Additionally, 48.8% of these locations have a carcinogenic risk that exceeds the threshold value (10−6) for children. Among these locations, the CY region was at the highest risk, although it remains below the potential risk level of <10−4. The ranking of ILCR for adults and children varied across regions. This indicates that the extent of harm to the human body is contingent upon the concentration and toxicity of substances.
The mean ILCRtotal value for the six zones was distributed as follows: CY (7.04 × 10⁻⁶) > LY (5.89 × 10⁻⁶) > KC (4.97 × 10⁻⁶) > JY (3.45 × 10⁻⁶) > NG (3.34 × 10⁻⁶) > ErD (2.95 × 10⁻⁶), for adults. Furthermore, children exhibited a comparable pattern.
The mean direct intake of ILCR investigated in this study was less than that of Shanghai [26], where they found evidence of potential cancer risk for children and adults. This research indicates that adults face a greater susceptibility to potential cancer compared to children due to their exposure to PAHs present in the dust found on urban roads [27]. It has been found that adults have a greater susceptibility to developing cancer due to PAHs compared to children [28], which due to their reduced involvement in activities and limited exposure to carcinogens, which explains this occurrence.
Liu et al. [16] collected ambient air samples from three areas in Malaysia, which indicates that the ILCR of PAHs in the air was 1.71 × 10⁻⁴, 1.58 × 10⁻⁴, and 2.02 × 10⁻⁴ in PM10, and 2.44 × 10⁻⁴, 2.03 × 10⁻⁴, and 2.23 × 10⁻⁴ in PM2.5. Chen, Liao, and Wei [15] analyzed the health risks and sources of PAHs in road dust in three areas of Huainan, in which the values ranged from 1.08 × 10⁻⁶ to 8.28 × 10⁻⁶.
There was a significant contribution from three exposure routes to the total ILCR (Table 2). Adults were most likely to develop cancer from dermal contact with dust, followed by ingestion and inhalation intake had little impact. For children, the same trend was observed. There is a direct relationship between exposure parameters and the relative contributions of three pathways, regardless of the concentrations of PAHs. In addition to road dust, humans are exposed to other environmental media containing PAHs, including soil, water, and airborne particulate matter [28]. A higher cancer risk would result from human exposure to the total environment. Therefore, conducting a scientific and systematic assessment of carcinogenic risks posed by PAHs in the environment is important.
| ILCR | Mode | Adult | Children |
|---|---|---|---|
| CY | Ingestion | 2.53E-06 ± 3.33E-06 | 1.63E-06 ± 2.15E-06 |
| Dermal | 4.50E-06 ± 5.92E-06 | 2.03E-06 ± 2.68E-06 | |
| Inhalation | 1.96E-10 ± 2.58E-10 | 3.17E-11 ± 4.16E-11 | |
| ErD | Ingestion | 2.13E-06 ± 7.21E-07 | 6.85E-07 ± 4.64E-07 |
| Dermal | 1.89E-06 ± 1.28E-06 | 8.55E-07 ± 5.79E-07 | |
| Inhalation | 8.25E-11 ± 5.59E-11 | 1.33E-11 ± 9.01E-12 | |
| KC | Ingestion | 1.24E-06 ± 5.76E-07 | 7.99E-07 ± 3.71E-07 |
| Dermal | 2.21E-06 ± 11.02E-06 | 9.97E-07 ± 4.62E-07 | |
| Inhalation | 9.62E-11 ± 4.46E-11 | 1.55E-11 ± 7.19E-12 | |
| LY | Ingestion | 1.79E-06 ± 6.78E-07 | 1.15E-06 ± 4.37E-07 |
| Dermal | 3.18E-06 ± 1.20E-06 | 1.44E-06 ± 5.45E-07 | |
| Inhalation | 1.39E-10 ± 5.26E-11 | 2.23E-11 ± 8.47E-12 | |
| NG | Ingestion | 2.11E-06 ± 1.22E-06 | 1.36E-06 ± 7.89E-07 |
| Dermal | 3.76E-06 ± 2.18E-06 | 1.69E-07 ± 9.83E-07 | |
| Inhalation | 1.63E-10 ± 9.50E-11 | 2.64E-11 ± 1.53E-11 | |
| JY | Ingestion | 1.20E-06 ± 1.03E-06 | 7.76E-07 ± 6.61E-07 |
| Dermal | 2.14E-06 ± 1.82E-06 | 9.67E-07 ± 8.24E-07 | |
| Inhalation | 9.34E-11 ± 7.96E-11 | 1.50E-11 ± 1.28E-11 | |
- Abbreviations: CY, Chaoyang; ErD, Er’dao; ILCR, incremental lifetime cancer risk; JY, Jingyue; KC, Kuancheng; LY, Lvyuan; NG, Nanguan.
3.3. Source Appointment of PAHs
The road dust in the six regions had a significantly greater proportion of HPAHs than LPAHs (p < 0.01). This indicates that the primary origin of PAHs in road dust was pyrogenic sources, which aligns with the findings in Iran [29].
Diagnostic ratios of PAHs were determined to determine the sources of PAH emissions in road dust (Figure 4). The discrimination of pollution sources in each proportion in the diagnostic ratio method is presented in Table S1.
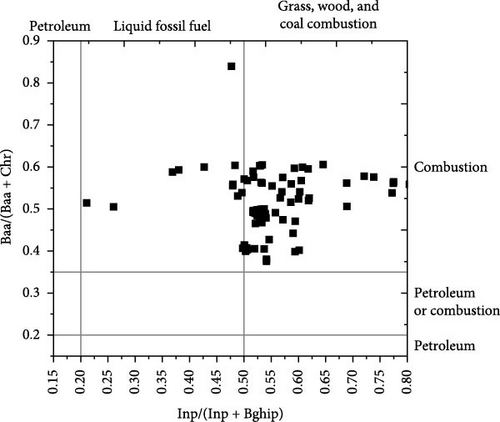
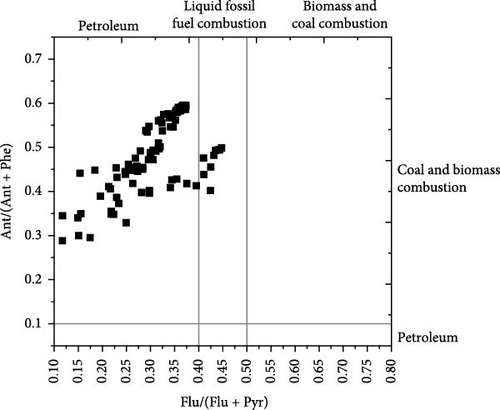
Both ratios of BaA/(BaA + Chr) was >0.35 and InP/(InP + Bghip) was >0.2 (Table S1), which suggested that coal, wood, and fuel combustion emitted most of the PAHs in road dust [30]. Coal and biomass were fuel sources in all samples with Flu/(Flu + Pyr) ratios >0.1. Moreover, Ant/(Ant + Phe) > 0.25 ratios implied that PAHs were primarily from fossil fuel combustion. In summary, coal combustion, biomass combustion, and petroleum contributed significantly to PAHs in road dust throughout the industrial city.
The PMF analysis of PAHs was conducted to obtain a more comprehensive understanding of the sources of road dust PAH emission (Figure 5).
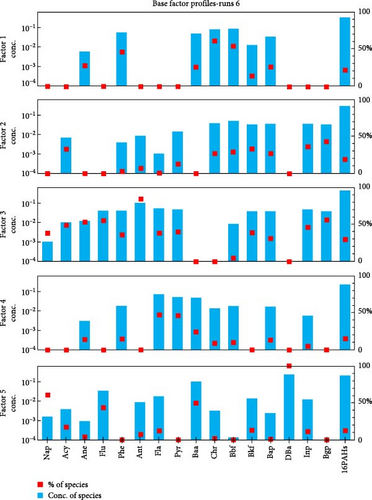
By testing three−seven factor solutions, a five-factor solution was selected for the whole PCA data set. When the number of principal factors was five, the number of iterations was 100, and the real/simulation value was 1.06. The contribution of each substance in the factor is depicted in Figure 5. The contribution rates of BbF and Chr in factor 1 were 54.6% and 60.8%, which are the characteristics of BbF and Chr gasoline combustion; consequently, factor 1 indicated the oil source. The contribution rates of Inp and Bghip in factor 2 were 35.8% and 43.1%, respectively. Evidence suggests that Inp and Bghip are the characteristics of coal combustion; accordingly, factor 2 indicated the coal carbon source. The contribution rates of Nap, Flu, Acy, and Ant in factor 3 were 38.7%, 55.8%, 49.0%, and 85.2%, respectively. Studies suggest that Nap and Acy are biomass combustion sources, and Flu and Ant are coal combustion characteristics; therefore, factor 3 indicated biomass combustion sources and coal sources. The contribution rates of Fla and Pyr in factor 4 were 48.0% and 47.1%. Fla is the characteristic of fossil fuel combustion, and Pyr is the characteristic of diesel vehicle emission; consequently, factor 4 indicates the source of fossil fuel combustion. The contribution rates of BaA and DBA in factor 5 were 49.5% and 80%, respectively. BaA and DBA are the characteristics of gasoline combustion; accordingly, factor 5 indicates the traffic source.
According to the PCA model, the contribution rate of each factor in road dust PAHs in Changchun is presented in Figure 5. The PAHs contribution identified five factors: petroleum source (22.2%), coal source (19.1%), biomass combustion source (30.5%), fossil fuel combustion source (15.8%), and transportation source (12.4%).
4. Conclusion
PAH-polluted road dust samples from Changchun City in China were evaluated. The PAH concentration in the CY region of this city was significantly higher compared to five other regions. The PAH contamination levels were measured using GC/MS, and the source appointment was achieved using diagnostic ratios and PMF. The diagnostic ratios and PMF revealed that petroleum, coal burning, biomass burning, and combustion of liquid fossil fuels were the primary contributors of PAHs in road dust. Furthermore, the human health assessment through the EPA model exhibited that 97.7% have the potential to cause cancer (ILCRtotal > 10−6) in adults, while 48.8% have the potential to cause cancer (ILCRtotal > 10−6) in children. Although the cancer risk from PAHs in road dust is not significant, it is highly advised that the cancer risk should be evaluated in the overall surroundings. This evaluation should consider the exposure of local inhabitants to the entire environment, including other polluted environmental elements containing PAHs. The outcomes of this study can contribute to reliable source characterization for automobile industry regulatory control of the deleterious PAHs, thereby, promoting greater protection of the environment and human health. Future research should investigate the concentrations of PAHs during various seasons.
Ethics Statement
This manuscript does not involve researching humans or animals.
Conflicts of Interest
The authors declare no conflicts of interest.
Author Contributions
Na Li got the financial support and designed the experiment. Zhaowei Wang, Qingqing Li, Fuchen Zhu, and Peng Liu carried out the experiment. Weizheng Han, Keyi Hou, and Yanxue Xu collected the meteorological factors and analyzed the data. Zhao Chen and Kaize Wang drawed all the figures of the manuscript. All of the authors consented to participate in the drafting of this manuscript. All of the authors consented to publish this manuscript.
Funding
This work was supported by Scientific and Technological Developing Scheme of Jilin Province (20230101307JC) and the Education Department of Jilin Province (JJKH20220293KJ).
Acknowledgments
We thank Home for Researchers editorial team (www.home-for-researchers.com) for language editing service.
Supporting Information
Additional supporting information can be found online in the Supporting Information section.
Open Research
Data Availability Statement
The data that support the findings of this study are available on request from the corresponding author. The data are not publicly available due to privacy or ethical restrictions.


