Optimal Intervention Strategies on TB Epidemiology in a Prison Population
Abstract
This paper presents a compartmental model in ordinary differential equations of tuberculosis (TB) disease dynamics in a prison population, which is calibrated to reflect the unique conditions of the Democratic Republic of Congo. Data are sourced from various sources of statistics that are publicly available and also from other modeling publications. The model is utilized to determine the optimal roll-out strategy for a combination of intervention strategies in TB control in a prison population. The two control functions both address treatment but are linked to different infection classes, making them distinct functions of time. Numerical simulations reveal that without well-planned control measures, TB remains endemic. However, optimal control strategies can potentially eliminate the disease, provided the influx of TB-infected prisoners is controlled. Implementing these strategies can significantly reduce the number of infectious TB cases while minimizing treatment costs.
MSC2020 Classification: 92D30, 34K20
1. Introduction
According to the World Health Organization (WHO) annual reports, tuberculosis (TB) is still one of the world’s biggest infectious killers, causing more deaths and prevalent in more than 30 countries [1, 2]. In 2022, more than 10 million people fell ill with TBs globally, and the African region accounted for a quarter of new TB cases worldwide [1]. Worldwide, there were an estimated 1.3 million deaths, of which more than 400,000 were in Africa. The Democratic Republic of Congo (DRC), situated in Central Africa, has an estimated population of 86.79 million people and falls under the high burden countries for TB. The DRC carries a heavy socioeconomic and health burden. In 2021, it was estimated that there were 305,000 new cases of TB in the DRC, with approximately 49,000 TB-related deaths [3]. In the prison settings of the DRC, TB remains a pressing public health concern. According to a study conducted in the Central Prison of Mbuji-Mayi, TB prevalence stands at 17.7%, significantly surpassing the general population’s prevalence of about 0.532% (532 cases per 100,000 people) [1, 4, 5]. This high prevalence in prisons is attributed by overcrowding which is still the main factor that fuels TB in a prison system. Congolese prisons are among the most overcrowded in the world with an average overcapacity rate of 432%. For example, Makala Central Prison in Kinshasa was built to accommodate a maximum of 1500 inmates and has now housed over 8000 prisoners, by far exceeding the internationally accepted minimum size space of 4 m2 per prisoner [6, 7]. Overcrowding in prisons leads to insufficient bathroom facilities, poor ventilation, lack of sunshine, inadequate access to health care, malnutrition, and other problems [8]. These factors pose a serious threat to the health of prisoners.
The aforegoing discussion points out that in order to fight TB in a prison population, a primary consideration is acceptable living conditions. This entails basic hygiene, proper nutrition, safety, space, and proper ventilation. Secondly, education and nonpharmaceutical interventions, such as social distancing, for instance, must be in place as much as possible. These two are preventive measures. Then thirdly, screening, testing, and treatment are necessary to fight the infection inside the body of an infected individual, thereby reducing the number of active infections.
Limited access to high-quality TB diagnosis can lead to poor and inaccurate TB screening diagnostics. In 2014, X-pert MTB/RIF was introduced in Kasai Oriental Province for use in Mbuji-Mayi Central Prison. This has caused an improvement in the fight against TB and multidrug-resistant TB (MDR-TB), especially for the Mbuji-Mayi Central Prison as they provided results of active TB cases for the first time in the prison’s records in DRC [9]. By the end of 2014, laboratory tests confirmed TB in 31 out of 57 sputum specimens from prisoners with convincing symptoms of TB.
Several studies have been conducted to mathematically test the efficiency of certain strategies of disease control, for instance [10–15]. Many disease models consider populations into which there is no inflow of infections from outside the system. For a prison population, one necessarily has to allow for influx of infected individuals into the population [13, 16]. Other than prison models, there are many other situations where the modeling allowed for inflow of infected, for instance [17–20].
In this paper, we present a deterministic compartmental model based on the model in [16] which considers the dynamics of TB in prison systems. The model is calibrated here for the prison population in DRC which suffers a fragile health system due to overcrowding, poor nutrition, and poor sanitation. There are several contributions in the literature, on optimal control of TB epidemiology, and here we can mention [21] and [22], for instance. The current paper contributes to the understanding of efficient control strategies to be utilized for combating TB disease in a dense population with inflow of infectives. For TB disease dynamics in a prison population, this is a novel theme. Our control functions refer to the number of individuals that are referred to treatment, from out of the exposed class and the infectious class. These individuals can be selected for admission to treatment on the basis of a waiting list or preference list.
2. Model
We present a susceptible-exposed-infectious-treatment (SEIT) compartmental model that describes the dynamics of TB in the DRC prison system. The model is based on a paper [16] that focuses on the dynamics of TB in South African prison systems. The total prison population (N) is divided into four epidemiological groups which are the susceptibles S(t), members of the prison population who are at risk of becoming infected; the exposed E(t), individuals who are infected with TB but not infectious; the infectious I(t), inmates who can infect other individuals; and finally, the treatment class T(t) of individuals under treatment.
The susceptible individuals move to the exposed class at a rate c1SI through infection acquired from the infectious class, where c1 is the effective contact rate between the susceptible and infectious individuals. Members who are showing symptoms and are infections move from the exposed class to the infections class at a rate kE + c3EI, where c3 is the effective contact rate between the exposed and the infectious individuals. There is a transfer from E to T at the rate pE and transfer from I to T at the rate qI. Individuals who have been successfully treated move out of the T-class into the E-class at a rate of c2TI. We assume that even after effective treatment, an individual will not be completely free of the infection but will retain some of the bacteria in an inactive state. Therefore, after having been infected, a patient will never again be completely free of TB bacteria. The removal rate is denoted by μ and the TB-induced mortality rate d. The total inflow into the system is assumed to be μA. The positive numbers fS, fE, and fI are the fractions of the total inflow into the relevant classes. Thus, the inflow of susceptible, exposed, and infectious individuals into the prison population are at the rates fSμA, fEμA, and fIμA, respectively, and thus fS + fE + fI = 1.
2.1. Model (1)
Also, in the case of no influx of infected into the population, a global stability theorem for the DFE is also proved in [16]. On the other hand, when the influx of infected into the prison is nonzero, then the disease will persist.
3. Optimal Control Problem
Management of TB disease continues to be a major problem worldwide. Mathematical modeling and mathematical control theory are a useful tool which can be used to assist in decision-making on optimal roll-out of identified interventions. In this case, the intervention in point will be the intensification of treatment. More specifically, our control functions will be the number of individuals that are referred to treatment. We revise model (1) to account for increasing the number of inmates referred to treatment, the inmates moving from the classes E and I into T. Thus, we let r1(t)E(t) and r2(t)I(t), respectively, be the number of individuals from the classes E and I who are identified to move into the treatment class. Then, we obtain a model system as follows.
3.1. Model (4)
Here, we want to minimize the active TB-infectious individuals while the cost of treatment is kept minimized as well. The weight factors (positive constants) W1 and W2 represent a patient’s level of acceptance of treatment. The constant g1 is the measure of the relative cost of the intervention related to the controls r1 and r2.
More precisely, we can formulate the main problem as follows:
Problem 1. Minimize the objective functional J(r1, r2) of Equation (5) subject to the model (4) conditions, and the initial state St0, Et0, It0, and Tt0, given in Table 1.
Theorem 1. There exists an optimal control pair and a solution S∗, E∗, I∗, and T∗ that minimizes J(r1, r2) over Ω. Moreover, there exists adjoint functions, the vector λ(t) which satisfies the following equations:
Proof. The integrand of J is convex with respect to the controls (r1, r2). Thus, the boundedness of the solutions of the state equations, and the Lipschitz property of the state system with respect to the state variables, guarantees the existence of a solution of the optimal control problem [27, 28]. Pontryagin’s maximum principle implies minimization of the Hamiltonian with respect to (r1, r2). The Pontryagin maximum principle states that
Furthermore, we consider the optimality conditions
Remark 1. The uniqueness of the optimal control can be proven for the final time τ sufficiently small; see [27], for instance.
4. Numerical Values of the Parameters
4.1. Numerical Value for Disease-Induced Death Rate
4.2. Initial Conditions for Simulation
4.3. Numerical Values of the Parameters ci
5. Simulations
We now illustrate the numerical simulations of model system in Equation (1) using essentially the parameter values listed in Tables 1 and 2. For comparative purposes, occasionally, we do substitute different values for certain parameters such as contact rates c1, c2, and c3. This is to illustrate the effect or relative importance of a specific parameter. In such cases, the modified parameter values will be stated in the caption of each figure.
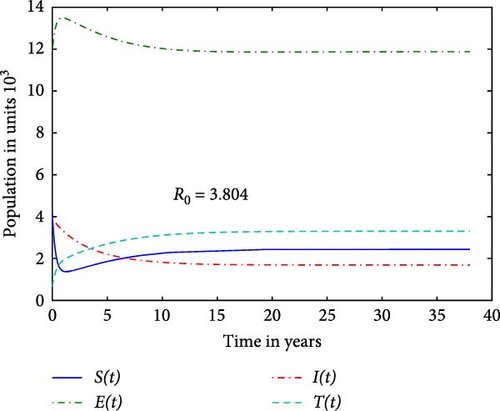
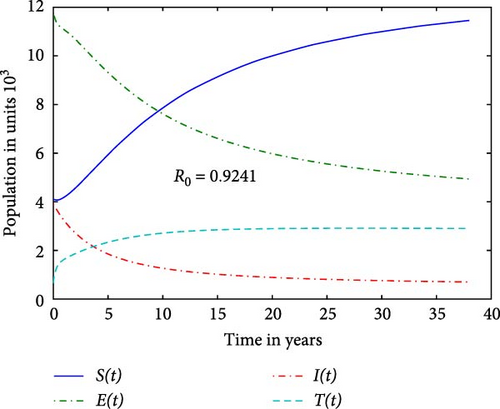
We first study our model without the inflow of infectives in order to examine for possible elimination of the disease. Figure 1 reveals that the prison system is unable to eliminate the disease due to high contact rate leading to R∗ = 3.804. We notice that when the contact rate c1 is reduced by a factor 0.3 of the value used in Figure 1, it gives R0 = 0.924 in Figure 2. This suggests that each infected individual, on average, causes fewer than one new infection, leading to a decline in the number of infections over time. A reduction in c1 will lower the term c1SI, resulting in fewer individuals transitioning from susceptible to exposed. This leads to a decrease in the infected I−class, which in turn helps stabilize the population of susceptible individuals. The graph indicates, in line with the elimination Theorem (1) in [16] that there is hope that the disease in the DRC prison system will vanish in the long term.
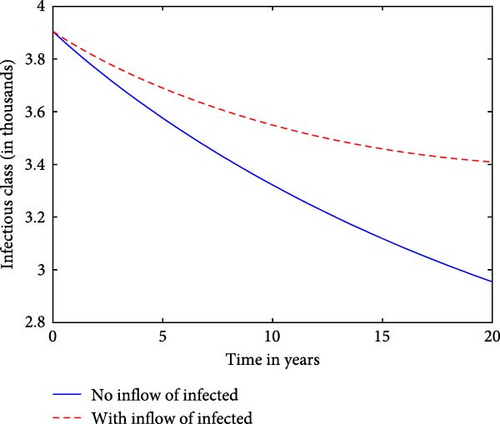
We now observe the infectious classes against time for a prison system, with and without the inflow of infectives in Figure 3. It shows that the presence of the inflow of infectives results in a higher and more sustained number of infectives over time. The curve with the inflow of infectives shows a higher and possibly more prolonged peak of infections, indicating a more sustained or intensified outbreak compared to the scenario without the inflow. This comparison illustrate how continuous introduction of new infected individuals affects the overall dynamics and persistence of the TB disease within the prison system. This implies that by preventing the influx of infected individuals, there exists a potential to eradicate the disease within the prison population. Numerous factors, including the arrival of infected inmates and the absence of isolation for sick patients, can significantly impact the endemicity of the disease.
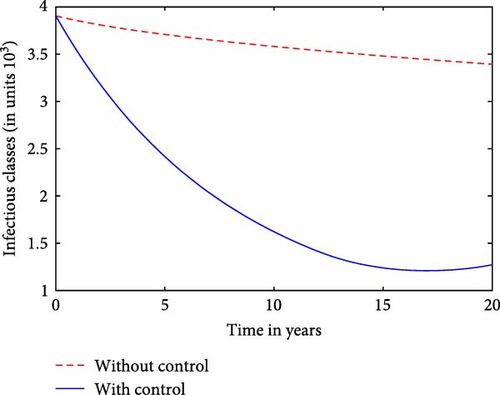
We observe that for a prison system with inflow of infectives and without effective control measures, the number of infectious cases will increase rapidly, leading to heightened transmission rates and a larger burden of TB within the inmate population as seen in Figure 4. On the other hand, with strict control measures such as treatment in our case, the spread of infectious TB diseases is mitigated and contained efficiently in Figure 4.
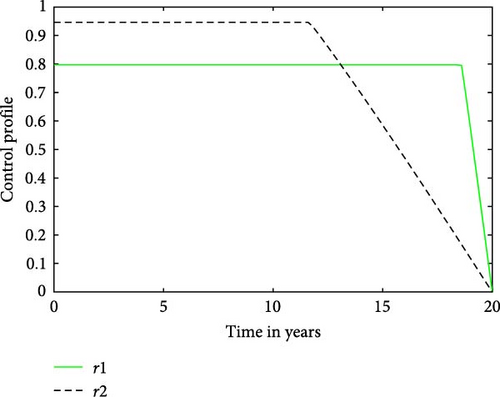
The control strategy which is quantified in Figure 5 is the best combination of the two selected options. Figure 5 shows that maintaining the treatment control, denoted as , at its highest level is recommended for approximately the initial 17 years of the intervention period. Hereafter, the treatment rate for latently infected may be reduced in a linear manner over the remainder of the period of control. This suggests the need for a consistent and elevated level of treatment control for the majority of the intervention period. It also implies that the duration of consistently high-level treatment control is longer for r1 (latently infected) compared to the infectious cases, . Specifically, the graph suggests that treatment control r2 should be applied at its maximum effort for approximately 12 years before gradually reducing to zero. Considering Figure 5, it might seem reasonable to claim that r2 could be deemed more effective. However, one ought to be cautious in making this assertion. While our objective is to decrease the number of TB infections, and r2 appears to potentially achieve this outcome in a shorter time frame, other factors must be carefully evaluated before determining its overall effectiveness. Nevertheless, it is crucial to recognize that the efficacy of a control strategy is influenced by diverse factors, and a thorough analysis is necessary to comprehensively evaluate the overall impact of each treatment control in reducing TB infections; see [35].
6. Conclusion
In this paper, we applied optimal control theory to a prison population in the DRC where treatment programs are not always maintained. Some of the parameter values that align with the DRC prisons have been calculated, while other were estimated. Numerical results indicate the extent to which in the absence of well-planned control strategies, the population experiences endemicity, whereas with optimal control, elimination of the disease is possible (subject to avoiding the influx of TB-infected prisoners). Control programs that follow these strategies can effectively reduce the number of infectious TB while minimizing treatment cost.
Regarding further mathematical analysis of the model, the recent papers [17, 20] show very useful results on equilibrium points that can be explored for models with inflow of infected. In particular, they describe lower bounds for infected classes which are experiencing inflow of infectives. The cost functions that we utilized were explorative, not meant to be accurate. If the necessary data in this regard are available, then the controls can be described more realistically. For better accuracy, one can opt for a two-group model as was done in [36], for instance, in which case, the awaiting-trial prisoners and the sentenced prisoners are regarded as two different groups. Stochasticity has been observed to have significant impact on stability of DFE points, for example [37]. It is also advisable to consider the effects of stochasticity on control of the system, for example [38, 39]. Another avenue that can be explored is fractional models, for example [40–44].
Parameter values for the model and initial values of the state variables have been deduced from publicly available data. In some cases, we had to make estimates or use nominal values. The results can be improved if more specific data can be generated in this regard. Also, the most meaningful results will arise if all the possible or practical interventions are considered. Nevertheless, the methods expounded in this article are insightful, and the results are informative.
Conflicts of Interest
The authors declare no conflicts of interest.
Funding
This research project did not receive any funding.
Open Research
Data Availability Statement
All the data utilized in this research were and are publicly available, and the sources are clearly referenced in this manuscript.


