Multi-UAV Cooperative Air Combat Target Assignment Method Based on VNS-IBPSO in Complex Dynamic Environment
Abstract
This paper investigates the threat assessment method and target assignment algorithm in multi-UAV cooperative air combat decision-making. To address the uncertainty and dynamic changes in multiple threat attributes and attribute information of UAV targets, we propose a UAV target dynamic threat assessment method based on intuitionistic fuzzy multiattribute decision-making. Firstly, we propose a mixed situation information representation method to represent interval-valued fuzzy data appropriately. Secondly, we employ the normal distribution weight assignment method to fuse the multi-time situation information. Then, by incorporating the analytic hierarchy process and entropy method, we determine the normalized threat value of the target considering both objective situation data characteristics and decision-maker preferences. Finally, a simulation example is provided to validate the rationality of our proposed algorithm. For solving the multi-weapon multi-target assignment problem, a target assignment method based on the VNS-IBPSO algorithm is introduced. This method improves upon the limitations of the BPSO algorithm, such as limited local search capability and premature convergence, by combining variable neighborhood search and an improved binary particle swarm optimization algorithm. Simulation results show that the proposed threat assessment method can obtain reasonable threat assessment results under complex dynamic environments. The proposed VNS-IBPSO algorithm can solve the target assignment model quickly and efficiently based on the assessment results, therefore ensuring that the UAV mission planning system makes the correct combat plan.
1. Introduction
Multi-UAV system has attracted increasing attention due to their high robustness, strong adaptivity, flexible scalability, and other advantages. In the military field, multi-UAV cooperative air combat has gradually become an important development trend of future war. It can not only improve combat efficiency and reduce combat losses but also reduce casualties and has broad application prospects. Air combat decision-making is the key for UAVs to win in air combat [1] and is a dynamic process that changes with the battlefield environment, requiring real-time adjustments to maximize the effectiveness of cooperative operations based on external interference and various internal uncertainties [2]. The Observe, Orient, Decide, and Act (OODA) loop combat theory [3] states that multi-UAV cooperative air combat decision-making encompasses several elements, including threat assessment, target assignment, maneuver decision, and motion planning [4, 5]. Among them, threat assessment serves as the basis for target assignment, and its accuracy and timeliness have a decisive impact on the entire decision-making process. Target assignment, on the other hand, is the comprehensive utilization of the threat assessment results, which requires the optimal allocation of various possible targets to ensure the maximization of combat effectiveness. With the continuous improvement of the intelligence level of UAV cluster combat, the future air war will pay more attention to self-organization and self-coordination. Therefore, the study of threat assessment and intelligent target assignment methods in uncertain environments to realize the coupling synergies of multilevel air combat decision-making is a critical research of cooperative air combat decision-making.
In the context of UAV air combat decision-making, it is imperative to base the process on an assessment of the battlefield environment. By obtaining reasonable assessment results, it is possible to ensure that the mission planning system generates the appropriate combat plan. Several threat assessment methods have been developed in the past to address this problem, for example, analytical hierarchy process (AHP) [6], fuzzy set theory [7], Technique for Order Preference by Similarity to Ideal Solution (TOPSIS) [8], and multiple attribute decision-making [9]. However, the aforementioned methods fail to account for the impact of changes in air combat situational information. Consequently, several methods for processing situational information under dynamic conditions have been introduced. Qiang et al. [10] proposed an improved group generalized intuitionistic fuzzy soft set (I-GGIFSS) method for dynamic assessment of air target threat. Wang et al. [11] used dynamic Bayesian network inference to estimate the target threat at different time slices. Kun et al. [12] obtained time series weights by a Poisson distribution method based on multiple target posture data. Intelligent optimization methods have a wide range of applications in various fields due to their excellent adaptivity and robustness [13]. For target threat assessment, Yu et al. [14] trained an LSTM neural network for LSS flying target threat assessment. Cao et al. [15] proposed a target threat assessment algorithm based on linear discriminant analysis and improved glowworm swarm optimization algorithm to optimize extreme learning machine. Multi-UAV cooperative air combat typically operates in dynamic and unpredictable environments, requiring real-time threat assessment. In order to better capture the complete dynamics of UAV target behavior and subtle variations indicative of potential threats, short time series data are employed for dynamic threat assessment of UAV targets. Short time series data are susceptible to noise and uncertainties, stemming from environmental factors, sensor inaccuracies, or intermittent communication. Managing and filtering out noise while preserving relevant threat information becomes crucial for effective threat assessment.
Multi-UAV cooperative air combat typically takes place in a formation, and there has even been the emergence of large-scale UAV swarm fighting as a representative mode. Due to the large scale of the problem and the high complexity of the solution, the traditional exact algorithms are difficult to meet the timeliness requirements of the decision-making of air combat [16–18]. With the continuous progress of artificial intelligence technology, solving large-scale target allocation problems based on intelligent optimization algorithms has gradually become the mainstream of research. Intelligent optimization algorithms are able to seek the approximate optimal solution of the problem within a limited time, providing fast and effective support for UAV cooperative air combat decision-making. Zhen et al. [19] proposed an improved cooperative target assignment scheme based on a contract network protocol for target attack mission of heterogeneous UAV swarm. Xing et al. [20] proposed a self-organized offense–defense confrontation decision-making algorithm for a dynamic swarm versus swarm UAV combat problem. Song et al. [21] established a realistic UAV target assignment model and proposed a differential evolution algorithm to solve the problem. Zhao et al. [22] developed an improved hybrid genetic algorithm to solve multi-weapon multi-target assignment (MWMTA) problem in uncertain environment. In addition, considering the issue of cooperative task assignment for heterogeneous UAVs, Gao et al. [23] proposed an improved multiobjective genetic algorithm, which incorporates a natural chromosome encoding format and specially designed genetic operators. The algorithm can effectually tackle the unavoidable deadlock phenomenon while preserving the randomness of the population. It is worth noting that the application of reinforcement learning–based methods in intelligent air combat decision-making is becoming increasingly prevalent and is currently a hot topic of research [24].
In summary, due to the difficulty of accurate modeling of the battlefield environment, the existence of uncertainty, and the measurement information of UAVs being prone to errors, it is necessary to introduce multiple uncertainties into air combat threat assessment to enable the decision-making system to make the most suitable decisions. In addition, traditional intelligent algorithms may fall into the “premature convergence” trap under large-scale complex scenarios. Therefore, designing an improved intelligent optimization algorithm that can effectively solve the problem of collaborative multitarget attack decision-making under uncertain environments is also a key focus of this article.
- 1.
In terms of threat assessment, a UAV target threat assessment model is constructed, representative threat factors are selected, and interval-valued intuitionistic fuzzy number characterization is used to address the uncertainty and incompleteness in the threat factor information.
- 2.
An evaluation method based on dynamic interval value intuitionistic fuzzy multiattribute decision-making is presented. For the time-varying nature of the enemy posture, time series weights are generated based on the normal cumulative distribution to fuse multimoment posture information. At the same time, an indicator weight optimization model integrating AHP method and entropy weight method is proposed, and the subjective and objective weight characteristics are comprehensively considered.
- 3.
A novel target assignment algorithm, Variable Neighborhood Search and Improved Binary Particle Swarm Optimization (VNS-IBPSO), is introduced to address the MWMTA problem. By enhancing the update strategy of Binary Particle Swarm Optimization (BPSO) and incorporating the variable neighborhood search (VNS) operator, it effectively addresses the limitations of local search capability in the initial phase and global search capability in the later phase of particle evolution. Simulation results demonstrate that the VNS-IBPSO algorithm effectively and efficiently identifies the optimal allocation scheme with excellent convergence properties.
The reminder of this article is organized as follows: Section 2 depicts the multi-UAV-coordinated air combat scenario and system model of target threat assessment and MWMTA. Section 3 introduces the target threat assessment method and process in detail. Section 4 analyzes the proposed VNS-IBPSO algorithm for solving MWMTA problem. In Section 5, the performance of the proposed algorithm was tested. Finally, Section 6 summarizes the article and proposes future development directions.
2. Problem Description and Modeling
A brief description of a multi-UAV-coordinated air combat scenario is given. To simplify the problem, it is reasonable to assume that enemy target situational information has been obtained through the search phase. Assume that the number of our UAVs is m and the number of enemy UAVs is n. The total number of weapon resources carried by all UAVs is q and weapon resources carried by each UAV is qi, i ∈ {1, 2, ⋯, m}. Our UAVs continuously obtain K time slices of situational information; time set is noted as t = {t1, t2, ⋯, tk}.Considering the threat factors of the enemy target and establishing threat assessment model. A list of key symbols used is provided in Table 1.
| Symbol | Definitions |
|---|---|
| m | The number of our UAVs |
| n | The number of enemy UAVs |
| q | The number of our weapons |
| s | The number of threat evaluation factors |
| qi | The number of weapons carried by each UAV |
| qj | The number of weapons assigned to each UAV |
| tk | Moment tk |
| Uq×n | Weapon target assignment matrix |
| Qq×n | Target damage probability matrix |
| Vq×n | The comprehensive threat assessment matrix of enemy UAVs to our UAVs |
|
|
Target situational information matrix obtained by ith UAV in moment tk |
| pkj | The damage probability of our kth weapon to the jthenemy target |
| Sij | The threat assessment value of the jth enemy UAV to our ith UAV |
| ojl | The lth threat factor value of the jth enemy UAV |
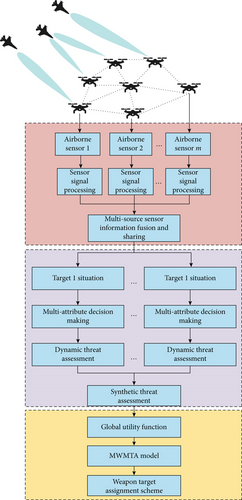
Figure 1 shows the UAV cooperative air combat decision-making flow based on the above parameters. Through the proposed threat assessment method, the dynamic threat assessment of the adversary UAV target is carried out. Next, weapon target assignment scheme is generated after receiving the synthetic threat assessment. Among them, the following key issues need to be addressed.
2.1. Selection of Threat Assessment Factor for UAV Targets
Target threat assessment should start with threat assessment factor selection from target situational information. It usually incorporates static and dynamic threat assessment factors. The static threat assessment component, which is usually fixed, represents the adversary UAV’s static features including target mobility, electronic countermeasure capabilities, and battle radius. The dynamic threat assessment element focuses on target motion scenario information, such as relative angle, speed, height, and distance, between the opponent and our UAV. Threat assessment parameters are chosen based on UAV cooperative air combat characteristics, as follows.
2.1.1. Speed Threat Factor
The radial velocity of the enemy UAV target is selected as the speed threat factor, and the near direction is positive and the far direction is negative. The faster the radial velocity of the UAV is, the stronger the maneuverability is and the greater the offensive advantage is. At the same time, the faster the speed can make the UAV get rid of the target or complete the pursuit of the target. It belongs to benefit-oriented factor.
2.1.2. Height Threat Factor
The target height refers to the vertical nearest distance between the target height plane of the enemy UAV and our UAV. The UAV at a higher altitude will occupy a more favorable attack position, and the corresponding weapon load can also obtain higher kinetic energy through the conversion of potential energy. Therefore, the higher target, the greater threat to us. It belongs to benefit-oriented factor.
2.1.3. Distance Threat Factor
The target distance refers to the projection distance on the horizontal plane of the connection between the both sides. Usually, the closer the enemy UAV’s target distance is, the more obvious the attack intention to us, the shorter defense time is, and the greater threat to us is. It belongs to cost-oriented factor.
2.1.4. Angle Threat Factor
The target angle threat can be described by the target entry angle. The target entry angle refers to the angle between the connecting line between the target and our UAV and target UAV speed direction. The smaller the entry angle is, the more obvious the target attack intention is and the greater the threat to us. It belongs to cost-oriented factor.
2.1.5. Radar Cross Section (RCS) Threat Factor
The enemy’s stealth performance is directly related to whether it is detected by airborne sensors. The smaller the RCS, the better the enemy’s stealth performance, the smaller the probability of being detected by airborne radar, and the greater the threat to us. It belongs to cost-oriented factor.
2.1.6. Type Threat Factor
The threat degree of different UAV types is different. In this study, the UAV target types are considered according to the combat function, which can be divided into four categories: attack UAV, interference UAV, scout UAV, and bait UAV.
2.2. Description of Mixed Situational Information in Treat Assessment
Due to data collecting difficulties, target behavior variability, and intelligence information conflict, target situational knowledge is unclear and fragmentary. Threat assessment using set numerical forms to express ambiguous information may provide erroneous, simplistic, and misleading conclusions that may impair decision-making. To define the uncertainty and incompleteness of target situational information, we construct mixed situational information using interval-valued numbers, intuitionistic fuzzy numbers, precise numbers, categorical variables, and other data types. Target situational information matrix obtained by ith UAV in moment tk is , j ∈ {1, 2, ⋯, n} and l ∈ {1, 2, ⋯, s}. The lth threat factor value of the jth enemy UAV is ojl, and the representation of ojl are as follows.
2.2.1. Interval Number Representation
Considering the detection error of the airborne sensor, the error is set to be Δτ. Then, it can be expressed by an interval number , the upper limit of it is and the lower limit of it is . is the initial attribute value detected by the airborne sensor.
2.2.2. Intuitionistic Fuzzy Number Representation
Considering that there are omissions or intelligence conflicts in the collection process of target situational information, then it can be expressed by an intuitionistic fuzzy number οjl = 〈μjl, νjl, πjl〉, where μjl is the membership degree, νjl is the nonmembership degree, and πjl = 1 − μjl − νjl is the hesitancy degree. They are calculated as follows:
2.2.3. Classification Variable Representation
When the threat factor value is a categorical variable, it is usually described by linguistic variables such as “very high,” “high,” “general,” and “low” based on domain knowledge. It needs to be transformed into the corresponding intuitionistic fuzzy number. The threat factor values corresponding to different types of UAV targets are shown in Table 2.
| Target type | Linguistic variables | Intuitionistic fuzzy number |
|---|---|---|
| Attack UAV | Very high | (0.90, 0.05) |
| Interference UAV | High | (0.75, 0.10) |
| Scout UAV | General | (0.50, 0.25) |
| Bait UAV | Low | (0.25, 0.20) |
2.2.4. Interval-Valued Intuitionistic Fuzzy Number Representation
Interval-valued number can be regarded as a special fuzzy number. In order to facilitate the subsequent calculation, when threat factor values are described as intuitionistic fuzzy number, it can be transformed into an interval-valued intuitionistic fuzzy number: .
After processing, the uncertain target situational information in complicated dynamic environments can be appropriately represented for target dynamic threat assessment. Section 3 details the threat assessment methodology and procedure.
2.3. Construction of Multiweapon and Multitarget Allocation Model
In this work, we assumed that all missions that were assigned would be finished simultaneously. This assumption could be divided into several assumptions, which are listed below.
Assumption 1. Assume that there is no time consumption for a UAV when conducting assignment. It means that every UAV could start and finish assignment simultaneously.
Assumption 2. Assume that the MWMTA problem would only be solved once and all assign operations would be started right after the allocation solved.
Assumption 3. Each UAV can use any number of weapon resource it carries to attack a target. Every weapon must be assigned to targets, and each weapon can only attack one target.
Assumption 4. The damage probability between the kth missile to the jth target is already known and is labeled as pkj. The threat value of the jth target against our ith UAV is also calculated beforehand through the threat assessment.
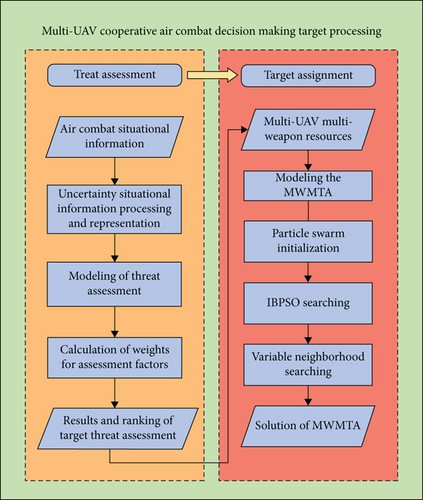
To summarize, Figure 2 illustrates the flowchart for the comprehensive target processing, which includes threat assessment and target assignment. Section 3 and Section 4 provide detailed explanations of the particular techniques and steps involved.
3. Interval-Valued Intuitionistic Fuzzy Multiattribute Decision-Making-Based Dynamic Threat Assessment
3.1. Timing Weighting Model
3.2. Threat Factor Weight Optimization Model
3.3. Procedure of the Dynamic Threat Assessment
The decision-making process of threat assessment based on dynamic intuitionistic fuzzy multiattribute decision-making is shown in Figure 3.

The specific steps are as follows.
Step 1. Based on the mixed situational information processing method in Section 2.2, the threat assessment model is constructed, and the decision matrix of target situational information at the moment is established as .
Step 2. According to Equations (6)–(10), combined with the time series weight model, the multitime weighted dynamic decision matrix is constructed by integrating the multitime target situational information.
Step 3. Since the entropy method needs accurate value to calculate the objective weight, the continuous ordered weighted average operator method is used to transform the interval-valued intuitionistic fuzzy number to accurate value according to the following equation:
Step 4. Calculate the weight of threat factors based on AHP method as . Calculate the weight of threat factors based on entropy method as .
Step 5. According to Equation (11) and Equation (12), calculate the optimal weight of threat factors based on threat factor weight optimization model as .
Step 6. Calculate the threat assessment value of the enemy UAVs to our ith UAV according to the following equation:
Step 7. The above threat assessment process is carried out for all UAVs, and the comprehensive threat assessment matrix of the enemy UAVs to our UAVs can be obtained.
4. VNS-BPSO Algorithm for MWMTA Problem
In this section, VBS-IBPSO optimization algorithm is proposed to solve the MWMTA problem under complex dynamic environment.
4.1. Concept of BPSO
BPSO is proposed by Kennedy and Eberhart in the year of 1997, where the PSO algorithm can solve the discrete combinatorial optimization problem [27].
Using the q × n variables in the weapon target assignment matrix as the solution space, the dimension of it is d = q × n. Denote Xid as one origin solution with the initial velocity Vid, and Xid is the binary encoded, as shown in Figure 4.

The rule in Equations (19) and (20) transforms the summation relationship between velocity and position into a mapping relationship. This means the greater the speed, the higher the probability of the position to take 1.
4.2. The Improved BPSO
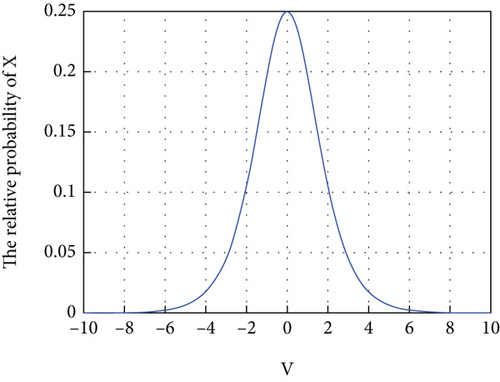
According to Equation (21), the correlation between the particle speed Vid and p(Δ) is shown as Figure 4.
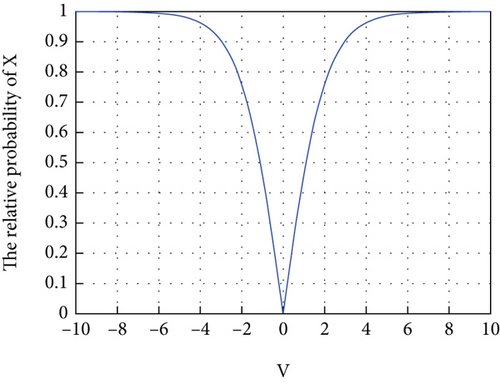
The difference between IBPSO and BPSO is the modification of function Trans and S(Vid). The correlation between the particle speed Vid and p(Δ) after the change of function is shown in Figures 5 and 6. The probability of bit changing tends to 0 when the particle velocity tends to 0. Moreover, when the particle velocity is positive, the binary bit value can only be changed to 1. Otherwise, the binary bit value can only be changed to 0. This method makes it easier for the particle swarm to approach the global optimal particle and improves the local search ability of the BPSO algorithm.
4.3. VNS Operator
The basic principle of the VNS algorithm is to obtain a wider search range by changing the neighborhood structure of multiple historical solutions within a local range [29]. That is, in the case of the same initial solution, the algorithm can expand a wider search space and has a more superior ability to jump out of the “premature trap.” Therefore, on the basis of IBPSO, the VNS operator is introduced to further improve its local search ability. The specific flow is shown in Figure 7.
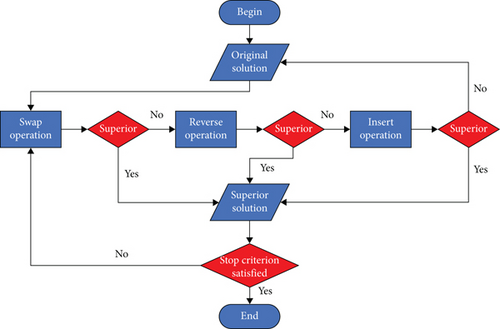
The core of VNS is the design of neighborhood search operation. In this section, three different neighborhood operations are designed for MWMTA, as follows:
4.3.1. Swap Operation
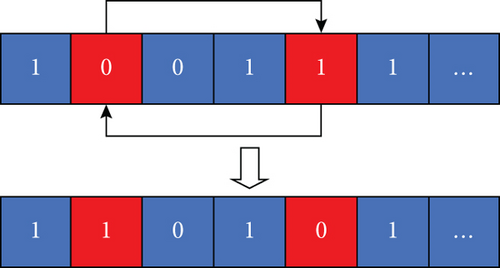
Suppose that in the MWMTA problem, the individual optimal solution of the current particle has been found by the IBPSO algorithm, and the values of the first and second positions in the solution space are swapped by the swap operation to obtain its neighborhood solution by arbitrarily choosing two positions in the solution space. The specific operation is shown in Figure 8.
4.3.2. Reverse Operation
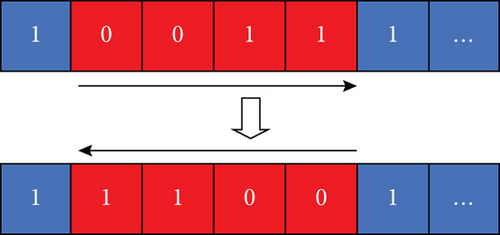
Suppose the current particle individual optimal solution has been obtained, arbitrarily choose two positions in the solution space and reverse all values between the first position and the first position by the reversal operation to reverse the ordering. The specific operation is shown in Figure 9.
4.3.3. Insert Operation
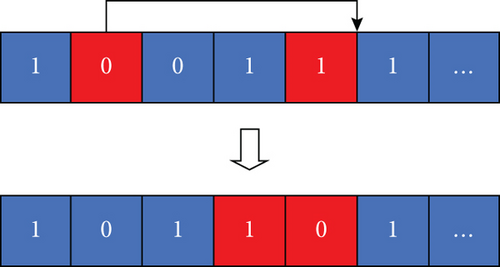
If the value of the former is smaller than the latter, the value of the former is inserted after the latter. Conversely, the value at the latter position is inserted after the former to obtain its neighborhood solution. The specific operation is shown in Figure 10.
4.4. Implementation of VNS-IBPSO
The pseudocode of VNS-IBPSO is shown in Algorithm 1. The hyperparameters that need to be set in advance include particle swarms, popsize, maximum number of IBPSO iterations, maxiter, learning coefficient factors ϕ1 and ϕ2, and maximum number of VNS iterations kmax.
-
Algorithm 1: The pseudocode of VNS-IBPSO.
-
Procedure VNS-IBPSO
-
Initialize the hyperparameters
-
For each particle i
-
Generate the position Xid and velocity Vid
-
Calculate its fitness
-
Set pbestid = Xid
-
End for
-
-
While iter ≤ Maxiter
-
For i= 1 to popsize
-
Update the velocity and position of particle i
-
Perform constraint processing on particles that do not satisfy the constraint
-
Calculate its new fitness
-
The new particle is
-
If
-
-
If
-
-
For k = 1 to kmax
-
Perform VNS operator on pbestid to get the local optimal value
-
The new particle is
-
If
-
-
If
-
-
iter = iter + 1
-
End while
-
Record and print process data
-
End procedure
The function Fit is the fitness function according to Equation (3). The main steps of IBPSO are explained as follows.
Step 1. Initialize the particle swarms including its population, maximum number of iterations, speed range of particle, and learning coefficient. Then, calculate the fitness value of each particle and record pbestid and gbestid.
Step 2. Update the particle swarms according to Equation (23) and Equation (24). Perform constraint processing on particles that do not satisfy the constraint and calculate the fitness value of new particle.
Step 3. Compare the updated fitness value of the particle with the historical optimal fitness value of pbestid. If the former is better than the latter, update the pbestid and further compare its value with the value of gbestid. After comparison, determine whether the current particle has been fully updated; if the update is complete, go to Step 4; otherwise, update the next particle.
Step 4. Denote k = 1, perform VNS operation on pbestid, and obtain the neighborhood solution . Perform constraint processing on it and calculate updated fitness value.
Step 5. Compare the updated fitness value of the particle with the historical optimal fitness value of pbestid. If the former is better than the latter, update the pbestid and further compare its value with the value of gbestid. After comparison, determine whether the current particle has been fully updated; if the update is complete, then continue to search within the local search range of the next neighborhood solution until k = kmax.
Step 6. If the number of iterations reaches its maximum value, then return gbestid and exit the algorithm. Otherwise, the iterative process of updating in the next round is started again from the first particle.
4.5. Algorithm Complexity Analysis
4.5.1. Time Complexity Analysis
The time complexity serves as a crucial metric for evaluating the computational efficiency of an algorithm in algorithmic analysis. It characterizes the growth pattern of an algorithm’s running time with respect to increasing input size, which is contingent upon the frequency of executing pivotal steps within the algorithm.
The VNS-IBPSO algorithm mainly contains the following steps: random initialization, fitness evaluation, fitness ranking, neighborhood generation, neighborhood search ranking, and updating the optimal particle position. Assuming that the number of initialized populations is N, the spatial dimension is d, the maximum number of iterations of the IBPSO algorithm is Imax, the number of iterations of the VNS operator is Kmax, the complexity of the random initialization algorithm is O(N∗d), the complexity of the fitness evaluation algorithm is O(N), the computational cost of the updating position stage is O(N∗d), the complexity of the fitness sorting stage is O(N∗logN), the complexity of the neighborhood generation stage is O(N2), and the complexity of the neighborhood search sorting stage is O(N2). In summary, the time complexity of the method can be estimated as follows: O(N∗d + Imax∗N(1 + logN + d) + kmax∗(2N2)).
4.5.2. Spatial Complexity Analysis
The spatial complexity of the VNS-IBPSO algorithm consists of four main aspects: the population space, the fitness value space, the neighborhood search space, and the temporary variable space. In population space, it needs to store the position information of each particle in the population. Therefore, the space required for the population is O(N∗d). In fitness value space, it needs to calculate the fitness value of each particle position and record the fitness value of the optimal particle. The extra space required for fitness values is O(N). The space of the set of solutions needed after each operation needs to be considered in neighborhood search space, which is O(N∗d). The extra space required for temporary variables is usually of constant level and negligible. In summary, the spatial complexity of the VNS-IBPSO algorithm is O(2N∗d + N).
5. Simulation Results and Analysis
The simulations are implemented in the MATLAB R2021a software environment, and the main configuration of the hardware environment is Win 10 laptop, Intel Core i9-11900H, 2.50 GHz CPU, and 16 GB RAM.
5.1. Simulation of Target Threat Assessment
Assume that after the target search and tracking identification phase, the adversary UAV cluster consists of six UAVs, marked as T = {T1, T2, T3, T4, T5, T6}. Our is composed of four UAVs, marked as T = {Γ1, Γ2, Γ3, Γ4}. Take Γ1 as an example; the target situational information of t1, t2, and t3 moments is obtained as multiattribute decision information for target threat assessment, based on the interval-valued intuitionistic fuzzy number for its representation, as shown in Tables 3 and 4.
| Target | Evaluation indicators | |||||
|---|---|---|---|---|---|---|
| Speed (m·s−1) | Height (m) | Distance (m) | Entry angle (°) | RCS (m2) | Type | |
| 1 | [0.38, 0.41] | 350 | 3320 | [0.43, 0.64] | 0.16 | [0.90, 0.95] |
| 2 | [0.39, 0.42] | 344 | 1720 | [0.37, 0.58] | 0.15 | [0.90, 0.95] |
| 3 | [0.38, 0.43] | 310 | 2955 | [0.27, 0.50] | 0.13 | [0.90, 0.95] |
| 4 | [0.38, 0.43] | 400 | 3600 | [0.16, 0.36] | 0.02 | [0.25, 0.8] |
| 5 | [0.39, 0.43] | 305 | 3200 | [0.32, 0.70] | 0.05 | [0.5, 0.75] |
| 6 | [0.39, 0.43] | 440 | 4800 | [0.16, 0.64] | 0.07 | [0.75, 0.90] |
| Target | Evaluation indicators | |||||
|---|---|---|---|---|---|---|
| Speed (m·s−1) | Height (m) | Distance (m) | Entry angle (°) | RCS (m2) | Type | |
| 1 | [0.38, 0.41] | 362 | 3270 | [0.43, 0.64] | 0.16 | [0.90, 0.95] |
| 2 | [0.39, 0.42] | 355 | 1805 | [0.36, 0.57] | 0.15 | [0.90, 0.95] |
| 3 | [0.38, 0.43] | 330 | 3005 | [0.27, 0.50] | 0.13 | [0.90, 0.95] |
| 4 | [0.38, 0.43] | 405 | 3705 | [0.16, 0.36] | 0.02 | [0.25, 0.8] |
| 5 | [0.39, 0.43] | 295 | 3200 | [0.32, 0.70] | 0.05 | [0.5, 0.75] |
| 6 | [0.39, 0.43] | 420 | 4800 | [0.17, 0.63] | 0.07 | [0.75, 0.90] |
The above threat assessment process is carried out for each of our UAVs, and the comprehensive threat assessment value of enemy UAVs to our UAVs is obtained. The specific values are shown in Table 5.
| Target | Evaluation indicators | |||||
|---|---|---|---|---|---|---|
| Speed (m·s−1) | Height (m) | Distance (m) | Entry angle (°) | RCS (m2) | Type | |
| 1 | [0.39, 0.42] | 345 | 3100 | [0.43, 0.64] | 0.16 | [0.90, 0.95] |
| 2 | [0.39, 0.42] | 350 | 2000 | [0.37, 0.58] | 0.15 | [0.90, 0.95] |
| 3 | [0.38, 0.43] | 320 | 3200 | [0.27, 0.50] | 0.13 | [0.90, 0.95] |
| 4 | [0.36, 0.45] | 415 | 3840 | [0.15, 0.37] | 0.04 | [0.25, 0.8] |
| 5 | [0.39, 0.43] | 305 | 3210 | [0.32, 0.70] | 0.08 | [0.5, 0.75] |
| 6 | [0.37, 0.45] | 435 | 4500 | [0.16, 0.64] | 0.05 | [0.75, 0.90] |
5.2. Simulation of MWMTA
After completing the threat assessment of the enemy UAV targets, the MWMTA phase is entered. Assume that each UAV carries two weapons, and the number of weapon resources to attack the same target is at most two. The target threat of six enemy UAVs to our four UAVs and the damage probability of our eight weapons to six enemy UAVs are given in Tables 6 and 7. To ascertain the efficacy of the VNS-IBPSO algorithm and do a comparative analysis of its performance, three widely used algorithms are also tested. They are BPSO, IBPSO, and hybrid genetic algorithms. The operational parameters used by the above algorithms are given in Table 8. The curve of the optimal fitness value, the expected value of operational effectiveness, and the expected value of residual target threat are given in Figures 11, 12, and 13.
| Targets | Target threat | |||||
|---|---|---|---|---|---|---|
| 1 | 2 | 3 | 4 | 5 | 6 | |
| 1 | 0.488 | 0.426 | 0.400 | 0.278 | 0.342 | 0.414 |
| 2 | 0.254 | 0.203 | 0.252 | 0.601 | 0.275 | 0.482 |
| 3 | 0.195 | 0.341 | 0.235 | 0.371 | 0.164 | 0.335 |
| 4 | 0.614 | 0.109 | 0.631 | 0.484 | 0.292 | 0.195 |
| Weapons | Hit rate | |||||
|---|---|---|---|---|---|---|
| 1 | 2 | 3 | 4 | 5 | 6 | |
| 1 | 0.29 | 0.92 | 0.23 | 0.89 | 0.14 | 0.72 |
| 2 | 0.49 | 0.82 | 0.41 | 0.10 | 0.51 | 0.37 |
| 3 | 0.33 | 0.46 | 0.39 | 0.90 | 0.43 | 0.30 |
| 4 | 0.12 | 0.38 | 0.52 | 0.26 | 0.71 | 0.41 |
| 5 | 0.22 | 0.15 | 0.44 | 0.29 | 0.21 | 0.13 |
| 6 | 0.61 | 0.95 | 0.76 | 0.32 | 0.24 | 0.19 |
| 7 | 0.44 | 0.56 | 0.16 | 0.22 | 0.88 | 0.17 |
| 8 | 0.81 | 0.42 | 0.35 | 0.43 | 0.77 | 0.90 |
| Algorithm | Main reference | Parameters |
|---|---|---|
| BPSO | [27] | Population size = 150, iteration times = 200, learning coefficients factors ϕ1 = ϕ2 = 2 |
| IBPSO | [30] | Population size = 150, iteration times = 200, learning coefficients factorsϕ1 = ϕ2 = 2 |
| Hybrid GA | [22] | Population size = 150, iteration times = 200, the weights ω1 and ω2 of target decision model are set to 0.6 and 0.4, penalty factor N = 150 |
| VNS-IBPSO | This paper | Population size = 150, iteration times = 200, learning coefficients ϕ1=0.8 and ϕ2=0.9, VNS operations times kmax = 30, penalty factor M = 100 |
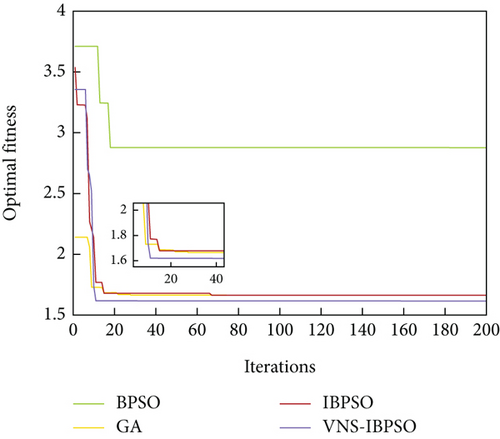
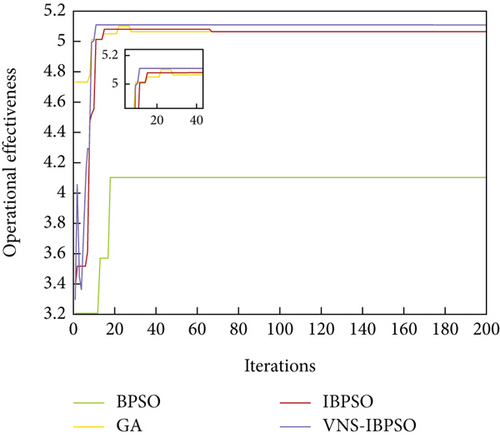
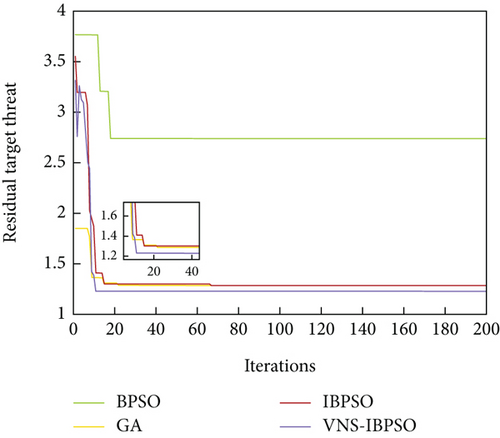
The weapon target assignment scheme is as follows: Weapon 8 attacks Target 1, Weapon 2 attacks Target 2, Weapons 5 and 6 attack Target 3, Weapon 3 attacks Target 4, Weapon 7 attacks Target 5, and Weapons 1 and 4 attack Target 6.
5.3. Comparative Analysis
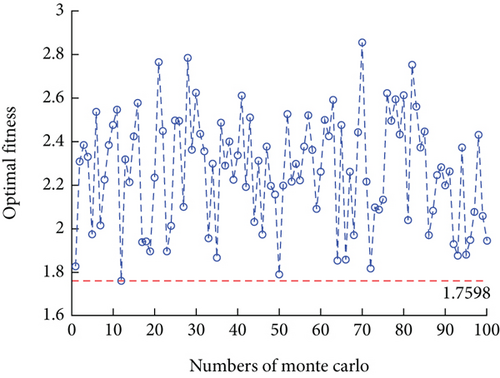
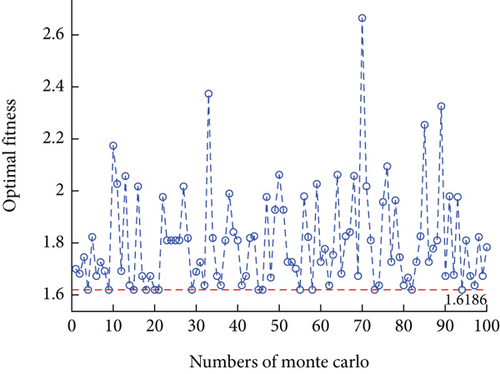
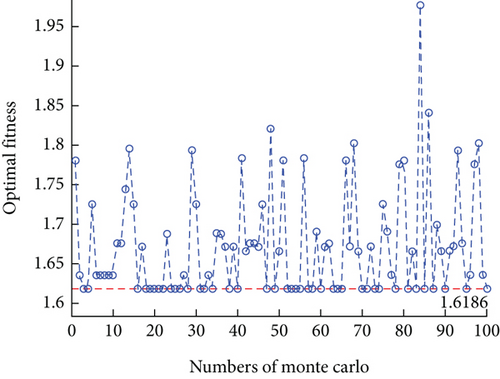
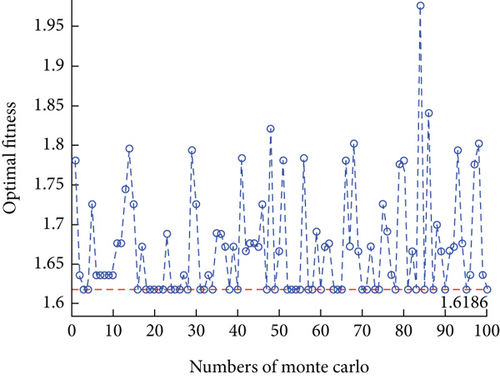
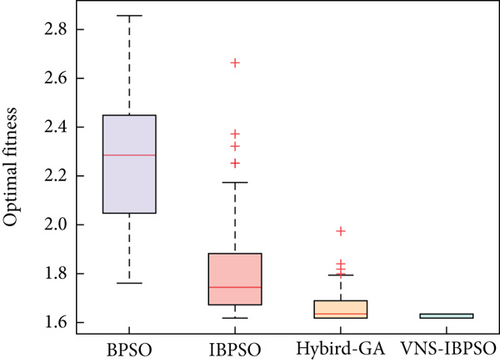
To mitigate the inherent instability and uncertainty of a single experiment, we conducted 100 experiments for each tested algorithm using Monte Carlo simulation. In each experiment, the algorithms were run for a maximum of 200 iterations. The variation curves of the optimal fitness values are shown in Figures 14, 15, 16, and 17. To compare the results of each algorithm more clearly, a boxplot is given as Figure 18. The statistical analysis of the algorithm performance is obtained, as shown in Table 9.
| BPSO | IBPSO | Hybrid GA | VNS-IBPSO | |
|---|---|---|---|---|
| Number of iterations of convergence | 20 | 62 | 22 | 9 |
| Single iteration time (s) | 0.276 | 0.108 | 0.212 | 0.453 |
| Convergence time (s) | 5.52 | 6.86 | 4.66 | 4.08 |
| Fitness interval | [1.7598, 2.8563] | [1.6186, 2.6649] | [1.6186, 1.9763] | [1.6186, 1.6316] |
| Fitness mean | 3.0625 | 1.8025 | 1.6717 | 1.6251 |
| Fitness variance | 0.0659 | 0.0363 | 0.0047 | 0.0001 |
- 1.
The optimal fitness values achieved by VNS-IBPSO for addressing the MWMTA problem are the same as those obtained by Hybrid GA and IBPSO algorithms, indicating the validity of the solution results. As shown in Table 9, the mean and variance of VNS-IBPSO are substantially smaller than the other three algorithms’, indicating that its solution is the most stable.
- 2.
Figures 14, 15, 16, 17, and 18 show that the VNS-IBPSO algorithm has a much higher convergence rate than the other three algorithms because it balances global and local search ability during each round of iteration, suppressing immature convergence and improving solution effectiveness.
- 3.
Because its solution quality and convergence rate are better than the other three algorithms, VNS-IBPSO can identify the optimal feasible solution in the quickest time when solving the same problem.
- 4.
The VNS-IBPSO increases algorithmic complexity, especially for problems with long calculation and solution times. Within the context of this research, the VNS-IBPSO algorithm has faster convergence, higher solution efficiency, and better quality than the other four algorithms.
6. Conclusion
In the context of multi-UAV cooperative air combat, this paper examines target threat assessment and MWMTA algorithm in complicated dynamic environments. Due to target situational information ambiguity and incompleteness, interval-valued intuitionistic fuzzy number representation is proposed for target threat assessment. Timing weighting and threat factor weight optimization models assess and rank UAV targets. The MWMTA challenge is described as a multiobjective optimization problem to minimize UAV threat and maximize weapon operating effectiveness. To address the BPSO algorithm’s poor local search and premature convergence, VNS operator and V-shaped update scheme are used in a VNS-IBPSO algorithm. Simulation results suggest that the proposed methods are acceptable and effective.
This paper addresses the MWMTA problem in the presence of uncertainties regarding target posture. In practical air combat scenarios, the task of target assignment encounters various uncertainties. Firstly, uncertainty arises from the availability of weapon resources. Secondly, there is uncertainty associated with the characteristics of the target. The interplay between these uncertainties introduces additional complexities to the task of target allocation. Consequently, aligning with combat style characteristics and considering various uncertain factors, researching multi-UAV target assignment methods tailored to actual combat needs is a crucial developmental focus in this field.
Disclosure
This paper was previously published as a preprint version in Authorea. It is available from https://www.authorea.com/users/637597/articles/653825-multi-uav-cooperative-air-combat-target-assignment-method-based-on-vns-ibpso-algorithm-in-complex-dynamic-environment.
Conflicts of Interest
The authors declare no conflicts of interest.
Funding
This work was supported by the National Natural Science Foundation of China (grant no. 11774432).
Open Research
Data Availability Statement
Data will be made available on request to the authors.


