Impacts of a Cold-Wave Event on Civil Aviation in China: A November 2022 Case Study
Abstract
A cold wave is a hazardous event experienced in the middle latitudes during the winter that significantly influences civil aviation. This study utilized the fifth-generation ECMWF reanalysis (ERA5) data and aerodrome routine meteorological reports (METARs) from 36 airports in China to analyze the impacts of a cold-wave event from November 26 to 30, 2022. We assessed the effects on wind, visibility, thunderstorms, precipitation, ground-icing conditions, in-flight aircraft icing conditions, and clear air turbulence. The results indicated that regions affected by the cold wave shifted from northwest to southeast, with notable impacts on wind, precipitation, and icing conditions. Strong winds, particularly crosswinds, affected airports in coastal regions and narrow valleys, enhancing wind speeds and creating hazardous conditions. Ground-icing conditions were prevalent, with 23 out of 36 airports experiencing significant icing, notably in Northeast, Central, southern, and eastern China. In-flight icing conditions were identified in the lower and middle troposphere, primarily affecting Northwest, Northeast, and Central China and the middle and lower reaches of the Yangtze River. At cruising levels, the cold wave introduced light clear air turbulence. This study provides valuable insights for improving civil aviation operations during cold-wave events, emphasizing the need for preventive measures and early warning systems to mitigate potential risks.
1. Introduction
Cold air from high latitudes can intensify and invade the middle and low latitudes under certain conditions, causing a wide range of temperature drops, wind, and rain and snow. This phenomenon is termed a cold wave. A cold-wave event is hazardous for middle and low latitudes and can damage crops, livestock, buildings, and other infrastructure [1]. China, among some other countries, has a high expected annual population that is affected by cold-wave events [2]. In January 2008, the coexistence of low temperatures, rain, snow, and freezing rain caused by a strong cold-wave event was the main reason for the disaster that occurred in southern China [3, 4]. The “boss-level” cold-wave event in 2016 led to direct economic losses of more than 151.65 billion CNY. The November 2021 cold-wave event, which was the second strongest to occur between 1981 and 2021, brought heavy snow to Northeast China [5, 6]. In late November 2022, the strongest cold-wave event of the year swept across most regions of China. These cold-wave events were linked to Siberian high pressure (i.e., the Siberian High), El Niño/La Niña, subtropical western Pacific high, Middle East jet stream, and stratosphere anomalies [7–10]. Cold-wave days decreased in China from 1960 to 2016 and became milder [11, 12]. Against the backdrop of global warming, the occurrence of cold-wave events is likely to be frequent in the future [13]. Therefore, investigations of the impacts of cold wave will not only establish a theoretical foundation but also provide more adaptation measures to address these impacts.
To date, the impacts of cold wave on energy power, mortality, plants, and animal husbandry have been researched [14–20]. Little research, however, has focused on the impacts of cold wave on civil aviation. Civil aviation is operated in the troposphere and lower stratosphere. Atmospheric processes, such as wind and condensation, do affect aviation [21]. When taking off and landing, a headwind that is blowing from in front of the plane is preferable. Because the wind condition is not always coming from the front, different types of planes have criteria for tailwinds (blowing from behind) and crosswinds (blowing across direction of airplane) to keep them safe [22, 23]. A tailwind will lengthen the distance needed to take off or for a landing run [24], and a crosswind will deflect the airplane. Both conditions may lead to overshooting the runway. Crosswind not only may deflect the airplane but also can make it roll [25]. In addition to wind, variations in wind will also influence flights. Sudden changes in the wind can form low-level wind shear and aircraft turbulence that may threaten the airplane during take-off and landing [26]. In recent decades, new technology, methods, and facilities have been developed to detect and forecast these changes [27, 28, 29, 30, and 31]. A cold wave can bring strong winds along its path, leading to restrictions due to both high-level turbulence and low-level wind shear in civil aviation operations.
Weather is a vital factor that can affect flight safety and operation efficiency. Condensation is the main process in which cloud, precipitation, and fog form [32]. All of these phenomena may reduce visibility when the pilot is flying. Visibility is one of the determining factors for flights to take off and landing and may even cause airport closures. If visibility is lower than that in the aerodrome operating minima, pilots will determine not to take off or to land at the airport. In civil aviation, prevailing visibility and runway visual range (RVR) are the main metrics when observing and forecasting visibility. Prevailing visibility refers to the greatest horizontal visibility, which is equal to or exceeding half of the airport area [33]. RVR is measured by RVR equipment and represents the maximum distance at which the runway, or the specified lights or markers delineating it, can be seen from a position above a specified point on its centerline. Low visibility can also be caused by other phenomena, such as sandstorm, haze, and smoke, which are not related to condensation. Note that strong wind and dry air introduced by a cold wave can increase visibility [34].
A thunderstorm is the most dangerous weather phenomenon for aviation because of strong wind, heavy rain, lightening, wind shear, turbulence, and low visibility in and beneath clouds [35–37]. When there are thunderstorms in destination airports, flights will fly to an alternate airport, and thunderstorms in departure airports can lead to delays or cancelations [38]. Precipitation also reduces visibility and can make the runway wet and slippery, worsening aircraft performance [39]. In the presence of sleet, freezing rain, and other mixed-phase state or solid precipitation, ground icing may occur. Because of the low temperature caused by a cold wave, icing conditions may occur at both ground level and aloft that can threaten flight safety [40, 41]. Cold-wave events also can increase the horizontal gradient of temperature, which could strengthen the jet stream. Wind shear in the jet stream may generate clear air turbulence, which refers to turbulence that is unrelated to convection cloud above 6,000 m [42, 43].
In this study, we analyzed the impacts of a cold-wave event during November 26–30, 2022, in particular wind, visibility, thunderstorm, precipitation, ground-icing conditions, in-flight icing, and clear air turbulence.
- 1.
Severity and impact: This particular cold wave was the strongest of the year, affecting a vast region across China. It presented extreme weather conditions, including significant temperature drops, strong winds, and various forms of precipitation, which provided a comprehensive case for studying the multifaceted impacts of cold waves on civil aviation.
- 2.
Temporal and spatial extent: The event’s duration from November 26 to 30, 2022, allowed for a detailed analysis of the progression and spatial dynamics of the cold wave. The shift of affected regions from northwest to southeast mirrored the typical pathway of cold waves influenced by the Siberian High, making it a representative case for understanding broader regional impacts.
- 3.
High-impact weather conditions: The cold wave included a variety of high-impact weather phenomena such as strong crosswinds, ground icing, in-flight icing, and clear air turbulence. These conditions directly affected airport operations and flight safety, providing a rich dataset to assess the specific challenges faced by the aviation industry.
This paper is organized as follows: data and methods are described in Section 2, and results are discussed in Section 3. Discussion and conclusions are presented in Section 4.
2. Materials and Methods
2.1. Data
To analyze the cold-wave event and the potential influence on icing and clear air turbulence condition, we used fifth-generation ECMWF reanalysis (ERA5) hourly reanalysis data. The time span of the data utilized in this study was from November 26 to 30, 2022, and the horizontal spatial resolution is 0.25° × 0.25° [44].
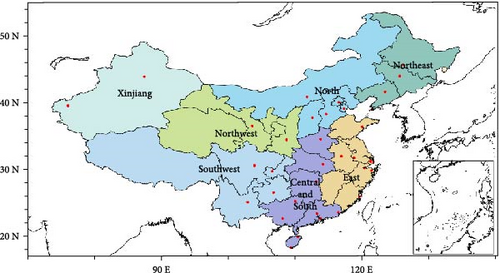
To evaluate the impacts on civil aviation, we analyzed the aerodrome routine meteorological reports (METARs) for 36 airports in mainland China. These reports are issued every hour (every half hour for certain airports). Aerodrome meteorology offices and stations that provide meteorological services and observation are essential to airports. One of the responsibilities of this office is to observe and report meteorological elements at fixed time intervals 24 h a day, year round. The reported information is named METAR, and the format of METAR is recommended by the International Civil Aviation Organization (ICAO), including station identifier, time, surface wind, visibility, clouds, and present weather. Civil aviation airspace in mainland China is divided into seven regions, which are North, Northeast, Northwest, Xinjiang, Southwest, Central and South, and East. The locations of the 36 airports and regions they belong are shown in Figure 1, and details, including identifier, name of airport, latitude, longitude, elevation, runway number, and highest instrument landing system category, are included in Appendix A (information about runway number and instrument landing system category are described in Sections 2.2.1 and 2.2.2, respectively).
2.2. Methodology
In this study, we discussed the restrictions and impacts on ground operation and the potential impacts of the cold wave in flight separately. For ground operations, the main limitations come from strong wind and low visibility/RVR induced by weather, including thunderstorms, rain, and fog. In addition, we also analyzed weather phenomena that may worsen aircraft performance and airport operation efficiency, including ground-icing conditions. Furthermore, we used ICAO-recommended indices to verify in-flight icing and clear air turbulence conditions.
2.2.1. Limitations of Crosswind
For take-off and landing, wind limitations include the tailwind and crosswind. Appendix A gives the runway numbers for all of the airports in this study. Runway numbers are determined based on the magnetic azimuth direction of take-off and landing. By rounding to the nearest 10° and removing the last digit, the runway number can be obtained (if parallel runways are presented, the letter L or R indicates the left or right runway). Every runway has two numbers, and they are reciprocal. Take an east-west runway as an example, if the aircraft is landing from west to east, compass bearing is 90° (runway number is 09), while when landing from east to west, the compass bearing is 180° (runway number is 18). The symbol “/” is used between the two numbers of a runway in Appendix A. When the tailwind is greater than the limitation which varies according to different airlines but 5 m/s in general, the opposite direction can be used. Therefore, we focused on the crosswind limitations. We obtained wind direction and speed from METARs and the decomposed wind to the crosswind component and tailwind/headwind component according to runway direction. The maximum crosswinds varied depending on the different types of airplanes and the runway conditions. In this study, we considered the minimum limitations of the crosswind for Boeing and Airbus to be 14 m/s for a dry runway and 7 m/s for a wet runway [45].
2.2.2. Limitations of Visibility or RVR
Limitations of visibility or RVR varied because of the different navigation aid facilities, phases of flight, and pilot qualifications. The value of visibility or RVR required in landing is greater than that needed for take-off. Therefore, when discussing the limitations of visibility or RVR, landing was the main concern. All 36 of the airports in this work had an Instrumental Landing System (ILS) but were in different categories (CAT). These categories were divided according to the required minimum prevailing visibility, RVR, and decision altitude or decision height (DA/H). The importance of prevailing visibility and RVR was addressed in Section 1. DA/H was considerable when taking off or landing. When the cloud base height or vertical visibility was lower than the DA/H, the pilots had to initiate a missed approach because the required visual reference to continue the approach could not been established. As noted in Appendix A, among the 36 airports studied in this work, 17 airports operated in CAT I, which required a minimum visibility of 800 m or an RVR of 550 m with a DA/H of 60 m or higher; 15 air-ports belonged to CAT II and could operate when the RVR was no less than 350 m and the cloud base height or vertical visibility was no less than 30 m; and 3 airports belonged to CAT IIIa with a minimum RVR of 175 m and a DH of 15 m. Note that ILS categories can differ in different runways even in the same airport. In this study, we considered only the highest category at one airport.
2.2.3. Ground-Icing Condition
Icing condition is related to temperature and humidity. Visible moisture or water and snow accumulated on the runway when the outer atmospheric temperature is lower than 5°C is called the ground-icing condition [46]. METARs report the outer atmospheric temperature and present weather phenomena. When analyzing METARs, the ground-icing condition is recorded if the present weather includes rain, snow, mixed rain and snow, ice pellets, or fog, and the temperature is less than 5°C.
2.2.4. In-Flight Aircraft Icing Condition
Relative humidity (RH) and temperature (T) are the dominant variable for Ic. When RH is greater than 50% and T is between −14 and 0°C, the condition favors aircraft icing. The relative icing strength can be divided into three levels, as given in Table 1; however, no icing is considered when the RH is less than 50% or T is not between −14 and 0°C.
| Light | Moderate | Severe | |
|---|---|---|---|
| Ic | 0≤Ic < 50 | 50≤Ic < 80 | Ic ≥ 80 |
2.2.5. Clear Air Turbulence Condition
3. Results
3.1. Cold Wave During November 2022
Figure 2 shows the evolution of the mean sea-level pressure, temperature at 2 m, wind at 10 m, and precipitation in this cold-wave event. At 00:00 on November 26, a weak high pressure was noted in Northeast China, and the Siberian High was identified in northwest Lake Balkhash. As the Siberian High moved from Northwest to Southeast China, the temperature fell. In the meantime, the wind strengthened significantly. The leading edge of the Siberian High moved to northwestern China on 27 November, which contributed to the temperature decreasing lower than −25°C and the wind strengthening by more than 12 m/s in northwestern China. On November 28, the temperature in most of northern China was lower than 0°C because of the cold high-pressure system. In the following 2 days, with the leading edge of the Siberian High moving to the southeastern China, the temperature decreased and the wind speed increased significantly. In the middle and lower reaches of the Yangtze River region, the temperature was around 0°C which is rare in late November. When the leading edge moved over the sea, the wind strengthened because of reduced friction. In the meantime, abundant precipitation was present in southern China as a result of the sufficient water vapor.
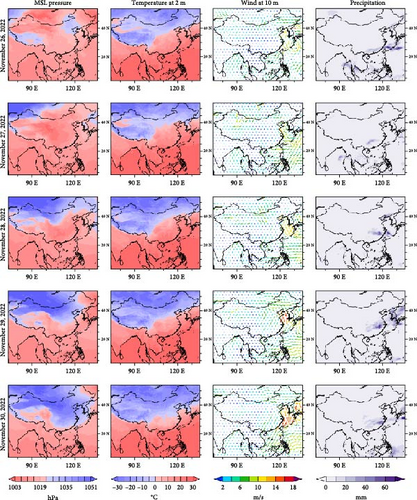
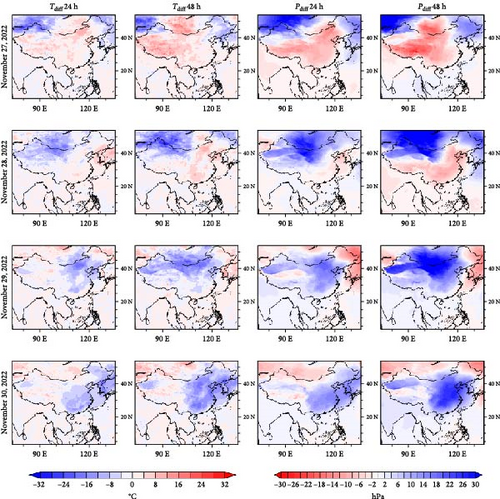
According to the cold-wave standards specified by China Meteorology Administration, when an abrupt temperature drop greater than 8°C in 24 h (or 10°C in 48 h), a minimum temperature less than 4°C, and a strong wind that was greater than level 5 (i.e., greater than 8.0 m/s) or level 6 (i.e., greater than 10.8 m/s) over land (ocean) occurred, it can be classified as cold wave. As shown in Figure 2, the winds and temperature that occurred met these standards. The two columns on the left side of Figure 3 show the temperature differences at 24 h and 48 h. Beginning on November 28, 24-h temperature decrement moved from northwestern China and southwestern Mongolia to southeastern China that were greater than 8°C. Characteristic temperature differences in 48 h were analogous to those that occurred in 24 h. In the meantime, the pressure increased from Northwest to Southeast China (see the two columns on the right side of Figure 3) because of the movement of a strong Siberian High.
3.2. Impacts on Ground Operation
3.2.1. Restrictions on Ground Operation
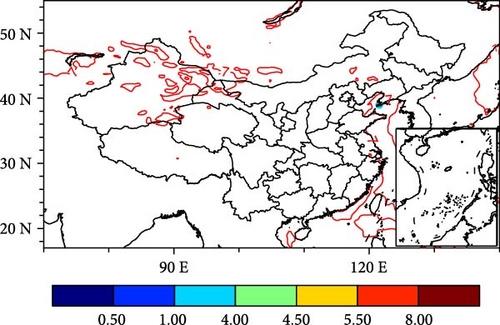
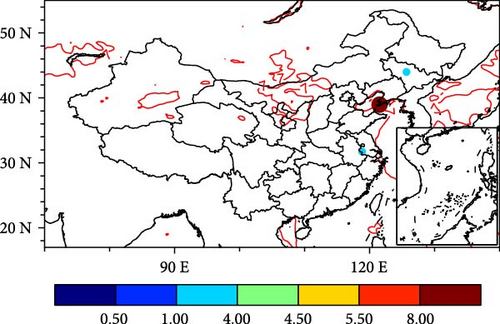
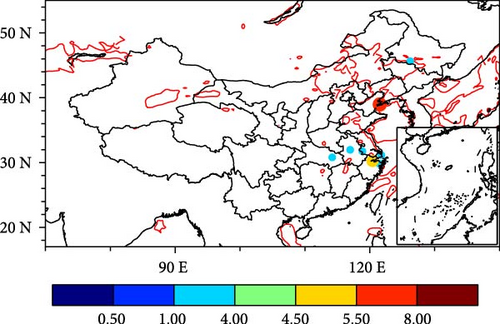
As mentioned in Section 2, wind and visibility are the main concerns in ground operation. The strong wind caused by the cold wave influenced ground operations in 11 airports. Figure 4 shows these airports and the duration of the crosswind exceeding the limitation. Daily maximum wind speed derived from ERA5 are also shown in Figure 4. On November 26, the leading edge of the cold wave was in the northwest Xinjiang Province, and two airports in Xinjiang Province experienced crosswind restrictions. The strong wind brought sand to west Xinjiang, which also decreased the visibility. When the Siberian High moved to the east and south, Dalian airport (ZYTL), which is located in the southernmost coastal area of northeastern China, experienced a 1-h crosswind restriction on November 27. On November 28, Dalian airport experienced an 8-h crosswind restriction, and another airport in Northeast China and one airport in Southeast China also encountered a 1-h crosswind restriction. Dalian airport experienced 5.5 h of crosswind restrictions on November 29. In addition, crosswind restrictions occurred at six airports along the middle and lower reaches of the Yangtze River.
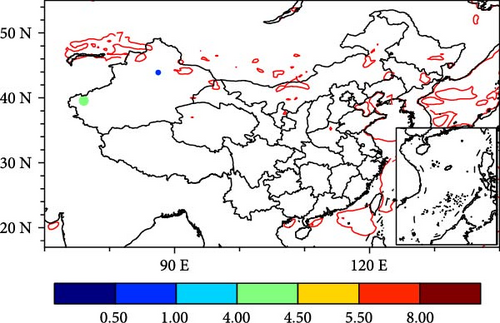
In the cold-wave event, airport visibility was reduced because of blowing sand, precipitation, or fog. The visibility was greater than the operation standards, however, except for Wuhan airport (ZHHH) and Hefei airport (ZSOF). These two airports are located in the middle and lower reaches of the Yangtze River, and low visibility caused by fog occurred on November 26 when the leading edge of the Siberian High was far away from the river.
3.2.2. High-Impact Weather Phenomena
Blowing sand and fog (discussed in Section 3.2.1) are two kinds of high-impact weather phenomena. In this section, we concentrated on two of the main types of high-impact weather: thunderstorm and precipitation.
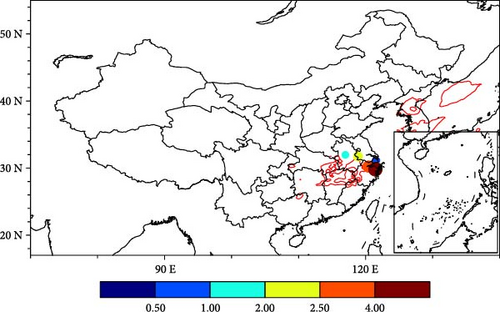
In the cold-wave event, a thunderstorm occurred only on November 28. Figure 5 shows the duration of the thunderstorm at six of the airports located along the middle and lower reaches of the Yangtze River. Two of the longest thunderstorms that occurred in Ningbo airport (ZSNB) and Hangzhou airport (ZSHC), which were 4 and 2.5 h, respectively.
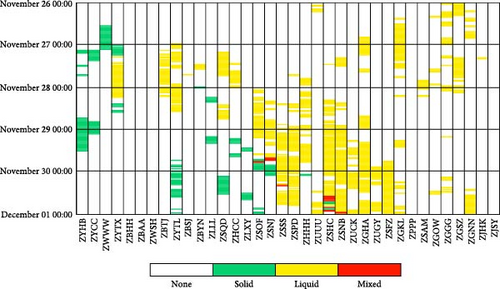
The phase states of precipitation that occurred at the airports are shown in Figure 6. Thirty-two airports experienced precipitation. On November 26, snow fell in Urumqi airport (ZWWW), which is located in Northwest China, and liquid precipitation (rain and drizzle) was scattered across southern China. With the movement of the Siberian High, solid precipitation coverage shifted to the east and south. Late on November 29, the precipitation phase in southern China began to change. Hefei airport (ZSOF) and Nanjing airport (ZSNJ) experienced ice pellets, sleet, and snow. On November 30, Shanghai Hongqiao airport (ZSSS), Hangzhou airport (ZSHC), and Ningbo airport (ZSNB) experienced a phase-state transition of precipitation. In this cold-wave event, precipitation did not cause visibility to drop below the limitation, but solid precipitation and mixed precipitation may have led to a slippery runway and icy conditions.
3.2.3. Ground-Icing Condition
Based on the definition of ground-icing conditions, we calculated the daily duration of ground-icing conditions at the airports. This ground-icing condition also followed a northwest–southeast shift characteristic. On November 26, two airports in Northwest China were severely affected by ground-icing conditions (Figure 7(a)). Northeast China and northern China become the main regions that experienced severe ground-icing conditions on the next 2 days (Figures 7(b) and 7(c)). Shenyang airport (ZYTX) experienced 20.5 h of ground-icing condition on November 27, which was the greatest daily duration of a ground-icing condition recorded for this cold-wave event. As the Siberian High moved to Southeast China, airports in the middle and lower reaches of the Yangtze River experienced ground-icing conditions (Figures 7(d) and 7(e)).
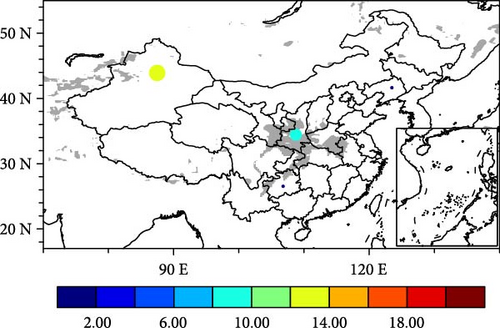
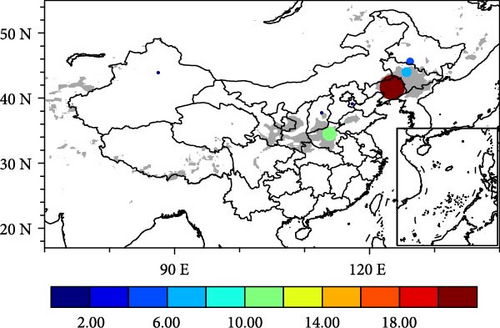
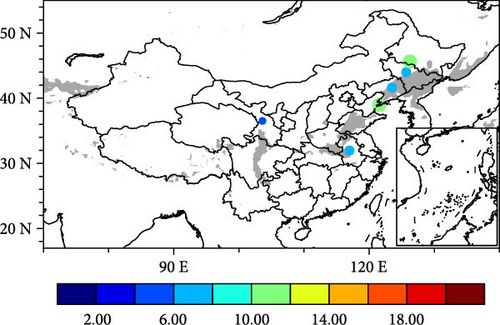

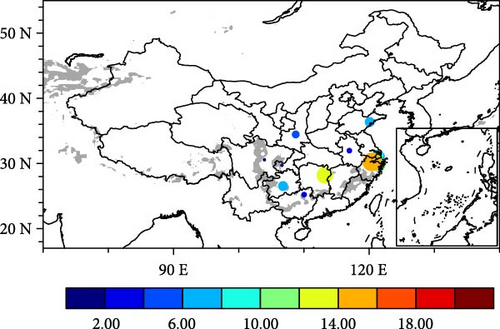
The accumulated duration of ground-icing condition during the cold-wave event is shown in Table 2. Twenty-three airports experienced ground-icing conditions, including all of the northeast airports. The greatest accumulated duration of a ground-icing condition was at Shenyang airport (ZYTX), which lasted nearly 28 h. In addition to airports in Northeast China, the areas north of Central and South China, Northwest China, and East China also were affected by the ground-icing conditions.
| Identifier | Region | Accumulated duration (h) | Identifier | Region | Accumulated duration (h) |
|---|---|---|---|---|---|
| ZYTX | Northeast | 28 | ZSNB | East | 10 |
| ZGHA | Central and South | 22 | ZUGY | Southwest | 9 |
| ZYHB | Northeast | 22 | ZSNJ | East | 7 |
| ZYTL | Northeast | 18 | ZLLL | Northwest | 7 |
| ZSOF | East | 16 | ZHHH | Central and South | 6 |
| ZHCC | Central and South | 16 | ZSPD | East | 4.5 |
| ZSHC | East | 15 | ZUCK | Southwest | 2 |
| ZLXY | Northwest | 15 | ZGKL | Central and South | 2 |
| ZWWW | Northwest | 13 | ZUUU | Southwest | 1 |
| ZYCC | Northeast | 13 | ZBYN | North | 1 |
| ZSSS | East | 11 | ZBTJ | North | 0.5 |
| ZSQD | East | 10 | — | — | — |
- Note: Identifier represents each airport. Region represents which part in China the airport belongs to. Accumulated duration represents the duration of the ground-icing conditions.
3.3. Impacts on Meteorological Condition in Flight
3.3.1. Potential Aircraft Icing Condition
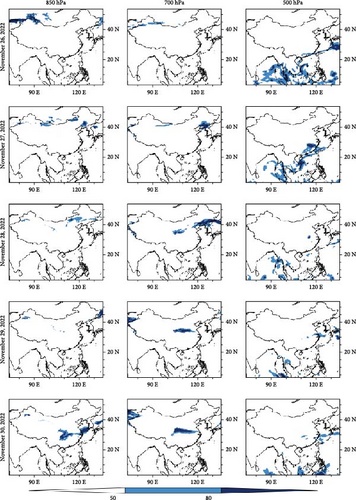
Aircraft icing relates to both temperature and humidity simultaneously. At a high level, the temperature is too low to keep supercooled water droplets. It is more common at lower and middle troposphere for aircrafts to encounter icing because of the temperature and humidity. Figure 8 shows the spatial distribution of the icing index for different levels during the cold-wave event. At 850 hPa, moderate and severe icing regions can be seen over the Balkhash Lake and north of Northwest China on November 26. Then, the icing intensity weakened and moved in an eastward direction toward the east of Northwest China and Northeast China (November 27–28). On November 29, only one small area of moderate icing could be seen in Central China, whereas in the west of Xinjiang Province, the icing conditions persisted. Moderate to severe icing also occurred in the middle and lower reaches of the Yangtze River on November 30. Characteristics of the distribution and evolution of the icing index at 700 hPa were similar to that at 850 hPa. In Northwest China, icing at 700 hPa was weaker than that at 850 hPa because of lower humidity. In Northeast China, Central China, and the middle and lower reaches of the Yangtze River, however, areas of severe icing at 700 hPa were greater than that at 850 hPa. Conditions changed significantly at 500 hPa. On November 26, moderate and severe icing occurred mainly over southern China and the South China Sea. In the following days, the icing region moved in a northerly direction to the middle and lower reaches of the Yangtze River and then dissipated.
3.3.2. Clear Air Turbulence Condition
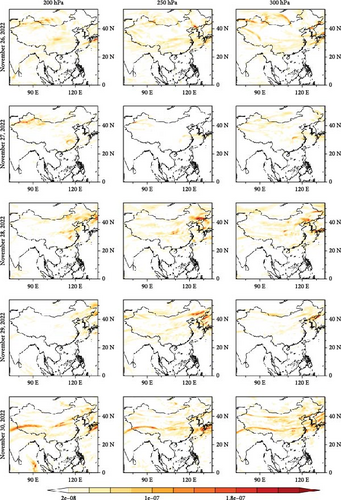
Clear air turbulence is one of the main concerns at a high level, especially when cruising. Figure 9 shows the spatial distribution of the Ellrod turbulence index at three common cruising levels. At 200 hPa, which is equivalent to a flight level of 39,000 ft, a high turbulence index region located over Northwest China began and then shifted to Northeast China and East China. On November 30, at turbulent region presented a zonal distribution across Central China. We note similarities at 250 hPa (a flight level of 34,000 ft) except for a greater turbulence index over Northeast China. The area of turbulence was greater at 300 hPa (a flight level of 30,000 ft) compared with the other two levels. In this cold-wave event, all of the Ellrod turbulence indices were less than 9.07 × 10⁻⁷ s−1, which was the threshold of moderate or greater clear air turbulence [48]. All of the turbulence discussed in this section was classified as light turbulence. It is noted that the Ellrod turbulence index was calculated on daily mean to keep consistent with icing index. The position of the jet stream axis changes rapidly during the cold-wave process, and averaging these rapid fluctuations over a day can smooth out the peaks of turbulence intensity. However, the presence of high-intensity turbulence can also significantly increase the daily average, making the results meaningful.
4. Conclusion and Discussion
In East Asia, cold wave is a vital phenomenon in winter that can affect the daily lives of residents as well as transportation and infrastructure. With continued climate change, cold-wave events are anticipated to become more frequent [13]. The ability to analyze the influence of cold-wave events may allow for better adaptations in the future. In this study, we analyzed a cold-wave event in November 2022 and focused on its impact on civil aviation in China. We used ERA5 hourly data to show the cold-wave process and to calculate icing index and turbulence index. The impacts of wind, visibility, thunderstorm, precipitation, and ground-icing condition were evaluated using METAR data for 36 airports.
This study presents several innovative contributions and highlights its significance in the context of civil aviation operations during cold-wave events: (1) The case selected in this study reveal multiple high-impact weather phenomena. By evaluating the combined effects of wind, visibility, thunderstorms, precipitation, ground icing, and in-flight icing, this study offers a holistic view of the challenges faced by civil aviation during cold waves. This multifaceted analysis provides valuable insights into the interplay between different weather elements and their collective impact on flight safety and airport efficiency. (2) The study introduces novel methods for calculating crosswind components and comparing them with airport limitations. This innovation enhances the understanding of how specific wind conditions affect airport operations, particularly in challenging geographical locations such as coastal regions and narrow valleys. (3) The integration of ERA5 reanalysis data with METAR reports from 36 airports provides a detailed and comprehensive dataset. This approach allows for a more accurate analysis of weather impacts on civil aviation, bridging the gap between large-scale meteorological data and localized airport observations.
Generally, Siberian High pressure was the main system in the cold-wave event, and most of the region that was affected by the cold wave followed a spatial characteristic pattern that shifted from the northwest to the southeast, like the pathway of Siberian High. In the north of southern China, the temperature dropped below 0°C and the climatology of the November mean daily average temperature was 8–12°C in this region. Strong winds were accompanied by the leading edge of the Siberian High, and when it moved to the sea, the winds were further strengthened. The confrontation of cold air and warm air made conditions favorable for precipitation when the water vapor was sufficient.
Not all of these strong winds affected the ground operations in aviation. We calculated a crosswind component and compared it with the limitations at the airports. Most of the airports severely affected by strong crosswinds were located in a coastal region or narrow valley. In the late cold-wave event, six airports along the middle and lower reaches of the Yangtze River, including three inland airports, experienced crosswind restrictions because of decreased crosswind limitations when the runway was wet as a result of rain or other phase states of precipitation. Additionally, this cold-wave event did not have a significant effect on the visibility in civil aviation.
Thunderstorms were recorded at six airports along the middle and lower reaches of the Yangtze River, which may have caused delays, cancelations, and diversions. Most of the airports, including those located in the north of southern China, experienced the transition of the phase state of precipitation that caused ground icing. Ground-icing conditions appeared at 23 airports, and airports in Northeast China and the middle and lower reaches of the Yangtze River were severely affected.
Except for ground-icing conditions, cold-wave events also modified the icing conditions aloft. Northern Xinjiang Province, Northeast China, Central China, and the middle and lower reaches of the Yangtze River were favorable for moderate and severe icing in the lower and middle troposphere. At these levels, aircrafts were climbing or descending, and the icing may have worsened flight performance. At cruising level, light, clear air turbulence could be encountered en route.
In this study, we used METAR data to analyze the impact on airport ground operations. Ten of the airports issued METARs every half hour, and the other 26 airports reported METARs hourly. To avoid the influence of different time intervals, we transformed these frequencies to durations for our analysis. The real duration of the strong crosswinds, thunderstorms, and other phenomena may have had small differences. Data from the Automatic Weather Observing System had a greater time resolution, which should be analyzed in future work. More cases can be considered in the future because different pathways and times of year (early winter, late winter, or early spring) may lead to various impacts. In addition, when a cold wave was forecasted in advance, measures such as stocking up on deicing fluid and other materials to remove snow and ice could be taken. In southern China, however, fewer deicing facilities were available than in northern China. For example, Changsha airport (ZGHA) has 11 deicers, whereas Harbin has 15 aircraft deicers and three runway deicers. These two airports tied for second in those severely affected by ground-icing conditions during this cold-wave event. Understanding how to analyze the different impacts quantitatively is a problem to be solved in our future work.
Conflicts of Interest
The authors declare that there are no conflicts of interest regarding the publication of this paper. The funding sources had no involvement in the study design, data collection, analysis, interpretation of data, writing of the manuscript, or in the decision to submit the manuscript for publication. Therefore, the authors affirm that the funding sources do not present any conflicts of interest.
Author Contributions
Ting Xu contributed to conceptualization; Ting Xu and Jieao Guo contributed to methodology and data analysis; Ting Xu contributed to writing and visualization; and Yan Lu contributed to review and editing. All authors have read and agreed to the published version of the manuscript.
Funding
This research was funded by the National Key R&D Program of China (Grant No. 2021YFB2601701) and the Safety Capacity Building Project of Civil Aviation Administration of China (Grant No. MHAQ2024013).
Acknowledgments
We would like to acknowledge and thank the National Science and Technology Department and the Civil Aviation Administration of China for funding the research projects which lead to this publication.
Appendix A. Information About Runway Number and Instrument Landing System
| Identifier | Name | Elevation (m) | Latitude ( °N) | Longitude ( °E) | Runway number | Highest ILS CAT |
|---|---|---|---|---|---|---|
| ZBAA | Beijing/capital | 35.3 | 40.07 | 116.60 | 01/19, 18L/36R, 18R/36L | IIIa |
| ZBTJ | Tianjin/Binhai | 1.8 | 39.12 | 117.35 | 16L/34R, 16R/34L | II |
| ZBSJ | Shijiazhuang/Zhengding | 71 | 38.28 | 114.70 | 15/33 | I |
| ZBHH | Hohhot/Baita | 1083.9 | 40.85 | 111.82 | 08/26 | I |
| ZBYN | Taiyuan/Wusu | 786.1 | 37.75 | 112.63 | 13/31 | I |
| ZSSS | Shanghai/Hongqiao | 3.0 | 31.20 | 121.34 | 18L/36R, 18R/36L | II |
| ZSPD | Shanghai/Pudong | 3.8 | 31.15 | 121.79 | 16L/34R, 16R/34L | IIIa |
| ZSHC | Hangzhou/Xiaoshan | 6.7 | 30.23 | 120.43 | 06/24, 07/25 | II |
| ZSNJ | Nanjing/Lukou | 14.9 | 31.74 | 118.86 | 06/24, 07/25 | II |
| ZSFZ | Fuzhou/Changle | 14.3 | 25.93 | 119.67 | 03/21 | I |
| ZSAM | Xiamen/Gaoqi | 18.0 | 24.55 | 118.13 | 05/23 | I |
| ZSNB | Ningbo/Lishe | 3.7 | 29.83 | 121.46 | 13/31 | I |
| ZSOF | Hefei/Xinqiao | 63.5 | 31.97 | 116.98 | 15/33 | I |
| ZSQD | Qingdao/Jiaodong | 9.2 | 36.37 | 120.10 | 16/34, 17/35 | II |
| ZGGG | Guangzhou/Baiyun | 15.2 | 23.39 | 113.31 | 01/19, 02L/20R, 02R/20L | II |
| ZGSZ | Shenzhen/Baoan | 4.0 | 22.64 | 113.81 | 15/33, 16/34 | II |
| ZGOW | Jieyang/Chaoshan | 15.6 | 23.55 | 116.50 | 04/22 | I |
| ZJHK | Haikou/Meilan | 22.6 | 19.93 | 110.46 | 09/27, 10/28 | I |
| ZJSY | Sanya/Phoenix | 28.5 | 18.30 | 109.40 | 08/26 | I |
| ZGNN | Nanning/Wuxu | 128.1 | 22.61 | 108.17 | 05/23 | I |
| ZGKL | Guilin/Liangjiang | 173.6 | 25.22 | 110.04 | 01/19 | I |
| ZHHH | Wuhan/Tianhe | 34.5 | 30.80 | 114.21 | 41L/22R, 04R/22L | II |
| ZHCC | Zhengzhou/Xinzheng | 151.2 | 34.52 | 113.84 | 12L/30R, 12R/30L | II |
| ZGHA | Changsha/Huanghua | 66.9 | 28.19 | 113.22 | 18L/36R, 18R/36L | II |
| ZUUU | Chengdu/Shuangliu | 512.4 | 30.58 | 103.95 | 02L/20R, 02R/20L | II |
| ZUCK | Chongqing/Jiangbei | 415.6 | 29.72 | 106.64 | 02L/20R, 02R/20L, 12/21 | II |
| ZPPP | Kunming/Changshui | 2103.5 | 25.11 | 102.94 | 03/21, 04/22 | II |
| ZUGY | Guiyang/Longdongbao | 1138.9 | 26.54 | 106.80 | 01L/19R, 01R/19L | II |
| ZLXY | Xi’an/Xianyang | 479.1 | 34.45 | 108.75 | 05L/23R, 05R/23L | II |
| ZLLL | Lanzhou/Zhongchuan | 1947.2 | 36.52 | 103.62 | 18/36 | I |
| ZYTX | Shenyang/Taoxian | 60.5 | 41.64 | 123.49 | 06/24 | I |
| ZYTL | Dalian/Zhoushuizi | 32.6 | 38.97 | 121.54 | 10/28 | I |
| ZYHB | Harbin/Taiping | 139.3 | 45.63 | 126.25 | 05/23 | I |
| ZYCC | Changchun/Longjia | 215.3 | 44.00 | 125.69 | 06/24 | I |
| ZWWW | Urumqi/Diwopu | 647.9 | 43.91 | 87.48 | 07/25 | IIIa |
| ZWSH | Kashi/Kashi | 1380.0 | 39.55 | 76.02 | 08/26 | I |
- Note: From left to right: ICAO identifier, city and name of airport, elevation, latitude, longitude, runway number, and the highest instrument landing system (ILS) category (CAT) in operation.
Open Research
Data Availability Statement
Publicly archived datasets were analyzed in this study. The data can be found here: The ERA5 data are available online via https://www.ecmwf.int/en/forecasts/dataset/ecmwf-reanalysis-v5 (accessed on March 2, 2023). METARs are available from http://www.weather.uwyo.edu/surface/meteorogram/seasia.shtml (accessed on March 19, 2023).


