ML-Based Screening of miRNA Inhibitors and Intervention of lncRNA/miRNA/mRNA Axis in Oncogenic KRAS-Associated Colorectal Cancer
Abstract
Mutant KRAS promotes proliferation and tumorigenesis in several cancers such as colorectal cancer (CRC), pancreatic ductal adenocarcinoma (PDAC), and non–small cell lung cancer (NSCLC). The long noncoding RNAs (lncRNAs) regulate the microRNAs (miRNAs) that further result in the dysregulation of messenger RNAs (mRNAs) in various mutant KRAS-associated cancers. Although the role and function of the lncRNA axis are not clearly understood, various studies have recently focussed on the evaluation of the lncRNA axis role in various cancers. The lncRNAs CRNDE and SNHG7 are highly expressed in KRAS-associated colon adenocarcinoma (COAD), a major subtype of CRC, and further regulate the miRNA expression and thus indirectly regulate mRNA expression levels. In the present study, we have utilized various bioinformatics approaches such as differential gene expression (DEG) analysis, survival analysis, immunohistochemistry (IHC) analysis, prediction of RNA–RNA interaction, miRNA and mRNA stability prediction, and binding energy evaluation. Alongside, machine learning (ML)–based screening was also performed to identify potential miRNA inhibitors from natural source using RDKit. From our study, we have observed that CRNDE sponges hsa-miR-181a-5p and downregulates their expression, and the hsa-miR-181a-5p further regulates the expression of CTNNB1 and TCF4 in COAD. Also, in the lncRNA SNHG7 axis, it regulates the hsa-miR-216b-5p expression, and further, the GALNT1 was downregulated by the binding of hsa-miR-216b-5p. Additionally, ML-based screening revealed some potential inhibitors particularly based on anthraquinone, quinazoline, and sulfonamide scaffolds against hsa-miR-216b-5p and hsa-miR-216b-5p. Thus, we conclude that the lncRNA/miRNA/mRNA axis of CRNDE/hsa-miR-181a-5p/(CTNNB1/TCF4) and SNHG7/hsa-miR-216b-5p/GALNT1 axes as the significant therapeutic target in the mutant KRAS-associated CRC, and natural compounds have to be studied more in detail and to be developed as miRNA inhibitors. However, our predictions were supported by the evidence of the interaction and regulation of the lncRNA/miRNA/mRNA axis through bioinformatics approaches and ML-based miRNA inhibitor screening; it has to be studied further in in vitro and in vivo settings in the near future.
1. Introduction
Mutant KRAS promotes cell proliferation and metastasis in various cancers such as colorectal cancer (CRC), pancreatic ductal adenocarcinoma (PDAC), and non–small cell lung cancer (NSCLC) [1–3]. Apart from these cancers, KRAS mutations also involve in the progression (but comparatively very low) of invasive ductal carcinoma (IDC), stomach adenocarcinoma (STAD), undifferentiated endometrial carcinoma (UEC), and esophageal adenocarcinoma (EAC)/gastroesophageal junction cancer (GEJC), respectively [4–6]. Generally, the mutant KRAS overcomes the GTPase activity (guanosine triphosphate [GTP] hydrolysis) and maintains the GTP-bound active state and thus promotes tumor progression via downstream effector signaling pathways such as mitogen-activated protein kinase (MAPK) and phosphoinositide 3-kinase–mammalian target of rapamycin (PI3K–mTOR) pathways [7]. Mutated KRAS triggers downstream effector signaling pathways, overcomes inhibitory mechanism by signaling cross-talks, overcomes intrinsic and extrinsic apoptotic pathways, promotes drug resistance, and promotes the tumor microenvironment in solid cancers [3]. Comparatively, the 12th position of the KRAS protein is the highly frequent mutational hotspot with nearly 85%, and G12D and G12C missense point mutations are the most frequent mutations with 42% and 23%, respectively [8]. The current therapeutic strategies against KRAS-mutated cancers include the inhibitors of upstream and downstream effectors, inhibitors of KRAS regulator interaction, direct inhibitors of KRAS (both on and off state), and inhibitors of cell cycle regulators [6, 9]. Till now, there are only two KRAS G12C mutant-specific inhibitors, namely, sotorasib and adagrasib, which are approved by the Food and Drug Administration (FDA) for the treatment of KRAS G12C mutated NSCLC and other solid tumors [10, 11]. Unfortunately, recent studies reported the clinical resistance of these inhibitors among KRAS G12C mutated cancer patients [3]. Alongside, other therapeutics such as small molecule inhibitors, small interfering RNA (siRNA) candidates, vaccine construct, proteolysis-targeting chimeras (PROTACs), and antibody–drug conjugates (ADCs), and immunotherapies such as chimeric antigen T-cell receptor therapy (CAR-T cell therapy) and tumor-infiltrating lymphocytes (TILs) are being developed and studied against the KRAS-mutated cancers. Still, the quest for novel therapeutics and development of therapeutic strategies against the KRAS-mutated cancers are in progress [2, 12–14].
The long noncoding RNAs (lncRNAs) act as competing endogenous RNAs (ceRNAs) and sponge the microRNAs (miRNAs) and thus indirectly regulate the messenger RNA (mRNA) targets of those miRNAs involved in cancers and other diseases [15, 16]. Although the role and function of the lncRNA axis are not yet fully studied, recent studies are focused on the evaluation of cancer-related lncRNA axis as therapeutic targets [15, 17]. lncRNAs have the potential to regulate the expression of genes at transcription levels and even epigenetic levels [17]. Recent studies report the dysregulation of oncogenic KRAS by the altered expression of miRNAs as a crucial driver in cancer progression [17, 18]. The colorectal neoplasia differentially expressed (CRNDE) is a lncRNA located at chromosome 16:5,49,52,774-5,49,63,101 which have been reported to be upregulated in various cancers including the major CRC subtype colon adenocarcinoma (COAD), glioblastoma multiforme (GBM), lung adenocarcinoma (LUAD), renal cell carcinoma (RCC), gastric cancer (GC), and breast cancer (BC) [19–24]. Studies reported that the lncRNA CRNDE is upregulated in KRAS-mutated cancers by dysregulation of mutant KRAS, and still the complete function of CRNDE in KRAS-mutated cancers is not clearly understood [25–27]. Likewise, the small nucleolar RNA host gene 7 (SNHG7) was identified as lncRNA located at chromosome 9:13,67,24,594-13,67,28,184 which have been reported to be upregulated in various cancers including CRC, GBM, LUAD, and prostate cancer, respectively [28–31]. SNHG7 was reported to promote cellular proliferation and metastasis of KRAS-mutated cancers, and still, the complete function of SNHG7 in KRAS-mutated cancer is not clearly understood [32, 33]. Both lncRNA CRNDE and lncRNA SNHG7 are upregulated in COAD and dysregulate the expression of oncogenic KRAS via miRNA sponging and thus alter the mRNA expression at transcriptional levels [34].
The lncRNA CRNDE was reported to sponge the hsa-miR-181a-5p in various cellular functions such as inflammation and apoptosis and diseases such as sepsis and even CRC [35, 36]. Similarly, the lncRNA SNHG7 was reported to sponge the hsa-miR-216b-5p in various cancers including CRC and regulate the target gene expression at transcriptional levels [37, 38]. The hsa-miR-181a-5p was reported to regulate the Wnt signaling pathway and modulate the expression of β-catenin/catenin beta-1 (CTNNB1) and transcription factor 4 (TCF4) and regulates the proliferation and growth of acute lymphoblastic leukemia and BC [39, 40]. The hsa-miR-216b-5p was reported to regulate the expression of polypeptide N-acetylgalactosaminyltransferase 1 (GALNT1) in hepatocellular carcinoma (HCC) and ovarian cancer (OC) [41, 42]. However, it is limited by their observation by their molecular interaction patterns, differential gene expression (DEG), and protein expression patterns. miRNA dysregulation promotes cellular proliferation, metastasis, and differentiation of various cancers such as CRC, PDAC, NSCLC, and BC [43]. The miRNA stability determines the target mRNA degradation efficacy, and its stability is mainly governed by seed sequence interaction of miRNA (2–7 nts in 5′→3′ direction), GC%, and thermodynamic stability (melting temperature), respectively [44, 45]. Targeting the miRNAs over the lncRNAs is thea highly preferred strategy in anticancer drug discovery due to their target specificity and high efficacy. Inhibition of these miRNAs could reverse these effects, and therapeutics such as small molecule inhibitors, antisense oligonucleotides (ASOs) including anti-miRNA oligonucleotide (AMOS), and locked nuclear acid (LNA)-AMOS were the preferred strategies for miRNA inhibition [46]. However, ASO therapeutics are limited by poor permeability in clinics, and thus, small molecule inhibitors attract more attention in the present scenario [47, 48]. Additionally, several studies indicated the significance and exploration of miRNA inhibitors from natural source acquired more attention due to their low toxic effects like the conventional chemotherapeutic drugs that are associated with drug resistance in several cancers [49–51].
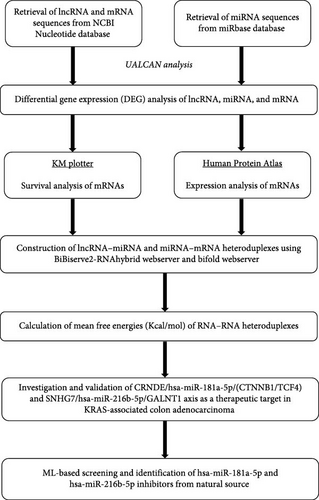
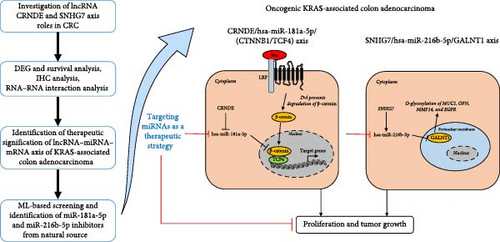
Thus, from the above understandings, we planned to evaluate these lncRNA/miRNA/mRNA axes which are less explored in mutant KRAS-associated CRC. From the above observations, we designed this work to evaluate the interactions of the lncRNA/miRNA/mRNA axis of CRNDE/hsa-miR-181a-5p/(CTNNB1/CF4) and SNHG7/hsa-miR-216 b-5p/GALNT1 in the COAD progression through bioinformatics approaches such as DEG analysis, survival analysis, immunohistochemistry (IHC) analysis from Human Protein Atlas (HPA), prediction of RNA–RNA interaction, and their binding energies. Additionally, we have also identified potential miRNA inhibitors from natural source by machine learning (ML)–based screening using RDKit open-source tool. The complete workflow of the study design was provided in Figure 1.
2. Materials and Methods
2.1. Retrieval of lncRNA, miRNA, and mRNA Sequences
The human lncRNA CRNDE gene coordinates can be found at chromosome 16:5,49,52,774-5,49,63,101, and the human lncRNA SNHG7 gene coordinates can be found at chromosome 9:13,67,24,594-13,67,28,184. The full-length nucleotide sequences of the lncRNA CRNDE (Accession ID: NC_000016.10; region: 54952774..54963101) (https://www.ncbi.nlm.nih.gov/nuccore/NC_000016.10) and the full-length nucleotide sequences of the lncRNA CRNDE SNHG7 (Accession ID: NC_000009.12; region: 136724594..136728184) (https://www.ncbi.nlm.nih.gov/nuccore/NC_000009.12) were retrieved from the National Center for Biotechnology Information (NCBI) Nucleotide database, respectively [52]. Similarly, the nucleotide sequences of CTNNB1 (Accession ID: NM_001904.4) (https://www.ncbi.nlm.nih.gov/nuccore/NM_001904.4), TCF4 (Accession ID: NM_001083962.2) (https://www.ncbi.nlm.nih.gov/nuccore/NM_001083962.2), and GALNT1 (Accession ID: NM_020474.4) (https://www.ncbi.nlm.nih.gov/nuccore/NM_020474.4) were also retrieved [52]. The mature sequences of hsa-miR-181a-5p (miRbase ID: MIMAT0000256) (5′-AACAUUCAACGCUGUCGGUGAGU-3′) and hsa-miR-216b-5p (miRbase ID: MIMAT0004959) (5′-AAAUCUCUGCAGGCAAAUGUGA-3′) were retrieved from miRbase database, respectively (https://mirbase.org/) [53, 54].
2.2. Differential Expression Analysis of lncRNAs and miRNAs in CRC
The RNA sequencing (RNA-Seq) quantification data from the whole transcriptome profile of the Cancer Genome Atlas Colon Adenocarcinoma (TCGA-COAD) dataset were retrieved from the Genomic Data Commons portal (https://portal.gdc.cancer.gov/). Then the differential expression of the lncRNAs CRNDE and SNHG7 and miRNAs hsa-miR-181a-5p and hsa-miR-216b-5p from the TCGA-COAD datasets were analyzed using the UALCAN data analysis portal tool (https://ualcan.path.uab.edu/analysis.html) [55, 56]. The differential expression between the normal and tumor groups of the lncRNAs and miRNAs was considered statistically significant (p < 0.05).
2.3. Differential Expression and Survival Analysis of mRNAs in CRC
The RNA-Seq quantification data from the whole transcriptome profile of the TCGA-COAD dataset were retrieved from the Genomic Data Commons portal. Then the differential expression of the mRNAs CTNNB1, TCF4, and GALNT1 from the TCGA-COAD datasets was analyzed using the UALCAN data analysis portal tool (https://ualcan.path.uab.edu/analysis.html) [55, 56]. The differential expression between the normal and tumor groups of the mRNAs was considered statistically significant (p < 0.05). Then the survival analysis of the mRNAs CTNNB1, TCF4, and GALNT1 from the TCGA-COAD datasets was predicted using the Kaplan–Meier (KM) plotter webserver (https://kmplot.com/analysis/) [57]. The KM plots were generated for the mRNAs with a median cutoff range and with a 95% confidence interval. In addition, the protein expression patterns of the mRNAs between the normal and COAD were retrieved from the HPAs database (https://www.proteinatlas.org/) [58].
2.4. Construction of lncRNA–miRNA and miRNA–mRNA Heteroduplexes
The interaction between the lncRNA–miRNA and miRNA–mRNA heteroduplexes was predicted by using the BiBiserve2-RNAhybrid webserver (https://bibiserv.cebitec.uni-bielefeld.de/rnahybrid) [59, 60]. Parameters such as 10 hits per target and the approximate p-value were set to 3′ untranslated region (3′ UTR) of human were included, and other parameters were set default. Then the duplexes were constructed using the bifold webserver (https://rna.urmc.rochester.edu/RNAstructureWeb/Servers/bifold/bifold.html) [61, 62]. In the bifold server, at 310.15 K temperature, the maximum percent energy difference was set at 5 with a maximum loop size of 30 as parameters to ensure proper folding. The RNA–RNA hybrids of lncRNA–miRNA and miRNA–mRNA heteroduplexes were predicted with sequence complementarity and scored in mean free energy (mfe) (Kcal/mol) of the hybrids [60]. Also, the parameters such as GC%, seed sequence region, sequence length, molecular weight, and thermodynamic stability of the mRNAs and miRNAs were predicted using OligoCalc and miRPathDB 2.0 webservers to ensure their stability [63, 64].
2.5. ML-Based Screening and Identification of Potential miRNA Inhibitors
The hsa-miR-181a-5p and hsa-miR-216b-5p of both lncRNA/miRNA/mRNA axes were reported to have dysregulated expression and promote cancer progression in SW480 COAD cells [65–67]. Herein, we utilized a dataset of natural compounds that have been previously reported for their cytotoxicity potential in SW480 COAD cells from the Natural Product Activity and Species Source (NPASS) database (https://bidd.group/NPASS/) [68]. The standard inhibitors of these miRNAs were predicted using the RNA-Targeted BIoactive ligaNd (R-BIND) database (https://rbind.chem.duke.edu/index.html#home) [69]. Simultaneously, an ML algorithm in Python from RDKit open source tool was utilized to identify potential miRNA inhibitors from the given dataset (https://www.rdkit.org/docs/GettingStartedInPython.html). The algorithm performs the similarity search based on the compound’s structure in the dataset with the known compound and provides a Tanimoto similarity, which can be subsequently employed for the clustering of these compounds into respective groups.
3. Results
3.1. CRNDE Is Upregulated and hsa-miR-181a-5p Is Downregulated in CRC
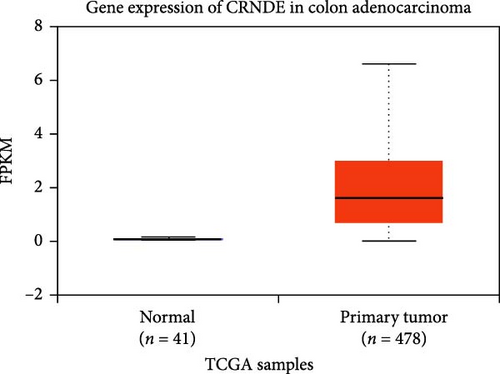
The DEG of lncRNA CRNDE and hsa-miR-181a-5p from the TCGA-COAD dataset were predicted with the UALCAN analysis tool. The DEG analysis showed that the CRNDE is upregulated in the tumor group (n = 478) than the normal group (n = 41), with a statistical significance of p = 2.3E−85 as shown in Figure 2. It also showed that the hsa-miR-181a-5p is downregulated in the tumor group (n = 251) than the normal group (n = 7), with a statistical significance of p = 4.9E−04 as shown in Figure 2. The differential expression of lncRNA CRNDE is observed to be upregulated, and hsa-miR-181a-5p is observed to be downregulated in the COAD group than the normal group.

3.2. CTNNB1 Is Upregulated and TCF4 Is Downregulated in CRC
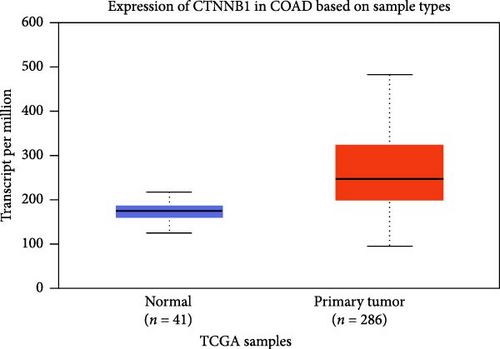
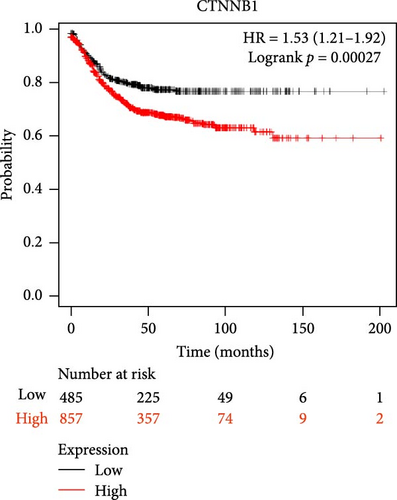
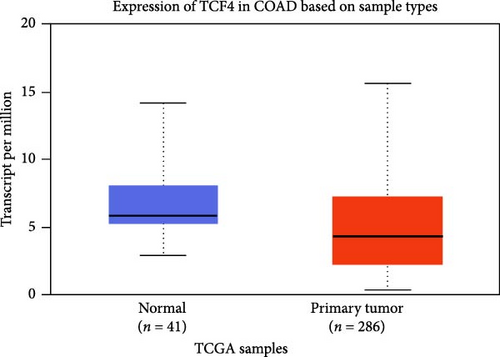
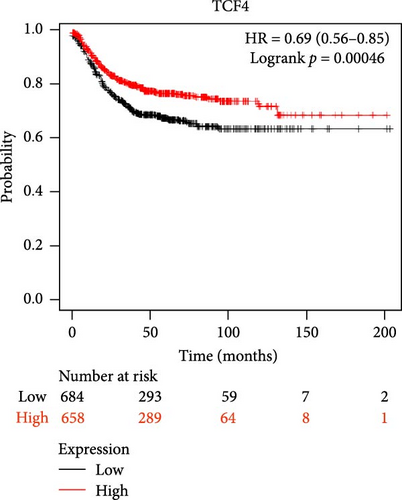
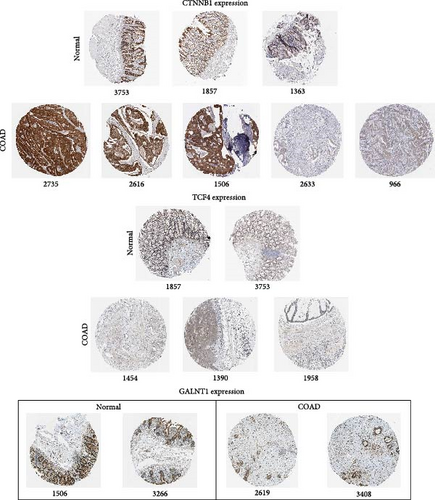
The DEG of CTNNB1 and TCF4 from the TCGA-COAD dataset was predicted with the UALCAN analysis tool. The DEG analysis showed that the CTNNB1 is upregulated in the tumor group (n = 286) than the normal group (n = 41) with a statistical significance of p = 1E−12, and TCF4 was observed to be downregulated in the tumor group (n = 286) than the normal group (n = 41) with a statistical significance of p = 4.9E−02, respectively, as shown in Figure 3. The KM survival analysis plots were predicted for CTNNB1 and TCF4 along with their hazard ratio (HR). The survival analysis showed that the lower expression group of CTNNB1 has a higher survival chance with an HR value of 1.53 (HR >1) and p-value of 0.00027 (p < 0.05), and the higher expression of TCF4 has a high survival chance with a HR value of 0.69 (HR <1) and p-value of 0.00046 (p < 0.05) as shown in the Figure 3. Additionally, the IHC data from the HPA indicates that the CTNNB1 is upregulated in COAD tissues than the normal colon tissues, and TCF4 is downregulated in COAD tissues than the normal colon tissues as shown in Figure 4. Also, the patient characteristics of the tissue samples corresponding to CTNNB1 and TCF4 used for this study were shown in Tables 1 and 2, respectively. Thus, it is clearly evident that the CTNNB1 is upregulated and the TCF4 is downregulated in the COAD group than the normal group.
| Patient ID | Sex | Age | Type | Staining | Intensity | Quantity (%) | Source |
|---|---|---|---|---|---|---|---|
| CTNNB1 | |||||||
| 3753 | Female | 63 | Normal | Medium | Moderate | >75 | https://www.proteinatlas.org/ENSG00000168036-CTNNB1/tissue/colon# |
| 1857 | Male | 47 | Normal | Medium | Moderate | >75 | |
| 1363 | Male | 76 | Normal | Low | Weak | >75 | |
| 2735 | Male | 87 | Colon adenocarcinoma | High | Strong | >75 | https://www.proteinatlas.org/ENSG00000168036-CTNNB1/pathology/colorectal+cancer# |
| 2616 | Female | 67 | Colon adenocarcinoma | High | Strong | >75 | |
| 1506 | Female | 55 | Colon adenocarcinoma | High | Strong | >75 | |
| 2633 | Male | 55 | Colon adenocarcinoma | Medium | Moderate | 25–75 | |
| 966 | Male | 54 | Colon adenocarcinoma | Low | Weak | 25%–75 | |
| TCF4 | |||||||
| 1857 | Male | 47 | Normal | Medium | Moderate | >75 | https://www.proteinatlas.org/ENSG00000196628-TCF4/tissue/colon#imid_6547254 |
| 3753 | Female | 62 | Normal | Low | Weak | >75 | |
| 1454 | Female | 46 | Colon adenocarcinoma | Not detected | Weak | <25 | https://www.proteinatlas.org/ENSG00000196628-TCF4/pathology/colorectal+cancer#imid_6537638 |
| 1390 | Female | 53 | Colon adenocarcinoma | Medium | Moderate | >75 | |
| 1958 | Female | 84 | Colon adenocarcinoma | Low | Weak | >75 | |
- Abbreviations: COAD, colon adenocarcinoma; CTNNB1, β-catenin/catenin beta-1; HPA, Human Protein Atlas; IHC, immunohistochemistry; TCF4, transcription factor 4.
| Patient ID | Sex | Age | Type | Staining | Intensity | Quantity (%) | Source |
|---|---|---|---|---|---|---|---|
| 1506 | Female | 55 | Normal | Medium | Moderate | >75 | https://www.proteinatlas.org/ENSG00000141429-GALNT1/tissue/colon#imid_3357774 |
| 3266 | Male | 73 | Normal | Medium | Moderate | >75 | |
| 2619 | Female | 57 | Colon adenocarcinoma | Medium | Moderate | >75 | https://www.proteinatlas.org/ENSG00000141429-GALNT1/pathology/colorectal+cancer#imid_3358149 |
| 3408 | Male | 63 | Colon adenocarcinoma | Medium | Moderate | >75 | |
- Abbreviations: COAD, colon adenocarcinoma; GALNT1, polypeptide N-acetylgalactosaminyltransferase 1; HPA, Human Protein Atlas; IHC, immunohistochemistry.
3.3. SNHG7 and hsa-miR-216b-5p Are Upregulated in CRC
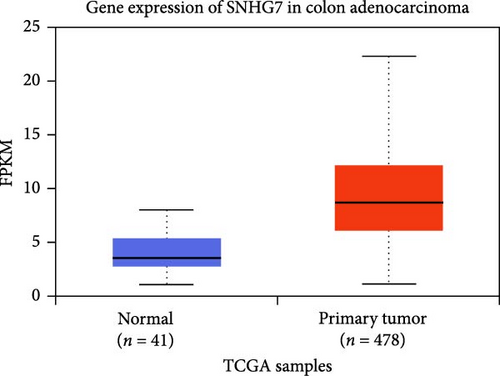
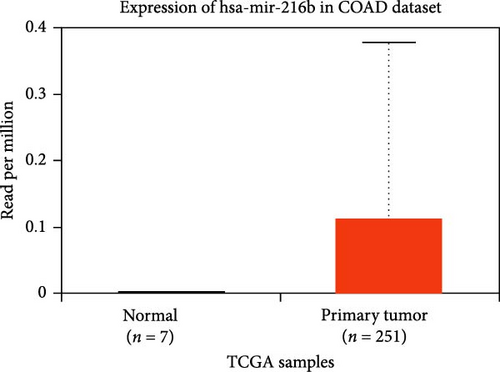
The DEG of lncRNA SNHG7 and hsa-miR-216b-5p from the TCGA-COAD dataset was predicted with the UALCAN analysis tool. The DEG analysis showed that the CRNDE is upregulated in the tumor group (n = 478) than the normal group (n = 41), with a statistical significance of p = 1.06E−38, and also the hsa-miR-216b-5p is observed to be upregulated in the tumor group (n = 251) than the normal group (n = 7) as shown in Figure 5. The differential expression of the lncRNA SNHG7 and hsa-miR-216b-5p is observed to be upregulated in the COAD group than in the normal group.
3.4. GALNT1 Is Downregulated in CRC
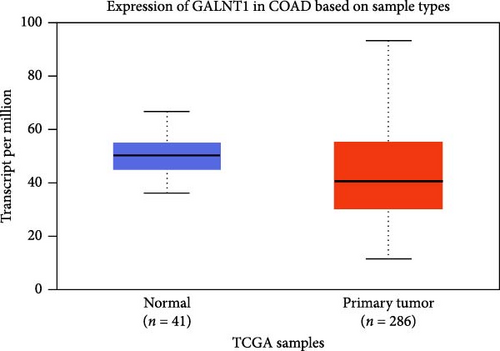
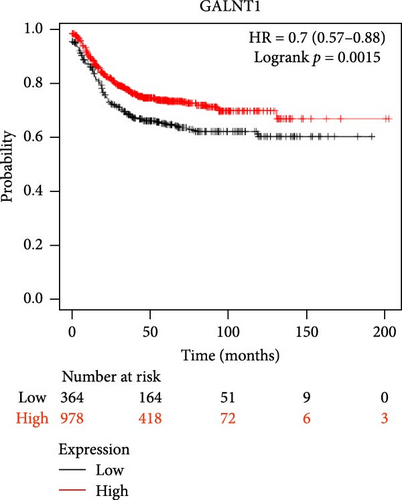
The DEG analysis of GALNT1 from the TCGA-COAD dataset showed that the GALNT1 is downregulated in the tumor group (n = 286) than the normal group (n = 41) with a statistical significance of p = 1.3E−03 as shown in Figure 6. The survival analysis plots were predicted for CTNNB1 and TCF4 along with their HR. The survival analysis showed that the higher expression of GALNT1 has a high survival chance with an HR value of 0.7 (HR <1) and p-value of 0.0015 (p < 0.05) as shown in Figure 6. Also, the IHC data from the HPA indicate that the GALNT1 is downregulated in COAD tissues than the normal colon tissues as shown in Figure 4. In addition, the patient characteristics of the tissue samples corresponding to GALNT1 expression used for this study are shown in Table 3. Thus, it is clearly evident that the GALNT1 is downregulated in the COAD group than in the normal group.
| CRNDE–hsa-mir-181a-5p | CTNNB1–hsa-mir-181a-5p | TCF4–hsa-mir-181a-5p | SNHG7–hsa-mir-216b-5p | GALNT1–hsa-mir-216b-5p |
|---|---|---|---|---|
| −25.3 | −26.3 | −26.6 | −23.7 | −26.9 |
| −24.5 | −25 | −24.9 | −22.6 | −22.3 |
| −24.4 | −25.8 | −24.9 | −22.2 | −20.7 |
| −23.9 | −23.6 | −23.3 | −22.1 | −20.7 |
| −23.1 | −23.4 | −23.2 | −21.9 | −20.5 |
- Abbreviations: CRNDE, colorectal neoplasia differentially expressed; CTNNB1, β-catenin/catenin beta-1; GALNT1, polypeptide N-acetylgalactosaminyltransferase 1; lncRNA, long noncoding RNA; miRNA, microRNA; mRNA, messenger RNA; SNHG7, small nucleolar RNA host gene 7; TCF4, transcription factor 4.
3.5. hsa-miR-181a-5p Targets CTNNB1 and TCF4 and hsa-miR-216b-5p Targets GALNT1
The RNA–RNA interactions of the miRNA–mRNA were predicted using the BiBiserve2-RNAhybrid webserver. 3′UTR human was selected as the approximate p-value filter, and their mfes were calculated, and then these hybrids were visualized using the bifold webserver. The mfes of the top best hybrids of the lncRNA–miRNA heteroduplexes of hsa-miR-181a-5p–CTNNB1, hsa-miR-181a-5p–TCF4, and hsa-miR-216b-5p–GALNT1 were predicted to be −26.3 Kcal/mol, −26.6 Kcal/mol, and −26.9 Kcal/mol, respectively, as shown in Figure 7. Additionally, the mfes of the top 5 best hybrids were provided in Table 3. The results indicate that these miRNAs could potentially bind to the 3′UTR of the mRNA target and promote tumorigenesis in KRAS-associated COAD.
3.6. CRNDE Acts as an hsa-miR-181a-5p Sponge and SNHG7 Acts as an hsa-miR-216b-5p Sponge
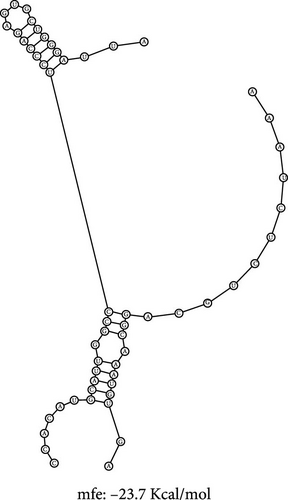
The RNA–RNA interactions of the miRNA–lncRNA were predicted using the BiBiserve2-RNAhybrid webserver, and the hybrids were visualized using the bifold webserver. The mfes of the top best hybrids of the miRNA–mRNA heteroduplexes of CRNDE–hsa-miR-181a-5p and SNHG7–hsa-miR-216b-5p were predicted to be −25.3 Kcal/mol and −23.7 Kcal/mol, respectively, as shown in Figure 7. Additionally, the mfes of the top 5 best hybrids were provided in Table 3. The binding interactions of the miRNA–lncRNA heteroduplexes indicates the lncRNA CRNDE acts as hsa-miR-181a-5p sponge and the lncRNA SNHG7 acts as hsa-miR-216b-5p sponge in KRAS-associated COAD. In addition, the GC%, thermodynamic stability in terms of melting temperature, sequence length, molecular weight, and seed sequence of the miRNA and mRNA were predicted and tabulated in Table 4. These results indicate that the miRNA seed sequence of hsa-miR-181a-5p and hsa-miR-216b-5p has perfect complementary to the target mRNAs as shown in Figure 6, and the high melting temperature (TM) indicates the thermodynamic stability of the miRNA which ensures its high stability and efficacy toward the target mRNAs, respectively.
| Parameters | hsa-mir-181a-5p | hsa-mir-216b-5p | CTNNB1 | TCF4 | GALNT1 |
|---|---|---|---|---|---|
| GC% | 48 | 41 | 74 | 95 | 38 |
| Seed sequence (2–7 nts in 5′→3′ direction) | ACAUUCA | AAUCUCU | — | — | — |
| Sequence length | 23 | 22 | 27 | 22 | 26 |
| Molecular weight (g/mol) | 7568.4 | 7270.3 | 8915.2 | 7537.5 | 8603.1 |
| Thermodynamic stability by melting temperature TM (°C) | 55.3 | 51.1 | 70.4 | 73.5 | 54.8 |
- Abbreviations: CTNNB1, β-catenin/catenin beta-1; GALNT1, polypeptide N-acetylgalactosaminyltransferase 1; miRNAs, microRNAs; mRNA, messenger RNA; TCF4, transcription factor 4.
3.7. ML Algorithm Identified Potential miRNA Inhibitors
The R-BIND database was employed to predict the known miRNA inhibitors, which showed one compound for miR-181a-5p and three compounds for miR-216b-5p, respectively, as shown in Figure 8. These compounds were used as reference, and the potential miR-181a-5p and miR-216b-5p inhibitors from the natural source were predicted by an ML-based algorithm and Tanimoto similarity using RDkit. The ML models were trained by support vector machine (SVM) classification, linear regression, and custom ranking algorithms and hyperparameter tuning, validated by both classification metrics (accuracy and precision) and regression metrics root mean squared error and R2) followed by Spearman’s rank correlation. Finally, the performance was assessed by the Tanimoto similarity, respectively. The dataset included the compounds that have been previously reported to have significant cytotoxicity potential in the SW480 CRC cells as shown in Table S1. The reference compounds and identified (top 2) potential inhibitors were shown in Figure 8. The top 15 similar compounds of each reference compound were provided in Figures S1, S2, S3, and S4, respectively. Also, the algorithm used in the compound’s screening was provided in Figure S5. From the observations, we found that the top potential inhibitors of both miR-181a-5p and miR-216b-5p belong to anthraquinone, quinazoline, and sulfonamide family of compounds. These scaffolds and their compounds were previously reported for their potential anticancer properties against various cancers including PDAC, CRC, and NSCLC, respectively. These predicted compounds could be explored more to develop natural miRNA inhibitors with enhanced bioavailability and efficacy toward various cancers in the near future.



4. Discussion
The mutation in the KRAS protein retains its GTP-bound active state (on state) and promotes cell proliferation and progression of various cancers such as CRC, PDAC, LUAD, and BC [1, 7]. The KRAS G12D and G12C are the most frequent mutations, and recently, FDA approved two KRAS G12C mutant-specific inhibitors, namely, sotorasib and adagrasib, which are also reported to have clinical resistance among patients [3, 10, 11]. Alongside, other therapeutics such as small molecule inhibitors, siRNA candidates, vaccine construct, PROTACs, and ADCs are being developed and studied against the KRAS-mutated cancers. Still, the quest for novel therapeutics against the KRAS-mutated cancers is in progress [2, 12, 70]. The lncRNAs play a crucial role in the gene expression of mRNA targets via miRNA regulation by sponging them in various cancers including CRC, PDAC, and BC, respectively [17, 71–74]. The lncRNAs CRNDE and SNHG7 are reported to be upregulated and regulate miRNA functions in several cancers including CRC and regulates the expression of oncogenic KRAS [18]. In the present study, we have evaluated the lncRNA/miRNA/mRNA axis of CRNDE/hsa-miR-181a-5p/(CTNNB1/TCF4) and SNHG7/hsa-miR-216b-5p/GALNT1 in the COAD (a major CRC subtype) progression through bioinformatics approaches such as DEG analysis, survival analysis, IHC analysis, and prediction of RNA–RNA interaction and their binding energies and also employed ML algorithm to identify potential miRNA inhibitors.
Initially, nucleotide sequences of the lncRNAs CRNDE and SNHG7, miRNAs hsa-miR-181a-5p and hsa-miR-216b-5p, and the mRNA sequences of CTNNB1, TCF4, and GALNT1 were retrieved from the respective databases [60]. Then their RNA-Seq quantification data from the whole transcriptome profile of the TCGA-COAD dataset were retrieved from the Genomic Data Commons portal, and the DEG analysis of the lncRNAs, miRNAs, and mRNAs in the COAD was evaluated using the UALCAN tool [55]. The lncRNA CRNDE was reported to be upregulated in the KRAS-associated COAD and modulate the expression of mRNA targets via miRNA sponging [25, 75]. Also, the hsa-miR-181a-5p was reported to be differentially expressed in COAD and could regulate the Wnt pathway by targeting CTNNB1 and TCF4 [67, 76]. Our DEG analysis revealed that the CRNDE is upregulated, hsa-miR-181a-5p is downregulated in CRC, CTNNB1 is upregulated, and TCF4 is downregulated in COAD as shown in Figures 2 and 3. In the Wnt-mediated signaling pathway, the disheveled (Dvl) in the cytoplasm prevents the degradation of CTNNB1 from the destruction complex, and then the cytoplasmic CTNNB1 gets elevated at high concentrations and then further localizes into the nucleus and forms complexes with TCF [77, 78]. From our data, we could correlate that the higher concentration of the cytoplasmic CTNNB1 could be the reason for their upregulation in the CRC group as shown in Figure 3. Also, the survival analysis by KM plot with HR showed the survival chance of the patients with respect to the mRNA expression as shown in Figure 3. In addition, the IHC analysis from HPA supports the differential expression of CTNNB1 and TCF4 in the COAD group than the normal group as shown in Figure 4.
The lncRNA SNHG7 was reported to regulate the GALNT levels and modulate the PI3K–mTOR pathway in CRC [29]. Also, the hsa-miR-216b-5p was reported to regulate the expression of GALNT1 HCC and OC [42]. Our DEG analysis predicted that the SNHG7 and hsa-miR-216b-5p are upregulated in COAD, while the GALNT1 was observed to be downregulated in COAD than the normal group as shown in Figures 5 and 6, respectively. SNHG7 has been reported to regulate the expression of GALNT1 levels and mediates the proliferation and growth of cancer cells [41]. In another study, the lncRNA SNHG1 (another type of SNHG7) was reported to have a correlation with the miR-216b-5p and regulates the prognosis and chemoresistance epithelial OC (EOC) cells [42]. From our data, we could correlate that the lncRNA SNHG7 downregulates the expression on GALNT1 via upregulating the miR-216b-5p in the COAD group than the normal group as shown in Figures 5 and 6. Also, the survival analysis by KM plot with HR showed the survival chance of the patients with respect to the GALNT1 expression as shown in Figure 5. In addition, the IHC analysis showed a lower expression of GALNT1 in the COAD group than in the normal group as shown in Figure 6.
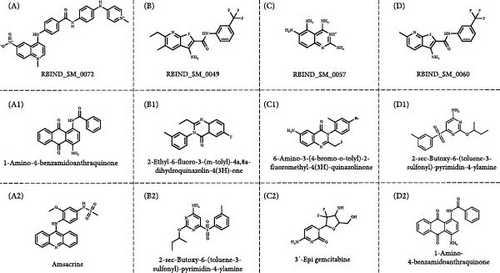
The RNA–RNA interactions of the miRNA–lncRNA and the miRNA–mRNA heteroduplex hybrids were predicted using the BiBiserve2-RNAhybrid web server, and their mfes were calculated [59]. The lncRNA interaction with the miRNAs plays a crucial role in the expression of the target gene at both transcriptional and posttranscriptional levels [79, 80]. The mature miRNAs generally interact with the 3′ UTR of target mRNAs and repress their translational efficiency or either degrades it completely, thereby regulating their expression levels [81]. The mfes of the top best hybrids of the lncRNA–miRNA heteroduplexes of CRNDE–hsa-miR-181a-5p and SNHG7–hsa-miR-216b-5p were predicted to be −25.3 Kcal/mol and −23.7 Kcal/mol, respectively, as shown in Figure 7. Likewise, the mfes of the top best hybrids of the mRNA–miRNA heteroduplexes of hsa-miR-181a-5p–CTNNB1, hsa-miR-181a-5p–TCF4, and hsa-miR-216b-5p–GALNT1 were predicted to be −26.3 Kcal/mol, −26.6Kcal/mol, and −26.9 Kcal/mol, respectively, as shown in the Figure 7. Additionally, the mfes of the top 5 best hybrids were provided in Table 3. From the above observations, we could predict that the lncRNA CRNDE acts as an hsa-miR-181a-5p sponge and the lncRNA SNHG7 acts as an hsa-miR-216b-5p sponge in the KRAS-associated COAD. The miRNA stability determines the target mRNA degradation efficacy, and its stability is mainly governed by seed sequence interaction of miRNA (2–7 nts in 5′→3′ direction), GC%, and thermodynamic stability (melting temperature), respectively. From our results, we could observer that the miRNA seed sequence of hsa-miR-181a-5p and hsa-miR-216b-5p has perfect complementary to the target mRNAs and also has high melting temperature (TM) which indicates the thermodynamic stability of the miRNA ensures its high stability and efficacy toward the target mRNAs, respectively, as shown in Figure 7 and Table 4. Several studies indicated the significance of miRNA inhibitors from natural source which reduces drug resistance and could have enhanced bioavailability in several cancers [82–84]. Our investigation also predicted the potential inhibitors of hsa-miR-181a-5p and hsa-miR-216b-5p inhibitors, and their structures were shown in Figure 8.
From the observations, we found that the top potential inhibitors of both miR-181a-5p and miR-216b-5p belong to anthraquinone, quinazoline, and sulfonamide family of compounds. These scaffolds and their compounds were previously reported for their potential anticancer properties against various cancers including PDAC, CRC, and NSCLC, respectively. Anthraquinone-based compounds were reported for their potential in regulating apoptosis, autophagy, cell cycle, and sensitization of chemotherapy and radiotherapy [85]. Quinazoline-based compounds were reported to exhibit significant cytotoxic potential against various cancers including CRC and PDAC and also plays vital role in tubulin polymerization [86]. Furthermore, the sulfonamide-based compounds were reported have inhibitory potential against various cancer targets such as Bcl-2, PI3K, and mTOR, respectively [87]. Notably, the amsacrine (lead compound against miR-181a-5p) was known for its significant anticancer properties against acute myeloid leukemia (AML) [87, 88].
From our observations, we found that the KRAS-associated lncRNA CRNDE sponges the hsa-miR-181a-5p and downregulates their expression, and hsa-miR-181a-5p further regulates the expression of CTNNB1 (upregulation was observed mostly due to higher concentration of cytoplasmic CTNNB1) and TCF4 in the CRC progression. And in the KRAS-associated lncRNA SNHG7 axis, the GALNT1 was downregulated by the 3′UTR binding of hsa-miR-216b-5p. Thus, we conclude that the CRNDE/hsa-miR-181a-5p/(CTNNB1/TCF4) and SNHG7/hsa-miR-216b-5p/GALNT1 axis could be a therapeutic target in the KRAS-associated COAD. Natural compounds have the potential inhibitory activity against hsa-miR-181a-5p and hsa-miR-216b-5p and have to be explored more in the near future. The overall work and future directions of the present study were depicted in Figure 9. In the SNHG7/hsa-miR-216b-5p/GALNT1 axis of the KRAS-associated CRC, there is an evidence of upregulation of O-glycosylation of MUC1, OPN, MMP14, and EGFR, which could be studied further for therapeutic interventions [89, 90]. Although our predictions support the evidence of the interaction and regulation, this has to be studied further in vitro and in vivo settings in the near future.
5. Conclusion and Future Perspectives
The lncRNAs regulate the miRNAs which further result in the dysregulation of mRNAs in various KRAS-associated cancers such as CRC, PDAC, and NSCLC. From our study, we have observed that CRNDE sponges and downregulates the hsa-miR-181a-5p expression, which further regulates the expression of CTNNB1 and TCF4 in the CRC progression. Likewise, SNHG7 regulates hsa-miR-216b-5p expression that further downregulates the GALNT1 expression in COAD. Notably, both the miRNAs showed high thermodynamic stability and efficacy toward the target mRNAs. We conclude that the CRNDE/hsa-miR-181a-5p/(CTNNB1/TCF4) and SNHG7/hsa-miR-216b-5p/GALNT1 axis could be a therapeutic target in the KRAS-associated COAD. Natural compounds particularly based on anthraquinone, quinazoline, and sulfonamide scaffolds have potential and significant inhibitory activity against hsa-miR-181a-5p and hsa-miR-216b-5p, which could be harnessed as a therapeutic strategy in KRAS-associated COAD. However, outcomes from our bioinformatics approaches are propitious; these lncRNA/miRNA/mRNA axes have to be studied further in in vitro and in vivo settings such as high-throughput screening of natural miRNA inhibitors, gene knockout studies in animal models, and pharmacokinetic/pharmacodynamic (PK/PD) studies of inhibitors targeting these lncRNA/miRNA/mRNA axes, respectively, in the near future to completely evaluate them as a therapeutic target. Alongside this, significant therapeutic strategies have to be developed to inhibit KRAS-associated lncRNAs with successful clinical manifestations among patients.
Conflicts of Interest
The authors declare no conflicts of interest.
Author Contributions
Prasanna Srinivasan Ramalingam conceptualized and designed the work. Prasanna Srinivasan Ramalingam performed the analysis and wrote the manuscript. Deepak B. Thimiri Govinda Raj and Murugan Subramanian provided valuable insights to enhance the quality of the manuscript. Sivakumar Arumugam supervised the work, validated the results, and corrected the manuscript. All the authors proofread the manuscript.
Funding
No funding was received for this research.
Acknowledgments
The authors would like to thank Vellore Institute of Technology (VIT), Vellore, India, for providing the necessary facilities to carry out this work. Prasanna Srinivasan Ramalingam would like to thank the Council for Scientific and Industrial Research (CSIR) for providing him the Senior Research Fellowship (File No.: 09/0844 (18240)/2024-EMR-I).
Supporting Information
Additional supporting information can be found online in the Supporting Information section.
Open Research
Data Availability Statement
All the data analyzed during this study were included in this article and supporting information.


