Development of MXene-Enabled Titanium Carbide (TiC) Impurities-Based Electrodes for the Fabrication and Circuit-Level Testing of Gel-Based Supercapacitors
Abstract
Flexible and stretchable supercapacitors developed on MXene-enabled Titanium Carbide (TiC) impurities-based electrodes with novel electrolytes are the point of focus in this work. Five different electrodes are prepared with different TiC content and symmetric supercapacitors are fabricated with three electrolytes named acrylamide, N,N′-Dimethylacrylamide, and 2-Hydroxyethyl methacrylate to achieve flexibility and improved energy storage. Before electrode fabrication, all the samples are tested with the X-ray Diffraction technique. Cyclic voltammetry is performed at a potential window from −1 to 1 V to evaluate the specific capacitance of fabricated supercapacitors at multiple scan rates. Electrochemical impedance spectroscopy is performed to study the Randles circuit, and Rs values are calculated to examine the maximum physical area used for the evaluation of supercapacitors. Open-circuit and short-circuit tests are performed after charging the capacitor at 1 V for 2 min each time and compatibility of electrodes with different electrolytes is analyzed. The figures of merits for all the techniques used are discussed in detail. The highest values of the specific capacitances reported in our work are 50 and 79 F/g with novel electrolytes termed as N,N′-Dimethylacrylamide and 2-Hydroxyethyl methacrylate, respectively.
1. Introduction
Due to decreased fossil fuels and increased environmental pollution, future technology will inevitably be based on advanced energy harvesting and storage devices [1, 2]. The main emphasis of scientists is now on developing modern technologies and new electrode materials for electrochemical applications, such as supercapacitors and batteries [3]. With excessive advancements in electrochemical techniques and processes, supercapacitors are now replacing batteries for high-power energy storage applications because of their high flexibility, low charge/discharge time, high power density, excellent cyclability, high durability, and energy delivery at large units of power [4, 5, 6]. Energy storage capability depends on electrode and electrolyte materials and their mass, architecture, and surface area [7, 8]. The capacitance, cycle characteristics, and rate characteristics of supercapacitors mainly depend on the composition of their electrodes [9]. Numerous electrode materials have been studied due to their substantial properties and potential applications in supercapacitors. The optimum electrode should possess a unique nanostructure that increases the kinetics by reducing transport and diffusion path lengths for ions and electrons [10, 11]. Transition metal carbides are an excellent material for supercapacitor electrodes due to their better electrical conductivity and enhanced chemical stability. Among them, titanium carbide (TiC) has distinctive properties, such as strong resistance to corrosion, thermal stability, and oxidation resistance [12, 13]. TiC (MXene-enabled impurities) has low density (4.93 g/cm3), high microhardness (28 GPa), high Young’s modulus (450 GPa), and electrical conductivity (up to 105 Sm−1) [14, 15]. Due to the exceptional properties of TiC, it is used as raw material to prepare two-dimensional metal carbides/nitrides, also known as “MXenes.” TiC is used as raw material in the preparation of the MAX phase and remains present in MXene as an “impurity” after the etching [16, 17]. In this work, TiC-based electrodes are inserted in poly(vinyl alcohol)/poly(acrylic amide-co-2-acrylamido-2-methylpropane sulfonic acid)/glycerol hydrogel gel polymer electrolyte [18]. Then, two novel electrolytes are prepared by replacing Acrylamide with N,N′-Dimethylacrylamide and 2-Hydroxyethyl methacrylate. TiC-based electrodes show high-specific capacitance, high flexibility, and improved energy storage capabilities in novel electrolytes. The challenges of stacking and leaking with the solid and liquid electrolytes were identified as areas where gel-type electrolytes could offer potential solutions [19]. Polyvinyl alcohol (PVA) is a leading candidate for water-based gel polymer electrolytes due to its cost-effectiveness, eco-friendliness, and safety [20].
2. Experimental Section
2.1. Preparation of Electrolyte
For the preparation of the acrylamide-based electrolyte, 0.2 PVA powder was dissolved in 6 mL of distilled water for 1 hr at 90°C. The prepared solution of PVA was mixed with 1 mL of glycerol and kept on stirring for 10 min. 0.0662 g irgacure, 1.36 mg MBA (N,N′-Methylene-bis-acrylamide), 1.775 g Acrylamide, and 0.525 g AMPS (2-Acrylamido-2-methyl-1-propanesulfonic acid) and were added into PVA/glycerol solution, followed by stirring until all components were dissolved [18]. The hydrogel precursor solution was prepared after stirring and then it was poured into a mold and placed in sunlight. Then, two novel electrolytes were prepared by replacing Acrylamide with N,N′-Dimethylacrylamide and 2-Hydroxyethyl methacrylate.
2.2. Preparation of Electrode
Polyvinylidene fluoride (PVDF) particles, activated carbon, and N-methyl pyrrolidone (NMP) solvent were purchased from Sigma–Aldrich. TiC was purchased from (Shanghai Alladin Biochemical). To fabricate supercapacitor electrodes, TiC, activated carbon, and PVDF were weighed, and then crushed in mortar and pestle to form a fine powder. Then, NMP was added to the powder to formulate a homogeneous slurry. Then, the slurry was deposited on two carbon cloth fibers by dip coating and dried for half an hour on a hot plate at 50°C, as shown in Figure 1. After appropriate placement and drying more electrolyte was poured and kept in sunlight until gel formation. Supercapacitors were packaged with a polymer sheet once the electrolytes were dried. Carbon cloth-based supercapacitors have low cost, excellent electrical conductivity, and good mechanical strength, improving the device’s flexibility [21, 22, 23].
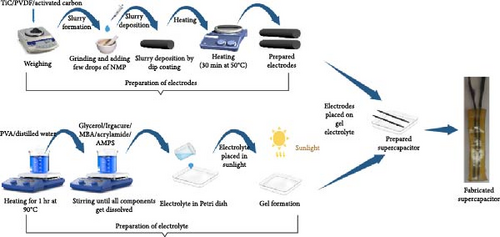
Five pairs of electrodes were prepared using the same procedure with different contents of TiC and activated carbon, as shown in Table 1. The TiC/AC mixture with contents (in the ratio of x, 0.10813 − x) were named S1, S2, S3, S4, and S5, respectively. PVDF was used as a binder and NMP was used as a solvent for slurry preparation. Then, electrodes with the same configuration were placed on as-fabricated electrolytes and labeled as E1, E2, and E3, respectively.
| Sr. no. | Samples | Activated carbon (g) | TiC (g) | PVDF (g) | Net mass (g) |
|---|---|---|---|---|---|
| AC | MXene-enabled impurities | Binder | |||
| 1 | S1 | 0 | 0.10813 | 0.00983 | 0.11796 |
| 2 | S2 | 0.004915 | 0.103215 | 0.00983 | 0.11796 |
| 3 | S3 | 0.00983 | 0.0983 | 0.00983 | 0.11796 |
| 4 | S4 | 0.05895 | 0.04915 | 0.00983 | 0.11796 |
| 5 | S5 | 0.10813 | 0 | 0.00983 | 0.11796 |
3. Results and Discussion
3.1. X-Ray Diffraction Analysis (XRD)
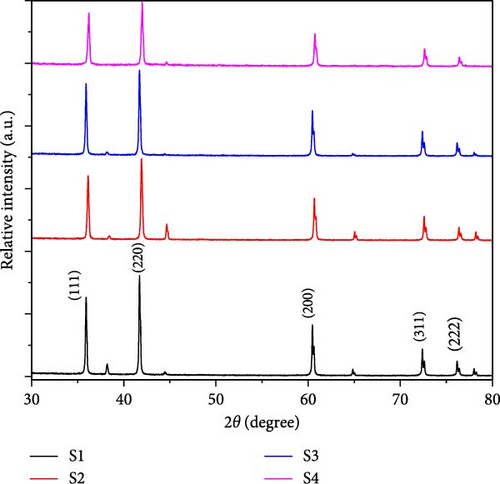
The phase changes and crystallinity of as-synthesized samples as shown in Table 1 are analyzed using X-ray diffraction (XRD), at 2θ values of 5°–80°. From Figure 2, the diffraction peaks at 35.912°, 41.707°, 60.454°, 72.360°, and 76.132° are attributed to the reflections from the (111), (200), (220), (311), and (222) planes, respectively [15]. All samples show different intensities at specified angles due to the addition of activated carbon.
The electrochemical characteristics of the fabricated supercapacitors are inspected using numerous techniques, i.e., cyclic voltammetry (CV), open-circuit and short-circuit charge–discharge tests, and electrochemical impedance spectroscopy (EIS).
3.2. Cyclic Voltammetry
CV is a widely used electrochemical technique for evaluating the electrochemical performance of supercapacitors. While performing CV, a voltage-dependent current curve arises by applying a potential (V) at time (t) at a constant rate [24]. In our work, the fabricated supercapacitors (Table 1) are checked by a multimeter after fabrication. For a quick check on whether the supercapacitor is fabricated or not, it is connected with a conventional ohmmeter for its early inspection. As for the current-based transient analysis of any capacitor, the current magnitude readily decreases as a function of time. As the current decreases, the resistance magnitude increases from a lower magnitude to a higher level of extent. Thus, if the supercapacitor has successfully fabricated, the resistance magnitude (measured from the ohmmeter) should gradually increase. However, this early inspection provides us with a quick check, but it may produce parasitic voltages on supercapacitor electrodes, which might produce technical problems for CV measurements. To overcome the problems produced by the inspection of a supercapacitor with an ohmmeter (with an internal battery effect in circuitry), it is essential to completely discharge the supercapacitor by shorting both electrodes before performing CV [25]. It means that the voltage on the supercapacitor should be zero before performing CV to reduce losses while doing calculations of specific capacitance.
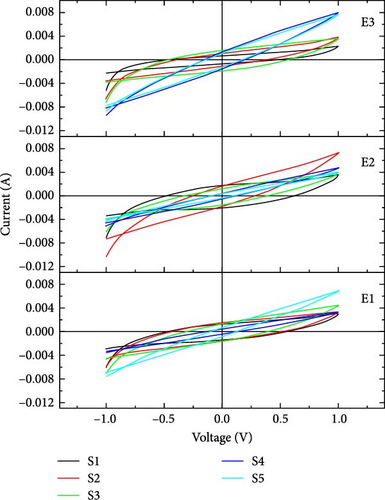
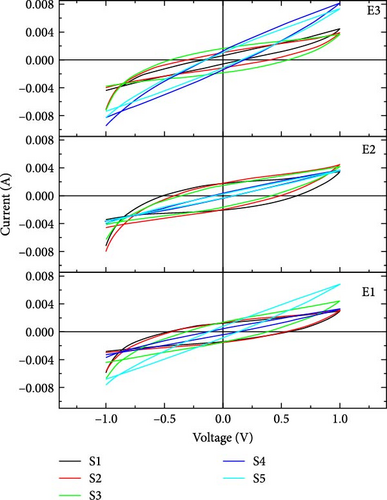
In our work, CV was performed at three scan rates, i.e., 10, 50, and 100 mV/s. In Figure 3, it is seen that the slope of the voltage–time curve at a high scan rate is greater than the slope at low scan rates. The maximum voltage is achieved rapidly at a high scan rate compared to a low scan rate. CV was performed at the potential window from −1 to 1 V.
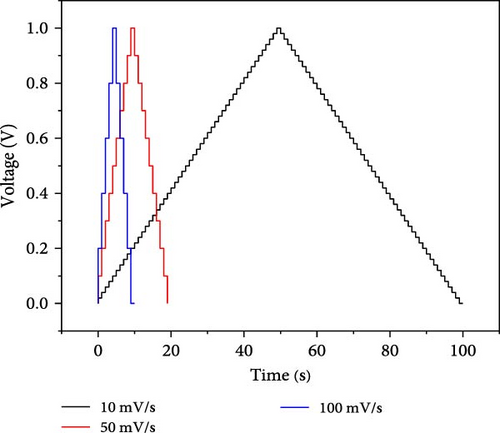
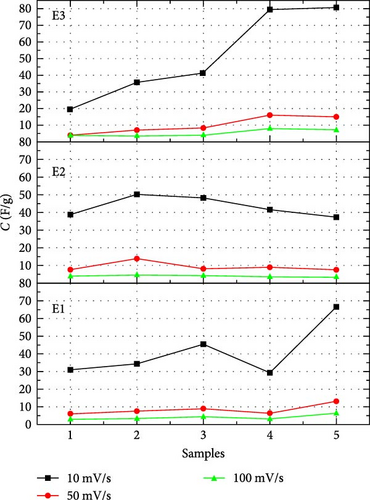
Table 2 shows the capacitance of reported TiC-based supercapacitors and the capacitance of TiC-based supercapacitors with gel electrolytes reported in this work. TiC-based supercapacitors reported show high values of capacitance (50 and 79 F/g) as compared to MXene-based supercapacitors (54 and 7 F/g) [31]. Specific capacitance is calculated at 10 mV/s because the inner surface charge contribution is greater at lower scan rates than that at high scan rates [32].
| Device | Electrolyte | Specific capacitance | Technique | Scan rate | Reference |
|---|---|---|---|---|---|
| TiC/C//TiN/C | Na2SO4 electrolyte | 103 F/g | GCD | 0.5 A/g | [29] |
| TiC nanotube arrays | PVA–Na2SO4 | 4.05 mF/cm−2 | GCD | 0.05 mA/cm−2 | [30] |
| TiC nanotube arrays | PVA–KOH | 27.6 mF/cm−2 | GCD | 0.4 mA/cm−2 | [30] |
| TiC nanotube arrays | PVA-H3PO4 | 53.3 mF/cm−2 | GCD | 0.2 mA/cm−2 | [10] |
| Titanium carbide (MXene) | 1 M H2SO4 | 54 F/g | CV | 2 mV/s | [31] |
| Titanium carbide (MXene)/MWCNT | Organic electrolyte | 7 F/g | CV | 2 mV/s | [31] |
| TiC/AC | 2-Hydroxyethyl methacrylate-based electrolyte | 79 F/g | CV | 10 mV/s | This work |
| TiC/AC | N,N′-Dimethylacrylamide-based electrolyte | 50 F/g | CV | 10 mV/s | This work |
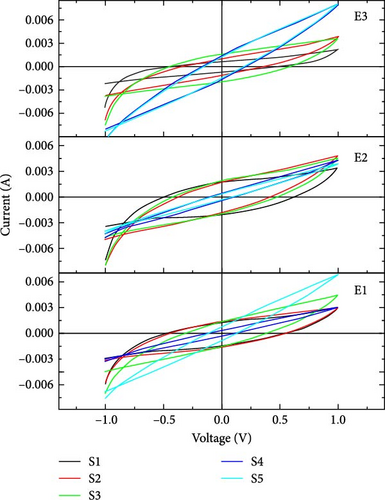
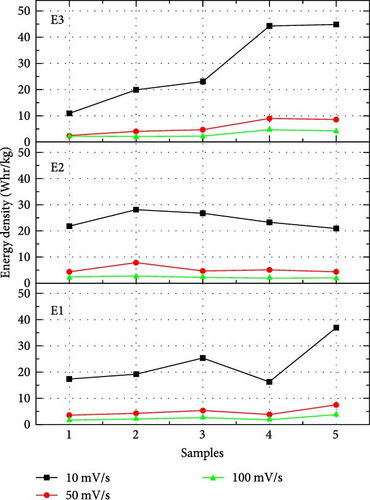
In our work, CV curves having voltage window from −1 to 1 V are shown in Figure 4. At a lower scan rate, electrolyte penetrates deeply through nanosheets, which increases the specific capacitance [33]. Figure 5 compares the specific capacitance and energy densities of all the supercapacitors calculated from Equations (1) and (2), respectively, in different electrolytes at various scan rates. The supercapacitor with 2-Hydroxyethyl methacrylate-based electrolyte (E3) shows a specific capacitance of 79 F/g for sample S4 at the scan rate of 10 mV/s. Supercapacitor with N,N′-Dimethylacrylamide-based electrolyte (E2) shows a specific capacitance of 50 F/g for sample S2 at a scan rate of 10 mV/s.
3.3. Electrochemical Impedance Spectroscopy (EIS)
EIS is a material characterization technique used to evaluate important parameters and values of different electric circuit components at a wider spectrum than other commonly used techniques, such as CV [34, 35]. In EIS analysis, Randles circuit is evaluated as shown in Figure 6. Randles circuit model is represented by AC circuit elements, i.e., resistor and capacitor. In the Randles model, Rs, Ret, and Cnf are evaluated in a particular configuration. Rs is electrolyte resistance and Ret is electron transfer resistance through the electrode and electrolyte interface. Cnf is a non-Faradic capacitance that arises from the electrode’s surface.
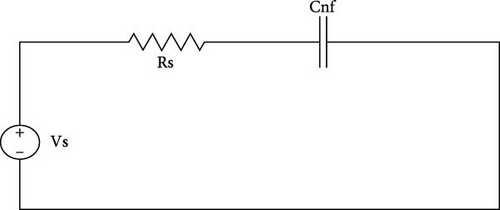
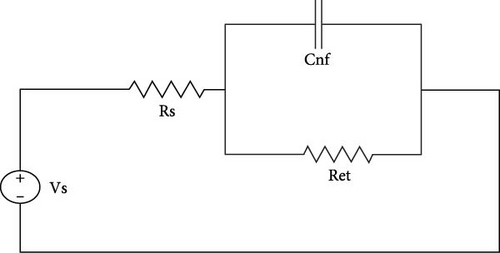
In Figure 6(a), the circuit is evaluated with a non-Faradic process. In a non-Faradic process, all charge is accumulated on the non-Faradic capacitor. In Figure 6(b), the circuit is with the Faradic process in which capacitance offers infinite impedance so all current passes through Ret [34].
EIS defines internal electrical measurements of the supercapacitors by working under two probe method. In two probe method, the anode and cathode were connected during performance analysis. The initial working conditions were kept constant. The pretreatment time is 5 s. AC amplitude is 0.01 V Vac and frequency changes from 0.1 Hz to 10 kHz at a charging voltage of 1 V DC. Nyquist plots and Bode plots (impedance-based and phase-based) are used to measure the values of circuit elements.
Nyquist plot also called a complex plane plot is used to measure magnitudes of AC elements in Randles circuit. Nyquist plot is constructed by plotting real impedance on the x-axis (ZRe) and imaginary impedance (−ZIm) on the y-axis. The x-axis provides key information about magnitudes of Rs and Ret (Rp) [36]. If the supercapacitor is considered ideal, then series resistance Rs is considered zero, and electron transfer resistance (parallel resistance) Ret is considered infinity [37]. However, these considerations do not apply to real supercapacitors. Figure 7 shows the Nyquist plot in both normalized scale and logarithmic scale. Table 3 shows the Rs value for all supercapacitors at 1 V, evaluated from the Nyquist plot in Figure 7. These findings show positive and negative features of resistances for better operation of supercapacitors. For optimum performance of the supercapacitor, the Ret magnitude should be of the maximum possible value and Rs should be close to zero [38]. In Figure 7(a), the Nyquist plot shows that Ret (Rp) does not appear in the frequency range in which EIS is performed because the semicircle is not completed. It means a larger frequency range should be opted to examine EIS spectra. It is shown in Table 3 that in all electrolytes, Sample S1 which is purely TiC shows the lowest Rs (72.07 Ω) with novel electrolyte E3 which is the main figure of merit for EIS calculations. When the quantity of TiC is decreased and AC carbon is added while keeping the net mass the same, the value of Rs increases.
| Series resistance | E1 | E2 | E3 | ||||||||||||
|---|---|---|---|---|---|---|---|---|---|---|---|---|---|---|---|
| S1 | S2 | S3 | S4 | S5 | S1 | S2 | S3 | S4 | S5 | S1 | S2 | S3 | S4 | S5 | |
| Rs (Ω) | 93.9 | 105.8 | 90.51 | 198.8 | 114.6 | 77.98 | 101.8 | 106.1 | 180.1 | 202.2 | 72.07 | 76.71 | 78.67 | 79.8 | 89.17 |
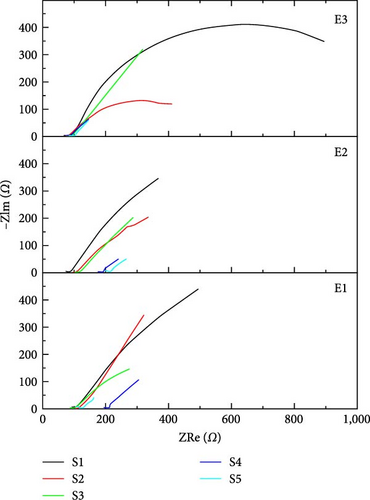
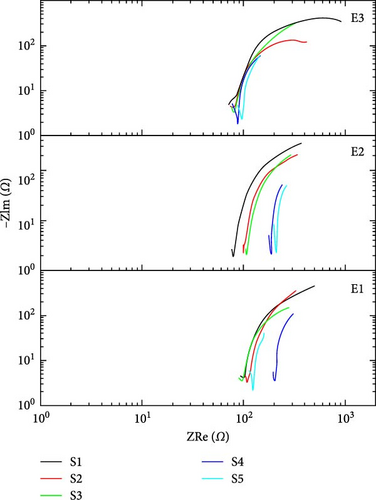
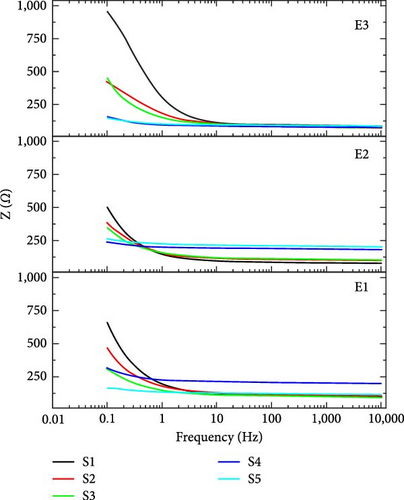
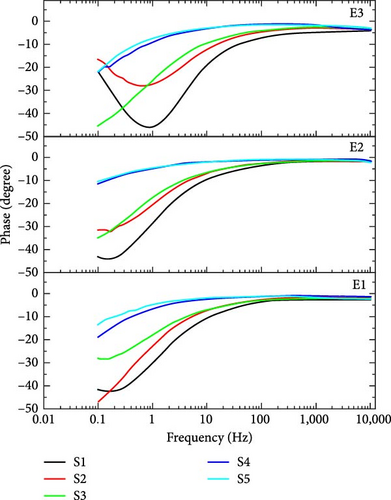
Figure 8(a) shows the impedance-based Bode plots of said supercapacitors. Impedance-based Bode plot is between frequency and impedance (Z). This plot describes the change in the trend of overall impedance with frequency. From Bode plot analysis, real and imaginary impedance response of supercapacitor can be calculated. Real and imaginary impedances can be used to calculate the real and imaginary capacitance behavior of supercapacitors. Figure 8(a) shows that the impedance decreases with the increase in frequency and vice versa. Figure 8(b) shows the phase difference-based Bode plots for a charging voltage of 1 V. In a phase difference-based bode plot, frequency is along the x-axis and the phase angle is along the y-axis. The phase difference between voltage and current is phase angle magnitude. If the supercapacitor is considered ideal, then this phase difference is −90° which means that current is leading voltage by 90° phase shift. According to basic circuit theory, at a higher frequency, the impedance of the capacitor is nearly equal to zero, and at a lower frequency, impedance of the capacitor approaches infinity [37]. The charge will readily flow through Rs at a high frequency. In a simple resistor, the phase difference between current and voltage is equal to zero, i.e., at high frequencies, phase angle is equal to zero. At a low frequency of 10 mHz, the impedance of the capacitor becomes high. The phase angle is maximum in low-frequency regions and the maximum physical area of the capacitor can be evaluated at low frequencies. According to Figure 8(b), sample S1 which is purely TiC shows the highest value of phase difference with novel electrolytes E2 and E3 means the maximum physical area is evaluated in the case of electrodes of pure TiC.
3.4. Kinetics of Electric Current
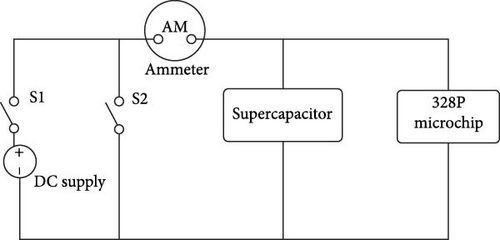
Kinetics of electric current at charging voltage of 1 V is also studied here. Figure 9 shows circuit schematics for charging and discharging of supercapacitors. In charging and discharging of supercapacitor, a DC power supply ammeter, supercapacitor, and 328P microchip are used.
The charging behavior of the supercapacitor can be analyzed at 1 V. We can plot the transient behavior of charging current (mA), capacitance (F), and voltage (V) to analyze the time-based charging mechanism. In Figure 10, the voltage versus time curve shows variation in the behavior of charging voltage from ground (0–1) V.
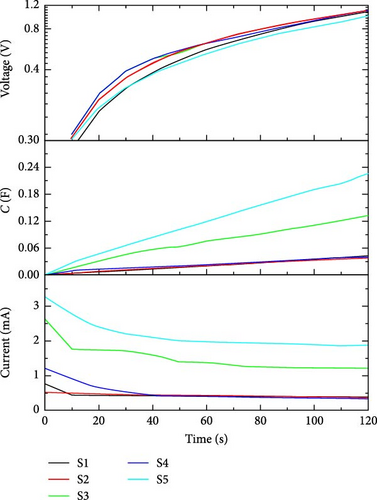
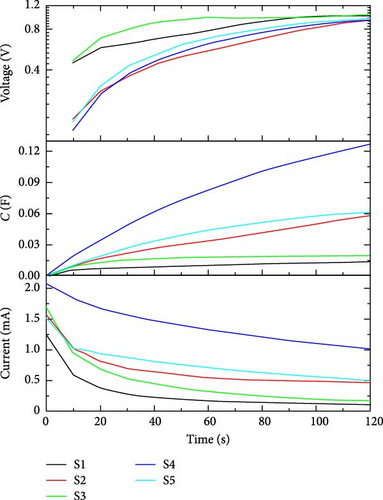
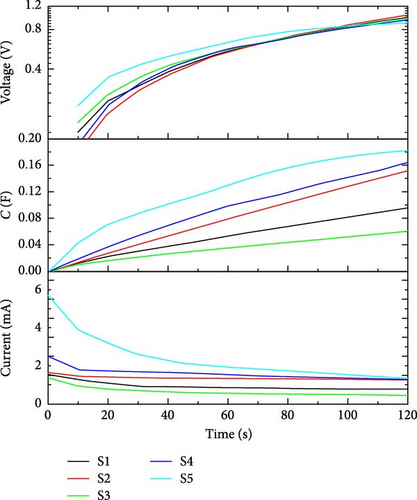
During the time period of voltage variation, capacitance builds with charging current as a function of applied voltage. From the current kinetics figure, we can easily study the charging behavior of a supercapacitor. While studying charging behavior, time can be calculated for a particular supercapacitor to charge completely at the applied charging bias of 1 V. Table 4 shows the currents and capacitance values of all supercapacitors while charging at 1 V for 120 s.
| Electrolyte | Current (mA) | Capacitance (mF) | ||||||||
|---|---|---|---|---|---|---|---|---|---|---|
| S1 | S2 | S3 | S4 | S5 | S1 | S2 | S3 | S4 | S5 | |
| E1 | 0.7 | 0.5 | 2.6 | 1.2 | 3.2 | 42.3 | 39.9 | 132.1 | 39.51 | 226 |
| E2 | 1.26 | 1.56 | 1.69 | 2.07 | 1.52 | 12.96 | 58.43 | 19.89 | 126.7 | 61.3 |
| E3 | 1.55 | 1.66 | 1.38 | 2.51 | 5.71 | 95.72 | 151.5 | 60.3 | 164.2 | 182.61 |
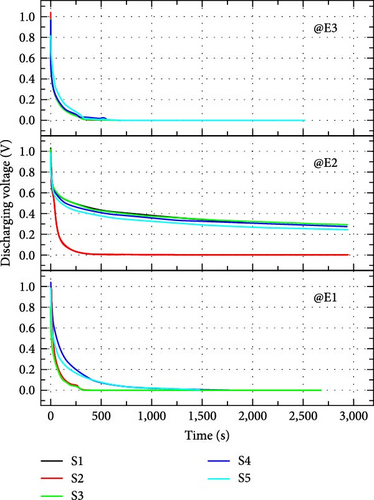
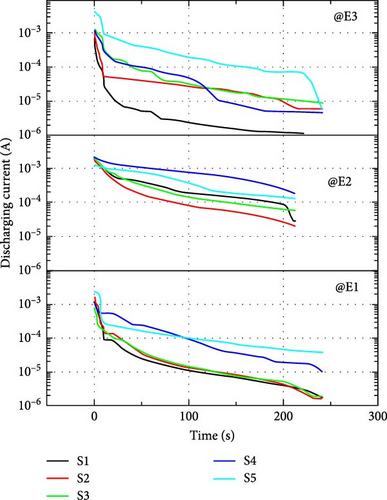
In the short and open-circuit tests, discharging current and discharging voltages are calculated, respectively, without much power loss as no direct load is connected. The impedance of the load is maximum and no current flows through the open-circuit so only the discharge voltage magnitude is recorded. In short-circuit conditions, minimum resistance is offered so current through an ammeter is recorded. The resistance present in the short-circuit test is the small resistance offered by the ammeter only.
The time of voltage storage can be calculated by the discharge voltage curve at no load, as shown in Figure 11(a). It is noticed that when switch S1 and switch S2 open in Figure 9, the voltage drops immediately in the discharge curve. During this time, no voltage is measured at load terminals and it is called dead zone. After the dead zone, the voltage is sustained due to stored charge and it is called as operation zone of the supercapacitor [36]. Figure 11(b) shows the discharging current characteristics of supercapacitors. Table 5 shows how much current can be provided by a supercapacitor for 4 min. In the case of discharging current and voltages, electrolyte E2 shows the best behavior among the three electrolytes. In open-circuit characteristics, electrolyte E2 shows high values of initial currents, more than 1,200 μF in all samples, and also high values of lowest current after 4 min, more than 20 μF in all cases. The electrostatic phenomenon at full load for the S4 sample provided both the initial and final currents to their maximum extent with the E2 electrolyte. In open-circuit characteristics, electrolyte E2 shows the best compatibility with fabricated electrodes. In the case of electrolyte E2, the dead zone is from 0.9 to 0.7 V except for S2 which discharges quickly in all cases (with all electrolytes). Samples with novel electrolyte, E2 (except S2) retain a voltage of approximately 0.3 V after ~3,000 s (50 min) which is a figure of merit of an open-circuit test. The operating time of electrodes with electrolyte E2 is approximately half an hour.
| Electrolytes | Current (μA) | |||||||||
|---|---|---|---|---|---|---|---|---|---|---|
| S1 | S2 | S3 | S4 | S5 | ||||||
| Initial current | Final current | Initial current | Final current | Initial current | Final current | Initial current | Final current | Initial current | Final current | |
| E1 | 1,272 | 1.7 | 1,567 | 1.6 | 779 | 1.91 | 983 | 10.8 | 2,320 | 38.2 |
| E2 | 1,890 | 29 | 1,805 | 21 | 1,935 | 58.7 | 2,011 | 189 | 1,247 | 128 |
| E3 | 706 | 0.1 | 1,100 | 6.1 | 1,199 | 9 | 1,126 | 4.7 | 4,100 | 6.7 |
Five different electrode materials were tested by decreasing TiC content and this scheme for three different electrolytes. We have performed CV by using a conventional potential window and highlighted the losses against the typical window. Furthermore, the concept of a modified potential window has been discussed at length. EIS and kinetics of current (open-circuit and short-circuit characteristics) have also been discussed.
4. Conclusion
In summary, five different electrode materials were tested with three different gel electrolytes to study their behavior and compatibility of electrodes with electrolytes. We have deliberately used TiC material just to investigate only MXene impurities as a conducting media in supercapacitors. MXene-enabled TiC impurities-based electrodes showed attractive electrochemical properties with novel N,N′-Dimethylacrylamide-based electrolyte and 2-Hydroxyethyl methacrylate-based electrolyte. The highest values of the specific capacitances in our work are 50 and 79 F/g with N,N′-Dimethylacrylamide and 2-Hydroxyethyl methacrylate, respectively. EIS is used to calculate Rs and Ret values for all supercapacitors in which supercapacitors with pure TiC electrodes show the best results with 2-Hydroxyethyl methacrylate, i.e., smallest value of Rs (72.09 Ω). Open-circuit and short-circuit characteristics show that all the electrodes have the best compatibility with N,N′-Dimethylacrylamide-based electrolyte. The operating time of electrodes with the same electrolyte is approximately 30 min. So, TiC-based supercapacitors made here have a useful combination of properties of electrodes with novel electrolytes.
Conflicts of Interest
There are no conflicts of interest.
Acknowledgments
The work was supported by the Higher Education Commission (HEC), Pakistan (grant no. 20-ICRG-165/RGM/HEC/2020).
Open Research
Data Availability
Data that support the findings of this study are available within the article.


