Analytical Solution of the Projectile Motion Under a Linear Drag Force
Abstract
Motion of a projectile in the absence of any resistive medium is quite ideal and has an exact analytical solution in classical mechanics. Ordinarily, projectiles move in a resistive medium which modify the acceleration of the body both in the horizontal and vertical directions. So far, the time of flight and the range arising from the solution of the classical problem due to the presence of a linear velocity-dependent resistive force are not exact and can only be determined numerically. In this work, we attempt to solve the problem analytically. We resolve the underlying difficulty in the analytical problem by deriving an analytical function which guides the dynamics of the projectile and by calculating iteratively the falling time as a function of the maximum height reached. We show that the effect of the viscous drag force in the time of flight of the projectile may lead to time asymmetry in the upward and downward motion, reduced maximum height reached, time of flight, and range for any initial launching speed. The downward motion is established to take more time than the upward motion. We obtain excellent agreement between the calculated values and the computed trajectories.
1. Introduction
A projectile can be defined simply as any flying object. Examples of projectiles include a ball kicked at an angle of elevation or a bullet fired in space. Projectile motion has been well studied from antiquity by prominent scientists like Aristotle, Galileo, Euler, Newton, and several others. A historical development of the subject is well discussed in literature [1, 2]. The motion of a projectile in the absence of any resistive medium is quite ideal and has an exact analytical solution in classical mechanics. Ordinarily, projectiles move in a resistive medium which modify the acceleration of the body both in the horizontal and vertical directions, leading to variations in the maximum height reached, time of flight, and the range of the projectile. An accurate description of these dynamical variables in projectile motion in a medium is still a subject of research and pedagogical interest.
The relationship between the drag force and velocity of the object moving in the drag medium is not precisely known [3]. The science of modeling drag in aerodynamics is considered to be more physical and empirical than mathematical, and it relies on the results of the wind tunnel experiments [4]. The linear dependence of the drag force on velocity is universally accepted as the first approximation of the drag force which, under some circumstances, yields results which agree quite well with observations [5]. Empirically, a linear dependent drag force predicts experiments better at relatively low velocities. At very high velocities, however, the linear drag model fails and better results follow the quadratic velocity dependence [6–10]. A gap is therefore created at intermediate velocities which is neither described by the linear or quadratic drag laws. Also, certain aspects of the projectile dynamics remain unclear. For example, calculations derived from both linear and quadratic drag laws predict drag-induced time and space asymmetries which require experimental verification. These uncertainties can be removed if there is a better agreement between theory and experiment.
So far, the time of flight and the range arising from the solution of the classical problem due to the presence of the linear drag are not exact and can only be determined approximately because of the presence of transcendental equations [5, 11–15]. A few semianalytical solutions have been suggested though [14, 16], expressing the time of flight and the range in terms of Lambert functions, or using the method of trajectories in phase space [17], but these still need further numerical techniques to completely solve the related dynamical problems. Timmerman and van der Weele [18] attempted a completely analytical solution for a projectile launched vertically upwards under both linear and quadratic drag. In their solution, the time of flight for the projectile under quadratic drag could be solved exactly, while for linear drag, it could only be estimated approximately. Even within the linear drag model, there are still outstanding questions to be answered in the description of projectile motion. For example, it may be of interest to know if there is a disparity between an exact analytical solution and a numerical solution for the time of flight and the range of the projectile [14].
In this study, we have attempted an analytical approach in the solution of the problem by focussing specifically on the linear drag model. The effects of the quadratic drag, aerodynamic lift, upthrust, and wind drift have been ignored, although we recognize that they may have significant effects at high launching speeds. We resolve the underlying difficulty in the analytical problem by constraining the falling time as a function of the maximum height reached and consequently using the calculated time to determine the terminal speed in the vertical projection. We observe that the time taken to reach the maximum height, the maximum height reached, the time of flight, and the range are reduced as expected. We show that the trajectory is asymmetric both in time and in the horizontal displacement, where the time taken to reach the maximum height is less than the time taken to get back to the same initial vertical position from the maximum height reached; that is, it takes less time to go up than to come down. Conversely, the range is bigger on the upward trajectory than on the downward trajectory. We have also obtained an exact iterative formula for the time of flight which is in excellent agreement with the computational trajectories. The accuracy of the calculated results can be adjusted by increasing the number of iterations in the calculation of the falling time.
2. Theory
3. Results
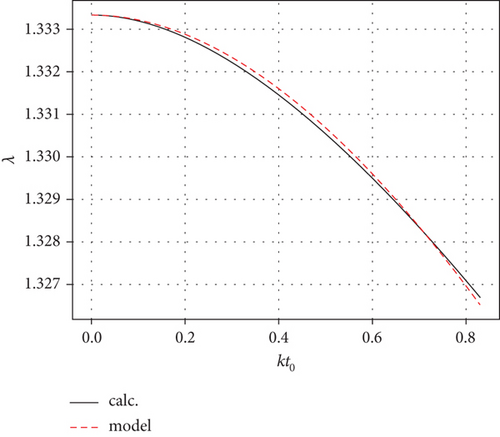
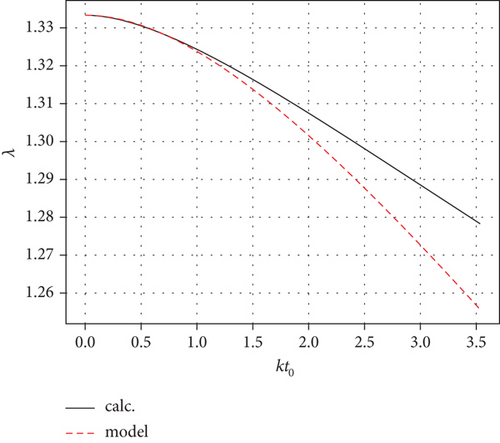
We have analyzed the projectile motion under linear drag forces analytically and compared our results with numerically generated data. The major challenge with the numerical description of projectile motion under linear drag is that the relations for time of flight and the range are functions of the transient time leading to transcendental equations. In our analytical treatment, we solve the ordinary differential equations by accounting for energy dissipation by the drag forces using Equation (24), with λ as the dimensionless number. The time of flight is calculated accurately by determining the falling time τ2 iteratively using Equation (31). Using the time of flight calculated, the range is consequently determined. Our calculations are then compared with numerical values in the computed trajectory of the projectile. All calculations and computations reported in this work have been done using a Python code.
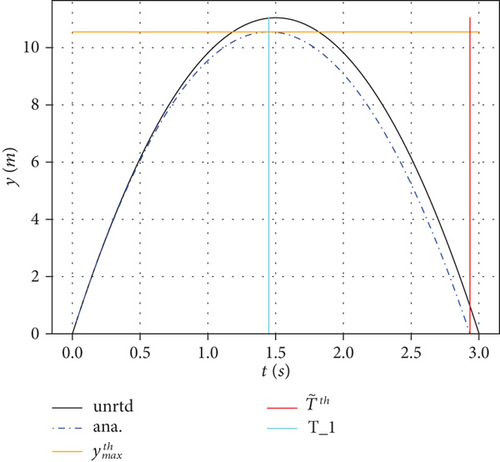
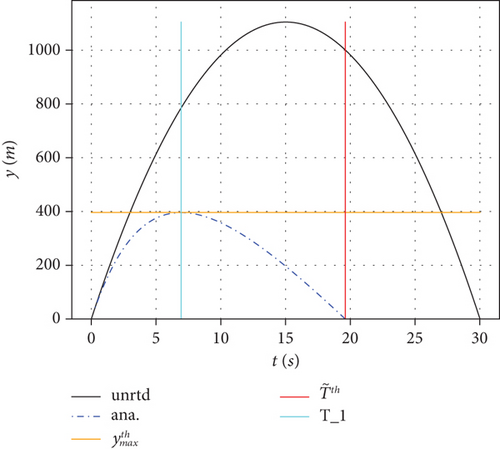
To allow for comparison with works already reported in literature, we chose to use a projectile with an initial velocity of 170 m/s projected at an angle of inclination of 60° to the horizontal axis, and k ≈ 0.047, as reported in ref. [2]. We have also included results for one-tenth of the initial velocity (17 m/s) and results for k = 0.2, corresponding to a projectile whose mass is approximately a twentieth of the original mass in the same medium of propagation. Our results have been calculated theoretically and computationally. The results are summarised in Table 1 and in Figures 1, 2, 3, and 4. The theoretical calculations, based on the formulas outlined in Section 2, are presented in Table 1. τ0 is the time of flight for the unresisted trajectory, is the drag-free natural time corresponding to the maximum height reached under drag, τ1 is the time taken to reach the maximum height for the resisted trajectory, τ2 is the time taken from the maximum height to the range, x0 is the range for the unresisted motion, τ = τ1 + τ2 is a time of flight with τ1 calculated exactly using Equation (8), and τ2 is calculated iteratively using Equation (31). The dimensionless number λ has been determined using Equation (24). is the calculated range using Equation (14). x(τ1) is the horizontal distance covered at the maximum height reached calculated also using Equation(14). Likewise is the maximum height reached calculated using Equation (15). In the table, time is in specified seconds while distance is in metres.
| v0 (m/s) | k(s−1) | τ0 | τ1 | τ2 | τ | λ | x (τ1) | x0 | y0 | |||
|---|---|---|---|---|---|---|---|---|---|---|---|---|
| 17 | 0.047 | 3.00 | 1.46 | 1.45 | 1.48 | 2.93 | 1.31 | 11.91 | 25.51 | 23.29 | 11.04 | 10.55 |
| 170 | 0.047 | 30.01 | 12.46 | 11.35 | 13.80 | 25.16 | 1.23 | 748.02 | 2551.28 | 1254.34 | 1104.74 | 761.96 |
| 170 | 0.2 | 30.01 | 8.96 | 6.93 | 12.63 | 19.56 | 1.15 | 318.79 | 2551.28 | 416.51 | 1104.74 | 394.40 |
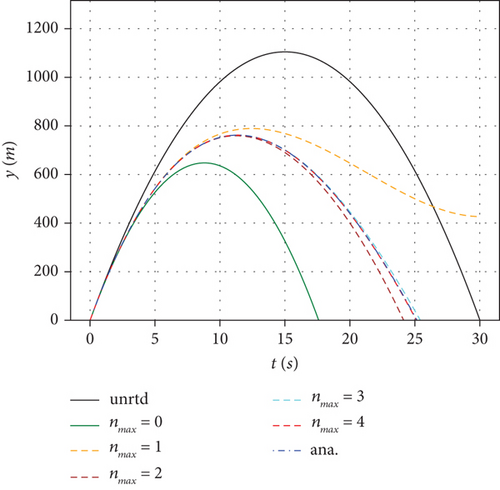

In Figure 1, we show the convergence of the computational trajectory evaluated using a numerical and analytical γ(k, t) distribution functions given by Equations (26) and (27) for different values of nmax. It can be seen that for the chosen projectile parameters, nmax = 4 (as shown in Figure 1) is sufficient for full convergence, and a choice of a smaller nmax may lead to divergence like for the case of nmax = 1 as shown in Figure 1. For higher orders of numerical expansion, it is expected that the numerical and the analytical functions of γ(k, t) be in excellent agreement. This condition has been satisfied in our work for the highest order chosen. We therefore did not find it necessary to go beyond nmax = 5. Also, having verified the performance of the analytical function γ(k, t) in Figure 1, it has consequently been used in all our results.
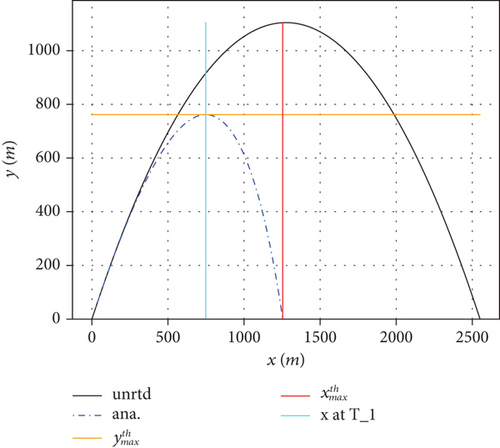
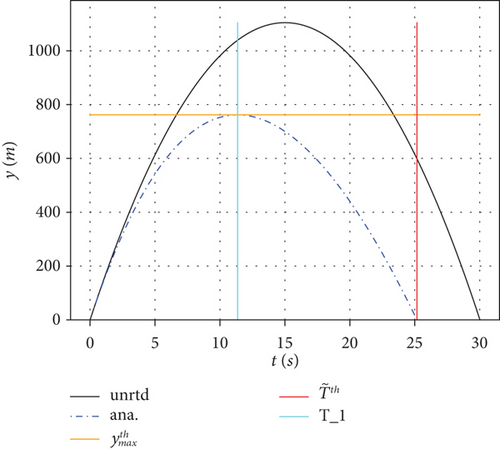
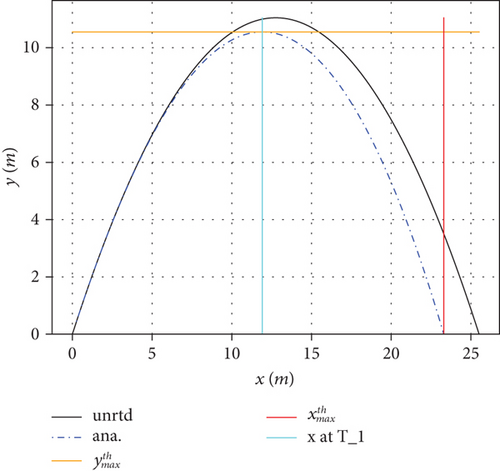
In Figures 2, 3, and 4, we compare the corresponding results with set (a) displaying the trajectories in the y − x plane and set (b) displaying the trajectories in the y − t plane, respectively. In the figures, the black solid line corresponds to the unresisted projectile while the blue dash dot line corresponds to the analytical trajectory (with γ(k, t) given by Equation (27)). The thin solid horizontal and vertical lines correspond to the calculated values for the maximum height reached, (orange); horizontal displacement at maximum height, x at τ1 (cyan); and range, (red), in Figure 2(a) or time at maximum height, τ1 (cyan), and time of flight, (red), in Figure 2(b) correspondingly.
As expected, and as observed from the results presented, the linear drag acting on the projectile reduces the time of flight, the maximum height reached, and the range. Equations (8), (31), and (32) have been used to calculate the time of flight. Computationally, the displacements in the x and y directions have been evaluated as functions of time t as shown in the trajectories in Figures 2, 3, and 4. The computations utilize the function γ(k, t) defined analytically using Equation (27). In the figures, we have also plotted our theoretical calculations for the range (xmax), the maximum height reached (ymax), and the time of flight (τ), evaluated using Equations (10), (14), (25), and (32), respectively, for comparison with the values in the trajectories.
It can be seen from the figures that our theoretical and computational results are in excellent agreement with each other for all the dynamical parameters used in this work. The accuracy relies so much on the number of iterations used in Equation (31). In Figures 2 and 3, only two iterations were sufficient to generate an accurate time of flight, but in Figure 4, five iterations were used. This shows that the number of iterations required for accurate results increases with the launching speed v0 and the drag parameter k.
In general, just as observed in ref. [18], our results show that the time taken to fall down is actually more than the time taken to rise upwards in all the cases that we have considered. This can be phenomenologically explained using the fact that in the upward trajectory, the deceleration is higher than the gravitational value leading to , while on the downward trajectory, the acceleration is less than the gravitational value for the same distance travelled leading to as presented in Table 1. So, the projectile naturally takes more time to fall than to rise up as determined by the linear drag-induced time asymmetry, .
It is observed that the effect of linear drag is diminished at lower launching speeds and also at lower values of k, while at higher launching speeds and at higher values of k, the effect is magnified. Experimental observations, on the other hand, show that even at higher speeds, the deviation of the projectile from the trajectory of the unresisted motion is not very large [2]. This shows that at higher launching speeds, the effects of other forces, which are unaccounted for by the linear drag model, may become significant. A more inclusive model therefore becomes necessary to account for the discrepancy with the experimental observations.
4. Conclusion
In this study, we have attempted an analytical approach in the classical solution of the projectile motion problem under a linear velocity-dependent drag force. We show that the time of flight, and consequently the range, can be calculated accurately through iteration. The accuracy obtained in our work rests on the analytically derived distribution function γ(k, t) and the number of iterations used in Equation (31). We observe that the time taken to reach the maximum height, the maximum height reached, the time of flight, and the range are reduced as compared to an unretarded motion. We show that the time of flight and the range are asymmetric. That is, it takes less time to go up than to come down. On the contrary, part of the range covered in the upward trajectory is more than the part covered in the downward trajectory. The y − t graph is therefore peaked to the left while the y − x graph is peaked to the right.
Conflicts of Interest
The authors declare no conflicts of interest.
Funding
The authors received no specific funding for this work.
Appendix A
Open Research
Data Availability Statement
All the data generated in the work are embedded as figures in the manuscript.


