Numerical Study of the Boundary Layer Separation of a Low-Pressure Turbine Cascade at Different Incidence Angles
Abstract
Modern low-pressure turbine (LPT) pursues high blade loading to improve its efficiency while the possibility of boundary layer separation on the blades is still a challenging problem. The incidence angle is one of the main factors affecting the flow separation and laminar-turbulent transition, which is of key importance for the design of LPT. In this work, based on the initial simulation results obtained using the Reynolds-averaged Navier–Stokes (RANS) method, the flow past a single LPT cascade at three representative incident angles (i = −10°, 0°, +10°) is investigated using large-eddy simulation (LES) method with approximately 26 million structured grids. The simulations are carried out with Open Source Field Operation and Manipulation (OpenFOAM) for an off-design low Reynolds number condition Re = 40,000 and Ma = 0.5. The time-averaged aerodynamic performances and three-dimensional instantaneous flow characteristics of the LPT cascade are discussed in detail, and the results show that the blade loading and the transverse pressure gradient (TPG) from the pressure side to the suction side of leading edge (LE) increase with increasing incidence angle. At the incidence angle of +10°, the LPT cascade undergoes separation and reattachment from the LE to around 20% Cax on the suction surface, which weakens the separation phenomenon at the rear half of the suction surface and the total pressure loss downstream of the trailing edge (TE). It is worth noting that the RANS method underpredicts the blade boundary layer separation region compared with LES under these extreme conditions. These results may offer off-design condition data for the future improvement of RANS models or experimental studies.
1. Introduction
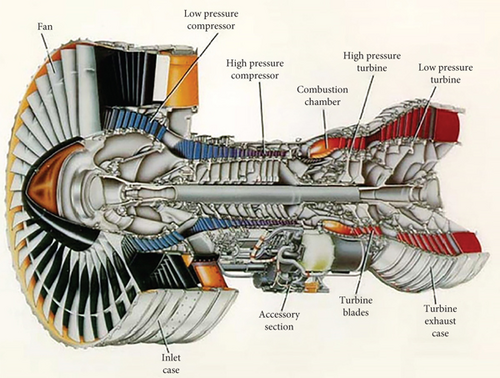
In modern turbomachinery applications, the performance of low-pressure turbines (LPTs) plays a vital role in extracting power from gas flows to drive fans, propellers, shafts, and the first compressor stages [1] as shown in the cross-section of a commercial turbofan engine Figure 1. Given that LPTs can account for up to 30% of the engine’s weight, enhancing their aerodynamic efficiency has become a valuable task in the gas turbine design and manufacturing process [3]. Under working conditions characterized by low Reynolds numbers, the suction side of LPT blades generally exhibits a large laminar boundary layer region [4]. Nowadays, one of the goals is to reduce the number of blades and stage spacing for an improved overall efficiency [5]. However, it is important to consider the potential consequences, such as the likelihood of increased adverse pressure gradient (APG) regions on the blade suction side and the subsequent intensification of boundary layer separation, resulting in substantial losses [6].
Several studies have demonstrated that the incidence angle (i) exerts a significant influence on the boundary layer state and transition processes. For instance, Simoni et al. [7] conducted experimental investigations to examine the aerodynamic efficiency of a LPT blade operating at design and off-design conditions from −9° to +9°. The authors found that off-design operation of the blade primarily affected the blade loading distribution on the suction side, specifically in the region extending from the leading edge (LE) up to the velocity peak position. This alteration in the loading distribution was observed for both steady and unsteady flow cases. However, the variation in incidence angle had only a marginal effect on the diffusion rate in the rear part of the blade. In the unsteady case, losses monotonically decrease as the incidence angle is reduced, whereas the loss distribution has a minimum value near the nominal zero incidence angle for the steady flow condition. Similarly, Wang et al. [8] performed numerical and experimental simulations under five different incidence angles (from −10° to +7.8°) over the T106A blade and concluded that the influence of the incidence angle on the flow field is mainly shown at the front of the suction side and pressure side. As the incidence angle changes from positive to negative, the separation bubble near the LE disappears and the blade loading decreases gradually. In the perspective of the evolution of vortex structures, the spanwise vortexes roll up near the LE and gradually evolve into streamwise vortexes. High-energy fluid in the main flow was driven to near-wall zone by the rotating effect of streamwise vortexes, which increases the fluid momentum inside the boundary layer. The streamwise vortexes are stretched by the strong acceleration of the flow until they transport to the trailing edge (TE).
It is evident that factors such as incidence angle significantly influence the state of the boundary layer, especially under low Reynolds number conditions. Therefore, accurate prediction of boundary layer states is crucial for LPT design to meet stringent performance and weight requirements [9]. However, experimental investigations of boundary layer transition under low Reynolds number conditions can be challenging due to the required low-pressure and high-temperature environments. To overcome these challenges, the large-eddy simulation (LES) method [10] has gained significant attention in predicting the laminar-to-turbulent transition process of the boundary layer without the need for additional modeling steps [11]. Notably, LES has proven successful in the research of LPTs [12–16] and the prediction of boundary layer transition with sufficient grid and near-wall refinements. Compared to Reynolds-averaged Navier–Stokes (RANS), LES provides more detailed and time-dependent information and accurate results in terms of total pressure losses in the wide design space generally required for changing operating conditions of LPT [17], facilitating a comprehensive understanding of the significant large-scale flow features and energy transfers associated with turbulence.
In this paper, we employ the Open Source Field Operation and Manipulation (OpenFOAM) [18] software to investigate the influence of the incidence angle on the aerodynamic performance of an LPT cascade under an off-design low Reynolds number condition Re = 40,000 and Ma = 0.5. By utilizing LES, we aim to obtain comprehensive and accurate results that can guide future experimental studies and LPT design. To establish a reliable computational setup, our approach builds upon the initial simulation results obtained using RANS methods, serving as a basis for conducting large-scale LES simulations of the LPT blade in a three-dimensional cascade configuration. The structure of this paper is as follows: In Section 2, the computational setup including the geometry, mesh strategy, numerical conditions, numerical methods, and experimental validation is introduced. In Section 3, detailed results derived from the LES simulations are presented, shedding light on the influence of the incidence angle on the aerodynamic performance of the LPT cascade. In Section 4, comparison between simulation results of RANS and LES is conducted to emphasize the implications of our work for future LPT design and optimization efforts. Finally, in the conclusion, we summarize the key findings and discuss their significance in the context of LPT design and optimization.
2. Computational Setup
2.1. Geometry and Mesh Strategy
The LPT investigated in this paper is an industrial design model. Main aerodynamic design parameters of the blade are given in Table 1, while further detailed aerodynamic design parameters are not given due to confidentiality. Given that introducing a symmetric plane at midspan would suppress the turbulence fluctuation [14], full span of the blade is simulated [19] in order to obtain better details of the midspan flow field.
| Name | Symbol | Magnitude |
|---|---|---|
| Inlet flow angle | β1 | 107° |
| Outlet flow angle | β2 | 38° |
| Stagger angle | βs | 60.5° |
| Blade chord | C | 52.89 mm |
| Blade axial chord | Cax | 46.248 mm |
| Pitch | t | 38.47 mm |
| Blade span | h | 100 mm |
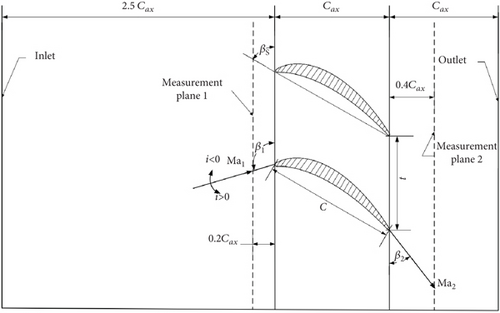
This paper focuses on numerical simulations of a single blade cascade. Figure 2 shows the cross-sectional views of the computational domain. The inlet is set 2.5 Cax upstream of the LE and the outlet is set 1 Cax downstream of the TE, leading to a simulation domain size of 4.5 Cax. For the convenience of comparing and verifying with future experiments, two measurement planes are defined to ensure that the simulation results meet the working condition requirements. Measurement Plane 1 is located 0.2 Cax upstream of the LE and Measurement Plane 2 is located 0.4 Cax downstream of the TE.
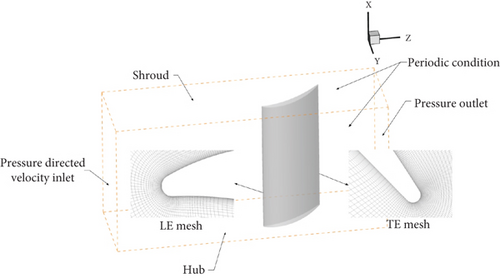
Applying the same mesh strategy in [20], a high-quality mesh with the minimum orthogonal quality above 0.77 has been generated for numerical simulations. The mesh is an H–O–H structured mesh of 26,184,000 cells in total, which is more than sufficient to support the correctness of calculation and save computational resource at the same time [20]. The mesh in near-wall regions is refined for resolving the boundary layer. In the spanwise direction, the mesh expansion ration is 1.06 with the number of flow paths set to 501 and the cell width at hub and shroud set to 1 × 10⁻⁵ m. The first layer height of the mesh near the suction and pressure surface is also set to 1 × 10⁻⁵ m, which is more than sufficient for resolving the boundary layer, and the y+ calculation postprocess function in OpenFOAM is performed to ensure that the mesh satisfies . The diagram of the mesh used in the simulation near LE and TE is shown in Figure 3.
2.2. Flow Conditions and Numerical Methods
To investigate the aerodynamic performance of the LPT blade under off-design conditions, this paper focuses on testing at low Re and large positive or negative incidence angles. Typically, LPT operates with a blade-relative exit flow Ma in the range of 0.5–0.9 and a Re ranging from approximately 50,000 in the last stages and high altitude conditions of small business jet engines to about 500,000 at take-off conditions in the first stages of the largest turbofans [21].
For this study, all three numerical simulations were performed under the same plane-averaged Ma (Ma2 = 0.5) and plane-averaged Re (Re2 = 4 × 10⁴), as well as the same plane-averaged turbulence intensity (Tu1 = 1%), as shown in Table 2. The subscripts 1 and 2 indicate the average physical quantities measured on Measurement Plane 1 and Measurement Plane 2, respectively. To account for different incidence angle conditions and to compare with the zero incidence angle condition, negative and positive incidence angles of −10° and +10° were applied, respectively. This allowed investigating the influence of incidence angle on the aerodynamic performance of the LPT cascade.
| Case | i | Ma2 | Re2 | Tu1 |
|---|---|---|---|---|
| A | −10 | 0.5 | 4 × 10⁴ | 1% |
| B | 0 | |||
| C | +10 |
First, RANS simulations are carried out using the rhoSimpleFoam solver and the k-ω SST turbulence model, which are commonly utilized in OpenFOAM for steady-state simulations of compressible flow [18]. Based on the selected solver, total pressure inlet Pt,in, total temperature inlet Tt, and constant static pressure outlet Ps,out are applied to calculate pressure directed velocity U with incidence angle determined flow direction. In order to satisfy the numerical condition requirements indicated in Table 2, the detailed values of inlet and outlet boundary conditions shown in Table 3 are finally implemented after repeated adjustments and reliability verification.
| Symbol | Type descriptions | Values |
|---|---|---|
| U | pressureDirectedInletVelocity | Placeholder |
| Pt,in | totalPressure Inlet | 13,535.872 |
| Ps,out | fixedValue Outlet | 11,411 |
| Tt | totalTemperature Inlet | 472.5 |
| k | turbulentIntensityKineticEnergyInlet | Tu = 0.01 |
| ω | turbulentMixingLengthFrequencyInlet | L = 0.0037023 |
| νt | calculated | Placeholder |
As also shown in Figure 3, two periodic (cyclic) boundary conditions in the pitch direction of the cascade are considered to simulate the repeated cascades above and under the one simulated [3]. To maintain consistency with future physical experiments, the shroud and hub surrounding the turbine cascade are treated with the no-slip wall boundary condition, as applied to the blade.
Second, the RANS results are used as the initial flow field for transient simulations with LES to reduce the computational cost. After five times through the computational domain, the airflow during its subsequent traversal through the domain is subjected to time averaging. The popular wall-adapting local eddy-viscosity (WALE) model and the transient compressible OpenFOAM solver rhoPimpleFoam, which is also a pressure-based solver developed from PISO and SIMPLEC [3], are chosen as the turbulence model and solver for LES. When using the PIMPLE algorithm in rhoPimpleFoam, the “momentumPredictor” is activated; the “nOuterCorrectors” is set to 50, and the pressure equation is solved 2 times within 1 solution step according to the number specified by “nCorrectors.” The time step size was adjusted to 5 × 10⁻⁸ s in which the Courant–Friedrichs–Lewy (CFL) number would be kept below the unity. It is worth noting that the “turbulentInlet” boundary condition is adopted for the LES inflow to add fluctuation to the velocity field obtained from the RANS simulations. After strict testing and validation, the fluctuation scale of (0.07 0.07 0.07) satisfies the specified turbulent intensity requirement of Tu1 = 1% in Table 2.
2.3. Experimental Validation
As direct experimental data for comparative analysis is not currently available, we have embarked on the task of reproducing the study detailed in [20], utilizing previously introduced mesh strategy and numerical methods.
As clearly compared in Figure 4, our reproduced results of the time mean streamwise velocity profiles on suction side (Fig. 14 in [20]) and the time mean streamwise fluctuation rms (Fig. 15 in [20]) exhibit agreement with the experimental data from [22]. Notably, in specific sectors, our results demonstrate an enhanced performance relative to those of the original simulation results in [20].
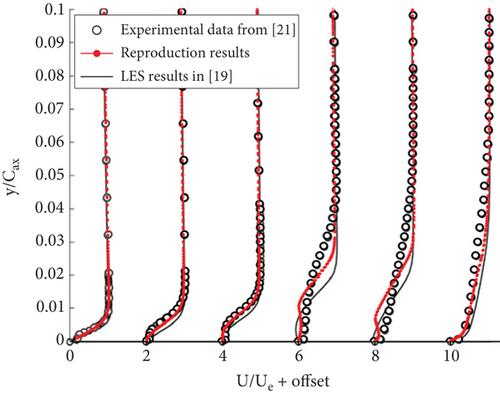
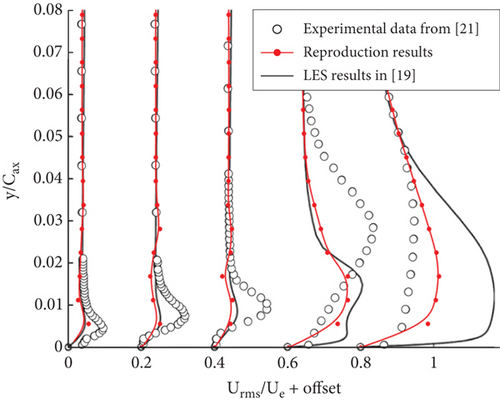
The successful alignment observed in these comparative results corroborates the robustness and reliability of our mesh strategy and numerical methods. This signifies that our methods are capable of producing accurate and dependable results, reinforcing the validity of our work in this paper.
3. Numerical Results of LES
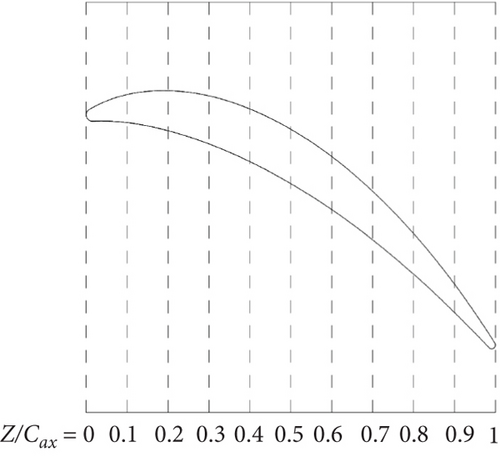
In this paper, we use nondimensional relative axial chord distance Z/Cax to define streamwise relative positions on the blade surface. Figure 5 shows the diagram of streamwise relative positions on the cross-section of the blade.
3.1. Time-Averaged Flow on Midspan
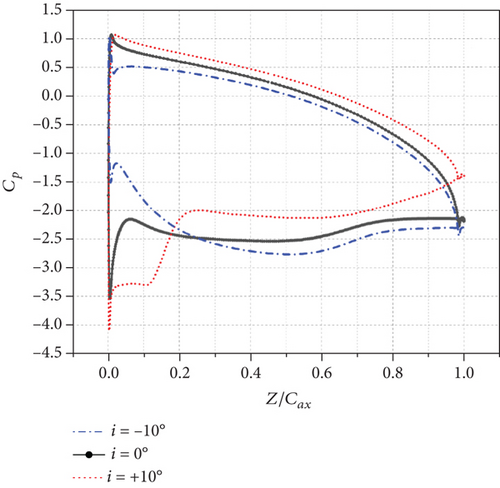
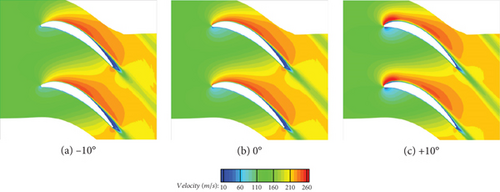
At i = 0°, on the suction side, Cp first increases in the APG region until a maximum value located around 5% Cax. Then, it slowly decreases in the favourable pressure gradient (FPG) region and increases in the APG region until reaching a pressure plateau from around 70% Cax to the TE which refers to a region on the blade surface where Cp remains relatively constant. Supported by Figure 7, it can be attributed to the separation of the boundary layer, which results in the formation of a region of nearly constant pressure [24]. In contrast, the pressure side undergoes steady FPG region and no apparent separation phenomenon is observed.
At i = −10°, on the suction side, the maximum value of Cp near LE increases and the position of the maximum value moves towards LE until the location around 2% Cax, indicating an increase in the static pressure near the LE on the suction side [8] and resulting in a stronger FPG region before reaching the pressure plateau at nearly the same location around 70% Cax. In contrast, the appearance of a minimum value near LE and the decrease of the Cp curve indicate a decrease in the static pressure near the LE on the pressure side.
Different from the two conditions above, at i = +10°, there is a pressure plateau from the LE to around 10% Cax on the suction side, which indicates a separation and an expanding high-velocity region near LE as shown in Figure 7 and results in the delay of the maximum value of Cp (the APG region) until around 20% Cax. It is worth noting that the Cp curve increases slowly in the APG region from around 70% Cax to the TE instead of remaining constant in a pressure plateau, which weakens and narrows the low-velocity (separation) region near the TE gradually as shown in Figure 7.
The comparison of midspan contours of time-averaged streamwise velocity is shown in Figure 8 with streamlines attached to further explain the influence of increasing incidence angle on the time-averaged flow field on this midspan section.
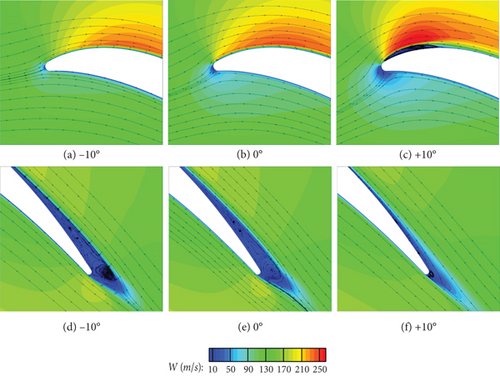
As incidence angle increases, a low streamwise velocity region gradually forms at LE, and this low streamwise velocity region gradually expands and strengthens. This is because as incidence angle increases, the location (stagnation point) where the airflow collides with the LE gradually moves towards the pressure side, causing an increase in the static pressure on the suction side of LE and a decrease in the static pressure on the pressure side of LE. Due to the resistance of the pressure side, the airflow that collides with the pressure side deflects after passing around the LE, and the ability of the boundary layer on the suction side to resist APG weakens [25]. As a result, the recirculation phenomenon from LE to the suction side become more and more apparent. At i = +10°, an independent separation bubble (recirculation region) appears on the suction side of LE. However, due to the strong shear-induced energy dissipation and influence of FPG, the airflow quickly reattaches to the wall.
As incidence angle increases, the separation bubble in the rear half of the suction side and wake region gradually decreases. At i = +10°, the size of the separation bubble has significantly reduced. This is because after the separation and reattachment of the boundary layer on the suction side of LE, the velocity of the airflow is accelerated due to FPG and the ability of the airflow to resist APG is enhanced.
Vorticity describes the intensity and direction of airflow rotation and is an important parameter for analyzing boundary layer evolution. The larger the absolute value of vorticity, the stronger the energy exchange in the separation shear layer, which is the main region where dissipation and energy loss occur [26].
As shown in Figure 9, when i ≤ 0°, the airflow on the boundary layer flow of the suction side is laminar before open separation occurs, with larger velocity gradient due to viscous effects, forming higher vorticity zone, while the mainstream area outside the boundary layer has low dissipation. Because the airflow in this region is in an accelerated state, it is subjected to strong stretching, which largely suppresses the generation of velocity fluctuations [25, 27]. Therefore, the thickness of the high vorticity zone on the rear suction side slowly increases. After the boundary layer separates, the high vorticity zone leaves the wall.

At i = +10°, due to the occurrence of airflow separation and reattachment on the suction surface, the thickness of the high vorticity zone on the rear half of the suction surface increases, and the phenomenon of the high vorticity zone leaving the wall disappears, which can also explain the significantly reduced separation bubble in Figure 8.
The Reynolds stress describes the interaction between vortices in turbulent flow, where the Reynolds normal stress is related to viscous diffusion [28]. The midspan contours of time-averaged Reynolds stress components are shown in Figure 10. When i ≤ 0°, the maximum absolute values of the components of Reynolds normal stress are located in the downstream wake region of the blade, indicating that the alternating shedding of vortices from the suction and pressure sides causes large velocity fluctuations and viscous diffusion.

At i = +10°, due to the occurrence of separation and reattachment at LE of the suction side, the open separation near the TE is suppressed. This results in a high Reynolds normal stress region on the suction side near LE and a reduction in the Reynolds normal stress region near TE.
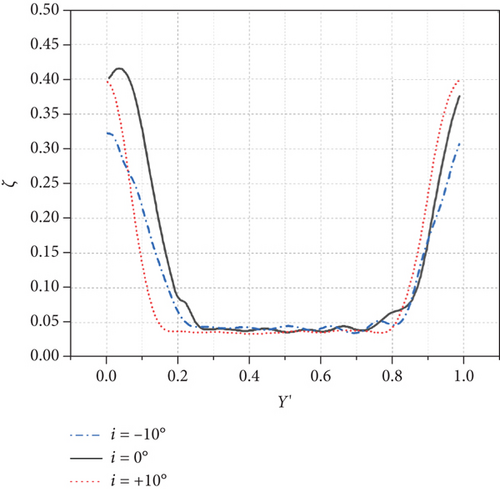
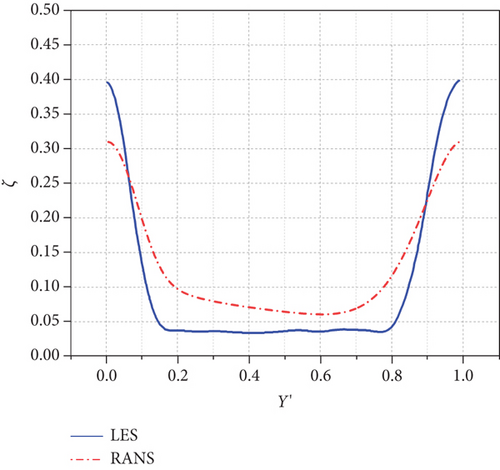
The maximum values of ζ at the midspan of Measurement Plane 2 when i = −10°, 0°, +10° are 0.322, 0.416, and 0.398, respectively. It is worth noting that when i = +10°, the maximum value of ζ at the measurement plane of midspan is decreased compared with that when i = 0° thanks to the early separation and reattachment near LE of the suction side.
3.2. Near-Wall Flow
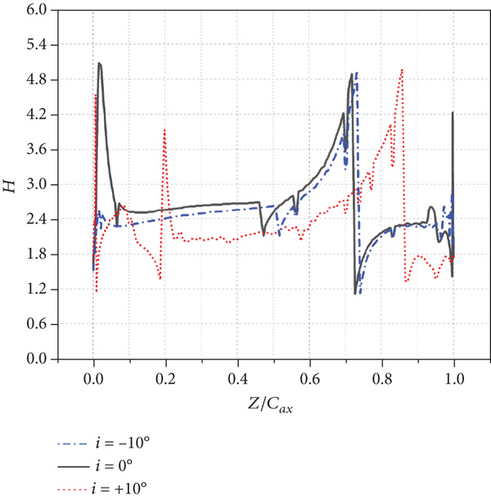
The smaller the H, the more rounded the velocity profile, which can resist boundary layer separation. Therefore, turbulent boundary layer velocity profile normally has smaller H [1]. In addition, H can also indicate the thickness of the separation bubble. A larger H corresponds to a thicker separation bubble. If there is a transition process in the boundary layer, the velocity profile will become less rounded, and the ability to resist boundary layer separation will become weaker. The H will sharply increase and there will be a peak. Therefore, regions with drastic changes in H often coincide with the occurrence and disappearance of boundary layer separation [25].
Midspan distributions of time-averaged shape factor H under different incidence angles are shown in Figure 12. On the suction side, when i = 0°, the H has a overshoot near LE and increases slowly and unsteadily which indicates the development of the laminar boundary layer under the influence of APG and FPG until it reaches the peak value around 4.8 and drops to the bottom sharply at the location of 72.6% Cax, indicating a separated boundary layer. Finally the H fluctuates around 2.4, which indicates the end of transition. When i = −10°, the overshoot near LE disappears and the boundary layer separation location delays slightly until 74% Cax. When i = +10°, the H undergoes fluctuation between 1.2 and 2.4 until a overshoot of 3.9 at the location around 20% Cax, which supports the boundary layer separation and reattachment near LE of the suction side under the strong influence of APG. It is worth noting that the peak value location (the boundary layer separation location) delays apparently until 86.6% Cax and fluctuates around 1.5 which also confirms a smaller but more turbulent separation bubble region change in Figure 8.
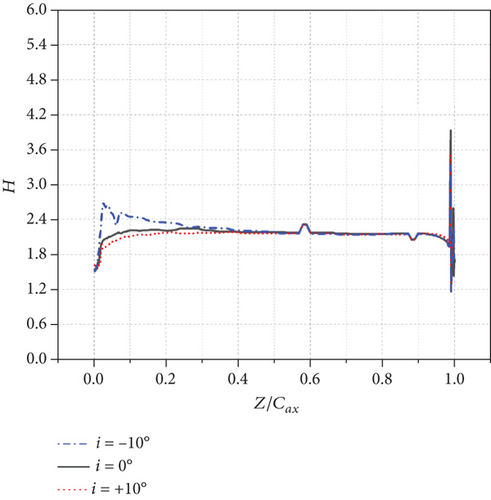
On the pressure side, as the incidence angle increases from negative to positive, H near LE decreases gradually. The H fluctuates between 1.2 and 2.5.
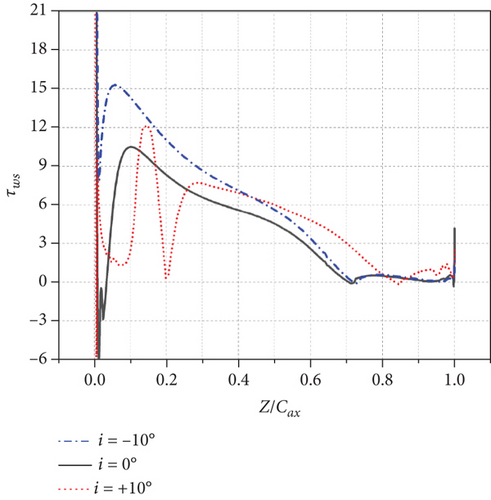

On the suction side, the negative τws positions are the same as the sharp drop positions of H in Figure 12. When i = 0°, the τws has a maximum value near the location around 10% Cax and decreases to negative values at the location of 72.6% Cax. When i = −10°, the maximum value of τws near the location around 10% Cax increases and the negative τws region (the boundary layer separation region) delays slightly until 74% Cax. When i = +10°, the τws also undergoes fluctuation before the location of 20% Cax because of the boundary layer separation and reattachment phenomena near LE of the suction side. The τws negative region (the boundary layer separation region) delays apparently until 86.6% Cax.
On the pressure side, slight difference of τws occurs near LE and TE. No negative τws or apparent separation is observed.
3.3. Three-Dimensional Instantaneous Flow
To further verify and analyze the transition positions and flow patterns of the time-averaged flow on midspan and near-wall regions, it is necessary to investigate the three-dimensional flow instantaneously. Based on the streamwise length of the computational domain and the time-averaged velocity obtained through RANS simulations, the flow-through time (1T) is defined as the time it takes for the airflow to flow from the inlet to the outlet (1.35 × 10⁻³ s), and three moments within the flow through time (1/3T, 2/3T, and T) are selected for the analysis of the instantaneous flow field.
Flow features on the suction side are focused since no separation phenomena were observed on the pressure side under all three incidence angles. Figure 14 illustrates the clear instantaneous evolution of vortex structures on the overall suction side including LE and TE. The visualization is achieved by generating an isosurface of the Q-criterion (Q = ×108), which is then contoured by the Mach number.
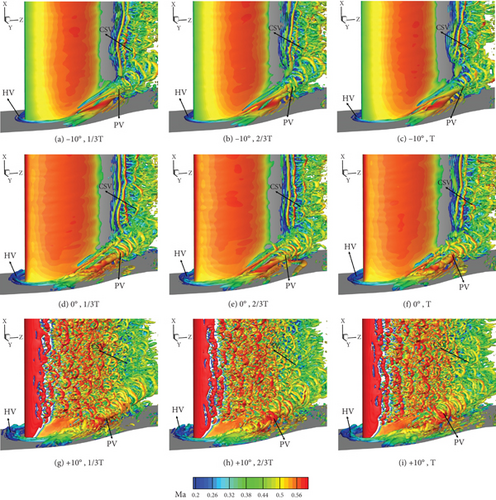
As marked in the figure, we can observe several common vortex structures in the LPT cascade: the horseshoe vortex (HV) near the LE, the passage vortex (PV) climbing and developing in the corner region, and the concentrated shedding vortex (CSV) induced by the suction effect of PV at the TE. The instantaneous evolution characteristics of the vortex structures on the suction side are consistent with the transition positions observed in Section 3.1. When the incidence angle increases to +10°, the Mach number significantly increases at the LE of the suction side, leading to the transition phenomenon.
For further explanation of this phenomenon, five slices are displayed in the streamwise direction to study the evolution of instantaneous pressure from shroud to hub in Figure 15. As the incidence angle increases to +10°, the low-pressure region downstream of the TE disappears, indicating a reduced wake separation zone and lower losses.

On the slice near end wall, a comparison with Figure 14 reveals a correlation between the location of the low-pressure region and the PV. Moreover, as the incidence angle increases, the low-pressure region at this position gradually intensifies. Hence, it can be inferred that the PV strengthens with an increasing incidence angle [1]. Furthermore, it is worth noting that as the incidence angle increases, the high-pressure region on the pressure side of LE continues to rise, while a low-pressure region appears on the suction side of LE. This suggests that the transverse pressure gradient (TPG) from the pressure side of LE to the suction side of LE strengthens with an increasing incidence angle [1].
Finally, in order to analyze the correlation between the PV and TPG, Figure 16 provides an enlarged view of the HV at the LE, with the turbulent kinetic energy (TKE) recontoured. The HV is commonly believed to form as a result of the stagnation effect induced by the LE, and it develops into two branches with opposite rotation directions along the suction side (suction side of HV [HVS]) and pressure side (pressure side of HV [HVP]) [15].
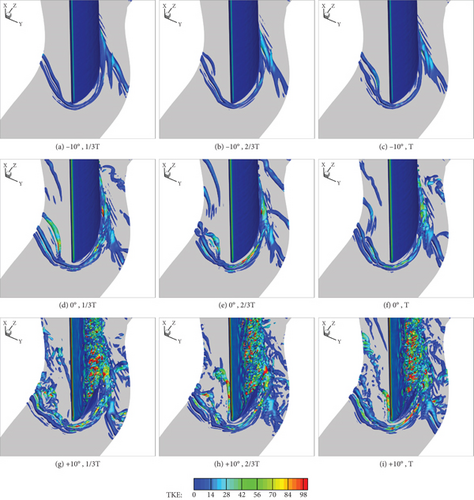
On one hand, the HVS ultimately breaks and dissipates not far from the LE as it progresses downstream because of weakening effects from both APG and TPG. On the other hand, as can be seen in Figure 16, the TKE in the HVP increases with an increasing incidence angle, which can be explained by the influence of the increasing TPG from the pressure side of LE to the suction side of LE. The disordered and intensified HVP develops towards the adjacent suction side of the blade. Eventually, it converges and interacts with the PV.
4. Numerical Result Comparison Between LES and RANS Simulations
In this section, numerical results of LES and RANS under three different incidence angles are compared. The results indicate that, compared with RANS, LES provides more pronounced and apparent predictions of the separation regions on the suction side of the blade.
The static pressure coefficient distribution comparison between RANS and LES is shown in Figure 17. When i ≤ 0°, the RANS results fail to predict the LES-predicted pressure plateau from around 70% Cax to TE on the suction side. When i = +10°, the LES-predicted pressure plateau from the LE to around 10% Cax on the suction side disappears.
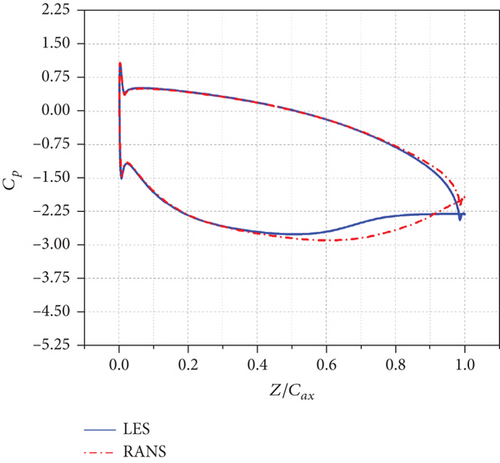
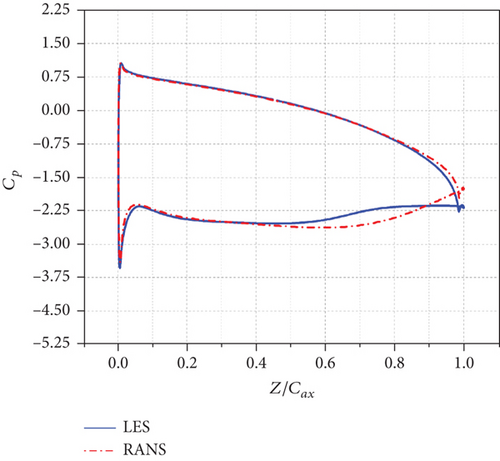
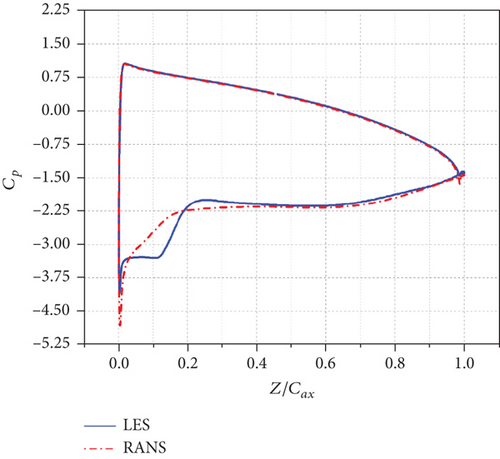
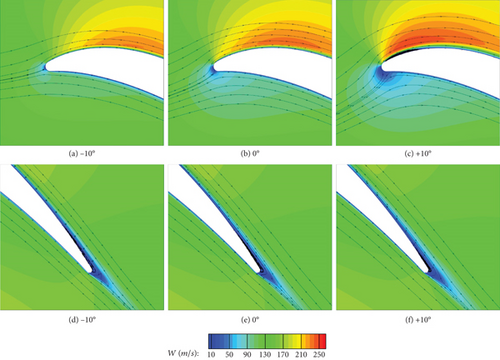
Figure 18 shows the midspan time-averaged streamwise velocity contours of RANS with streamlines attached under three different incidence angles. Comparing Figures 18 and 8, we can see that the separation regions near TE in Figure 18 are much smaller than those in Figure 8 when i ≤ 0° and the separation region near LE of the suction side in Figure 18 are also much smaller than that in Figure 8 when i = +10°.
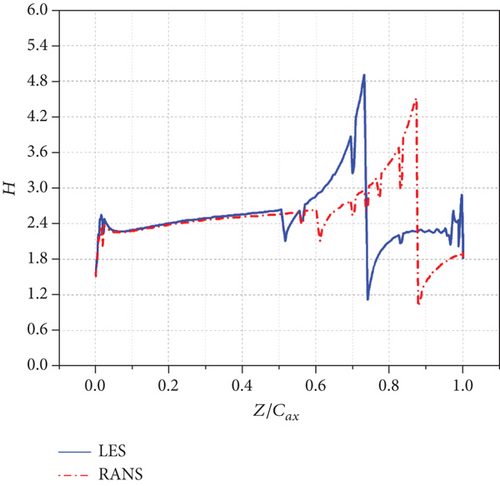
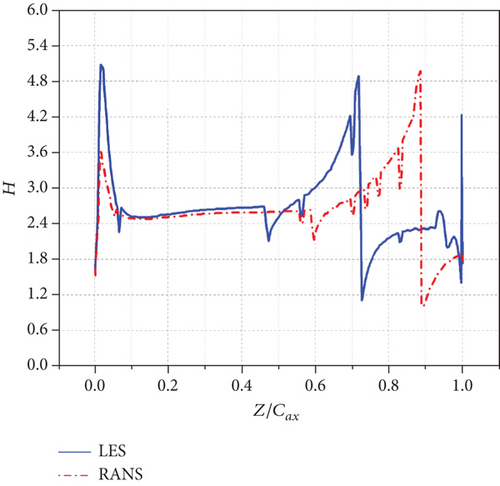
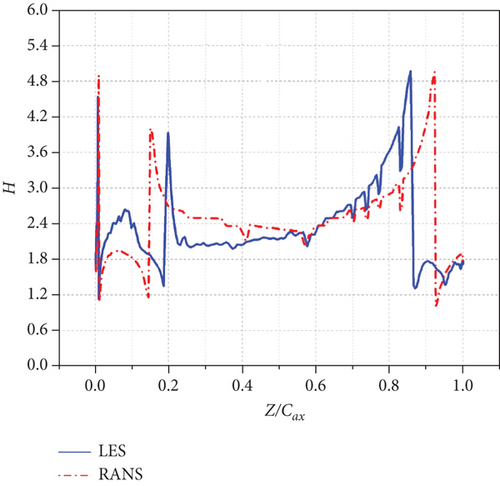
The shape factor comparison between LES and RANS on suction side is shown in Figure 19 to qualitatively assess the differences in the predictions of the separation regions between the two numerical methods. At i = −10°, the shape factor of RANS shows a boundary layer separation region from 87.4% Cax to TE, which is different from LES prediction of around 74% Cax to TE. Similarly, at i = 0°, the shape factor of RANS shows a boundary layer separation region from 88.6% Cax to TE, while LES predicts it to be from around 72.6% Cax to TE. At i = +10°, the shape factor of RANS shows a boundary layer separation region from LE to 15% Cax and from 92.3% Cax to TE, which is different from LES prediction of from LE to 20% Cax and from 86.6% Cax to TE.
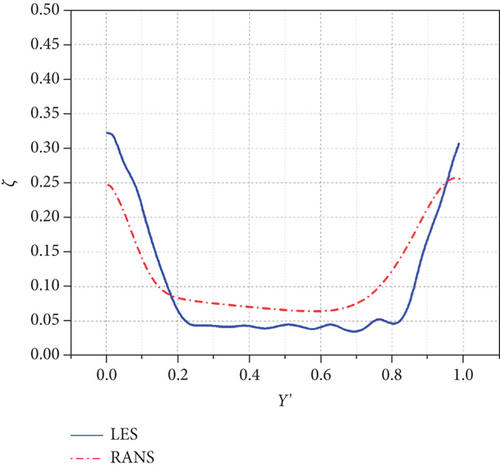
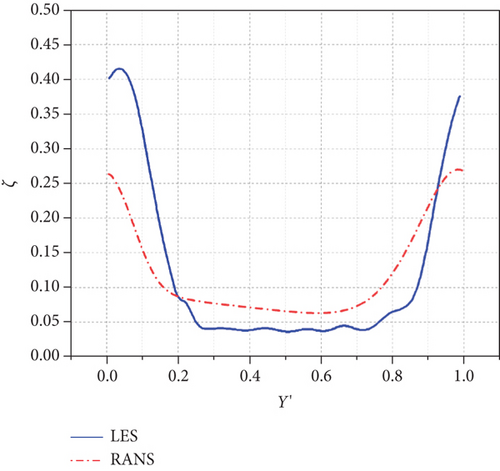
As shown in Figure 20, due to the underprediction of the boundary layer separation regions by RANS, the pitchwise maximum values of the total pressure loss coefficients at −10°, 0°, and +10° are around 0.26, 0.27, and 0.31, respectively.
5. Conclusion
This paper presents RANS and LES investigations of a LPT cascade under low Reynolds number condition (Re = 40,000) using OpenFOAM. The time-averaged flow characteristics and aerodynamic performances of the LPT cascade on midspan and near-wall regions are analyzed and compared for both positive and negative incidence angles. The study also explains the characteristics of the suction side boundary layer separation with respect to the incidence angle by analyzing the three-dimensional instantaneous flow field, which provides important data and reference for future experimental studies.
The results indicate that the blade loading and the TPG from the pressure side to the suction side of LE increase with increasing incidence angle. The LPT cascade exhibits separation and reattachment from LE to around 20% Cax on the suction surface at the incidence angle of +10°, which postpones the separation location from around 72.6% Cax to around 86.6% Cax and decreases the total pressure loss downstream of the TE.
Furthermore, a comparison is made between the RANS and LES simulations in our study. The results show that the RANS prediction of the blade boundary layer separation region is relatively inaccurate compared to LES under these conditions. The LES data presented in this paper can be served as sample sets for assisting the improvement of RANS models, which is the possible future work in the subsequent stages of study.
Nomenclature
-
- LPT
-
- low-pressure turbine
-
- OpenFOAM
-
- Open Source Field Operation and Manipulation
-
- RANS
-
- Reynolds-averaged Navier–Stokes
-
- LES
-
- large-eddy simulation
-
- i
-
- incidence angle
-
- LE
-
- leading edge
-
- TE
-
- trailing edge
-
- Cax
-
- axial chord
-
- ζ
-
- total pressure loss coefficient
-
- Cp
-
- pressure coefficient
-
- τws
-
- wall shear stress
-
- H
-
- shape factor
-
- APG
-
- adverse pressure gradient
-
- TPG
-
- transverse pressure gradient
-
- FPG
-
- favourable pressure gradient
-
- HV
-
- horseshoe vortex
-
- HVS
-
- suction side of horseshoe vortex
-
- HVP
-
- pressure side of horseshoe vortex
-
- PV
-
- passage vortex
-
- CSV
-
- concentrated shedding vortex
-
- TKE
-
- turbulent kinetic energy
Conflicts of Interest
The authors declare no conflicts of interest.
Funding
This work was supported by the National Natural Science Foundation of China (12372214) and supported by the BSS Project (PO_20220830_Low-Reynolds Cascade Test BUAA).
Acknowledgments
We would like to express our sincere gratitude to Julien Pavillet for his supportive guide to the project. This work is funded by National Natural Science Foundation of China (12372214) and supported by the BSS Project (PO_20220830_Low-Reynolds Cascade Test BUAA).
Open Research
Data Availability Statement
Data that support the findings of this study are available from the corresponding author upon reasonable request.


