Doping and Pressure Effects on Yttrium Hydrogen Selenide
Tuning and Enhancing Photochromic Behavior
Abstract
In this paper, the structural, electronic, phonon, and optical properties of lanthanum (La)-doped yttrium hydrogen selenide (YHSe), along with the effects of pressure variations on its optical properties, are investigated using the density functional theory method. Both the La-doped and YHSe systems are dynamically stable, as indicated by phonon calculations showing no imaginary frequencies in the Brillouin zone (BZ). The influence of pressure on optical properties is examined, revealing that increased pressure enhances these properties, particularly by improving the absorption coefficient in the ultraviolet (UV) range. Moreover, the bandgap energy of both La-doped YHSe and YHSe compounds is explored. Increasing La concentration reduces the bandgap and enhances the density of states (DOS) at Fermi energy, inducing metallic characteristics in YHSe. Furthermore, the optical properties are examined at various La concentrations, most of which exhibit a nonlinear relationship as the La concentration increases. Doping under extreme conditions significantly enhances the optical properties of La-doped YHSe, particularly in the UV-light wavelength range. Specifically, the absorption coefficient reaches its maximum value in the energy range of 6.678 −13.023 eV within the UV region for all concentrations, indicating strong absorption in this range. This suggests the material’s effectiveness in absorbing electromagnetic radiation, particularly in the UV range, making it a promising candidate for photochromic applications. A thorough exploration of the optical properties under doping reveals prominent peaks, particularly in response to the UV spectrum, with a slight shift toward higher energies beyond the UV range. This suggests that the material under study holds promise as a candidate for sustained photochromic performance over time.
1. Introduction
The development of materials with switchable optical properties has attracted significant attention in recent years due to their potential applications in various advanced technologies, including smart windows, optical switches, modulators, and sensors [1]. Among the various materials investigated for this purpose, yttrium and lanthanum (La)-based hydrides have emerged as promising candidates due to their unique ability to undergo a metal-to-insulator transition upon hydrogen absorption and desorption. This transition results in a significant modulation of their optical properties, such as reflectance, transmittance and absorption spectra, and refractive index, making them suitable for switchable optical devices [2].
Yttrium hydride (YHx) and La hydride (LaHx) are particularly interesting due to the complex electronic structure of the yttrium and La atoms, which can be altered by varying the hydrogen concentration or by applying external stimuli such as temperature, pressure, or electrical fields [2]. The metal-to-insulator transition in these materials is accompanied by a change in the band structure, which affects their optical properties and enables the tuning of their performance for specific applications. Smart windows made from chromogenic materials have recently emerged as viable contenders for the next generation of energy-efficient windows [2]. Photochromic compounds are a type of chromogenic material that can change their optical properties reversibly when exposed to light, making them suitable for creating windows with dynamic solar control properties [3]. Photochromic compounds come in both organic and inorganic forms [4], with some inorganic examples being titanium oxide, tungsten oxide, molybdenum oxide, and YHx [5, 6]. The discovery of photochromic characteristics in YHx resulted from increased scientific activity [7]. This followed the finding of switchable optical characteristics in yttrium and La-based hydrides [8]. Initially, photochromic in YHx was only detected at high hydrogen pressures (over 5 GPa) [9], but by adding oxygen into the material, Mongstad et al. [5] Subsequently demonstrated that photochromic characteristics could be obtained at ambient settings.
To date, different types of inorganic photochromic materials have been developed including robust oxides BaMgSiO4, Na8 (AlSiO4)6Cl2, Y3Al2Ga3O12, KSr2Nb5O15, (K, Na)NbO3 and Bi2.5Na0.5Nb2O9 [10], rare earth-doped compounds (CaF2:Ce, CaF2:La and CaF2:Sm, Eu) [11] transition metal oxides (WO3, TiO2, V2O5, Nb2O5 and MoO3) [12] and metal halides (AgCl, CuCl) [13]. Research in these materials mainly focuses on further improving their performance, understanding the mechanism of photochromic as well as exploring new applications. Photochromic materials can respond to a broad or a narrow wavelength spectrum in the range of visible light to ultraviolet (UV) and even ionizing radiation [14]. Consequently, oxygen-containing YHx films exhibit photochromic behavior, meaning their optical properties can change reversibly when exposed to light of sufficient energy in the blue or UV wavelength range [15, 16]. In most photochromic materials, UV radiation is absorbed by state A (at hc/λA) in the absorbing wavelength range ideally, at the maximal molar extinction coefficient (eA), thereby causing a change to state B. The return from state B to state A can be realized via irradiation-induced excitation at a new wavelength (λB). The A and B states are energetically separated by a potential energy barrier [17]. The switchable optical properties of yttrium and La-based hydrides have been investigated using various experimental and theoretical techniques to understand the underlying mechanisms and to optimize their performance for practical applications [18]. However, there are still challenges that need to be addressed, such as the stability of these materials under operating conditions, the efficiency and response time of the switchable optical devices, and the development of cost-effective, switching speed, durability, and sensitivity. To optimize the performance of this device, we propose integrating La with yttrium-based hydride, specifically yttrium hydrogen selenide (YHSe), to examine the optical properties of the YHSe compound. The investigation of both doping and pressure effects on YHSe to enhance and modulate its photochromic behavior, which has not been extensively explored in previous studies. While photochromic materials have a wide range of applications in smart windows, optical devices, and data storage, the effect of chemical modifications and external pressure on their properties remains a relatively underdeveloped area. This research introduces La doping and pressure variation as means to tailor the electronic structure and optical properties in YHSe, thus offering new pathways for optimizing its performance for these applications. While significant progress has been made in the study of photochromic materials, particularly in the areas of doping and external stimuli like the impact of pressure variation and specific doping elements on the optical and electronic properties of materials like YHSe, it remains underexplored. Most studies on photochromic materials have focused on organic molecules, perovskite, YHx, and transition metal oxides, leaving a gap in understanding how external modifications can enhance the photochromic behavior of less-studied compounds such as YHSe.
Furthermore, while doping strategies have been widely applied to modulate electronic and optical properties, the specific role of La doping in YHSe has not been extensively studied, particularly in combination with pressure effects. There is a lack of research that systematically explores how these two factors, doping and pressure, can work synergistically to enhance photochromic behavior, electronic structure, and phase transitions.
Therefore, the primary aim of this research is to investigate the effects of pressure-induced alterations on the optical properties of the pure YHSe system, particularly concerning its applicability in photochromic applications. Furthermore, we aim to enhance the functionality of a photochromic device by incorporating La into YHSe, as previously explored experimentally, in YHx. This paper delves into the intricate effects of La doping under fixed extreme pressure conditions (200 GPa), thoroughly examining the structural, electronic, phonon, and optical properties of the La-doped YHSe compound. Additionally, it explores the impact of pressure variations on the optical properties of pure YHSe. We employ both density functional theories (DFTs) and time-dependent density functional theory (TDDFT) to provide a comprehensive understanding.
2. Computational Details and Theoretical Background
2.1. Theoretical Background
This section is dedicated to the mathematical relations used to calculate the optical properties of YHSe and La-doped YHSe compounds in this study. The Kramers–Kronig dispersion relations are a key tool for studying light-matter interactions in transparent materials, gases, molecules, and liquids [19].
2.2. Computational Details
The investigation conducted in this research utilizes the Quantum Espresso software suite [23] to explore the structural, electronic, phonon, and optical properties of LaxY1−xHSe at different La concentrations, specifically x = 0, 0.125, 0.25, 0.375, 0.5 and 0.625. Additionally, the study examined the optical properties of pure YHSe under various pressure conditions. The study uses the norm-conserving pseudo-potentials (NCPP) of the generalized gradient approximation (GGA) Perdew–Burke–Ernzerhof (PBE) functional type [24]. We used DFT to compute the electronic ground state of the investigated system and TDDFT [25] to obtain the optical properties of pure and La-doped YHSe. A supercell with dimensions 2 × 2 × 2 was constructed using VESTA software, where La was substituted for Y at different concentrations and used for the computations. To provide more precise results while assessing La doping in the hexagonal structures of YHSe, a plane wave basis set with an energy cutoff of 100 Ry has been employed. Reciprocal space integration was carried out using k-point sampling, with sets of special points generated from the conventional k-points technique established by Monk-Horst and Pack [26]. The optimization procedure utilized the following parameters: a self-consistent field tolerance of 2.4 × 10⁻⁷ eV/atom for each atom in the structure and a maximum force of 10−5 eV/Å. A mesh of 12 × 12 × 12 k-points was used to enhance accuracy after a convergence test for electronic BZ integration within the hexagonal structures of YHSe. For the partial density of states (PDOS) investigation, a denser grid of 24 × 24 × 24 k-points was employed. The Broyden–Fletcher–Goldfarb–Shanno (BFGS) algorithm is used to automatically relax the internal coordinates of the structure to achieve its least total energy. A dense mesh of evenly distributed 350 and 500 k-points was used in the irreducible section of the zone to execute the Brillion zone integration for optical properties computation.
3. Results and Discussion
3.1. Optical Properties of YHSe
The behavior of a material in the presence of electromagnetic radiation is explained by its optical characteristics. An analysis of these characteristics has been conducted to clarify the impact of pressure on YHSe and to gain a deeper understanding of the material’s properties. The optical properties are especially important for semiconductor materials [27], as in the case of YHSe.
3.1.1. Dielectric Function, ε(ω)
The complex dielectric function, denoted as ε(ω), is a fundamental parameter used to describe the behavior of materials in response to electromagnetic fields across a range of frequencies (ω). It is the most fundamental optical parameter from which other optical properties can be derived [28, 29]. The complex dielectric function ε(ω) = ε1(ω) + iε2(ω) are employed to explore the optical properties of YHSe. Where ε1 is the real part of the dielectric functions and ε2 is the imaginary part of the dielectric function. The real part describes how light disperses and polarizes, while the imaginary component explains the compound’s absorptive behavior and energy dissipation within the medium [29]. The calculated complex dielectric function of YHSe at different pressures is shown in Figure 1a,b. The calculated imaginary part of the dielectric function for YHSe, resulting from interband optical transitions at seven different pressures, is displayed (0, 10, 20, 30, 40, 50, 60, and 70 GPa). Figure 1a shows the imaginary part of the dielectric function, which represents the dissipation of energy within the medium or loss factor and provides insights into its optical properties. The peaks in ε2 correspond to interband electronic transitions, where photons are absorbed by exciting electrons from the valence band to the conduction band. The key observation from Figure 1a is that, as pressure increases, the peaks in shift toward lower photon energies. This redshift suggests a narrowing of the bandgap under increasing pressure. The reduction in the bandgap can be attributed to the pressure-induced compression of the lattice, which alters the electronic structure by reducing the energy separation between the valence and conduction bands in YHSe [30]. Additionally, a slight increase in peak intensity with pressure is observed, indicating enhanced absorption at these lower photon energies. In Figure 1a, at lower photon energies, the curves show a significant rise with increasing pressure, indicating stronger absorption and electronic transitions. As pressure increases, the material’s ability to absorb light intensifies. The peaks, which occur primarily between 3 and 7 eV, gradually shift towards lower photon energies with higher pressure, suggesting that pressure causes a reduction in the bandgap. This shift indicates pressure-induced modifications in the electronic band structure and enhanced optical transitions at lower photon energies. In general, it is evident from these data that as pressure increases, there is a corresponding shift in the photon energy associated with the peak in the imaginary dielectric function. The peak shifts towards lower photon energies with increasing pressure, moving into the infrared region of the spectrum. This observation is consistent with previous studies on related systems [31].
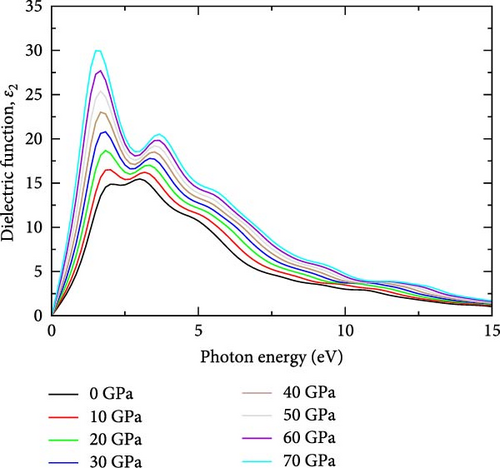
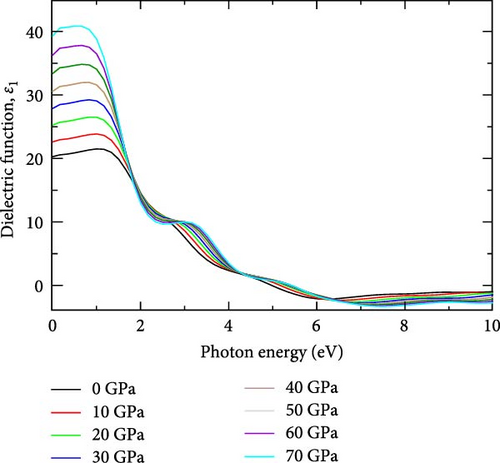
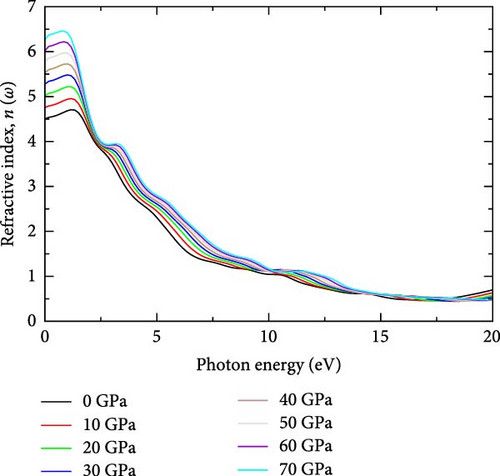
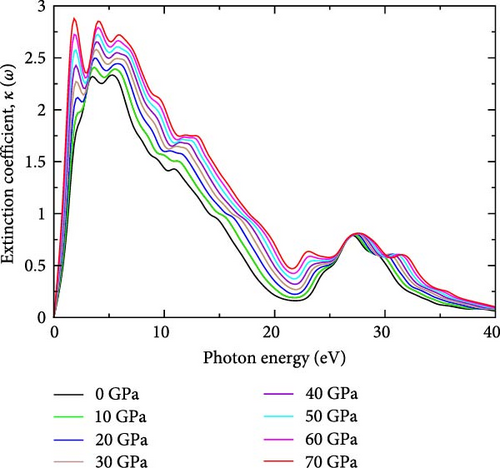
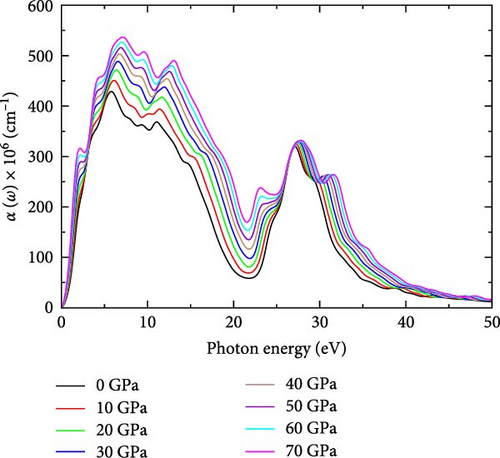
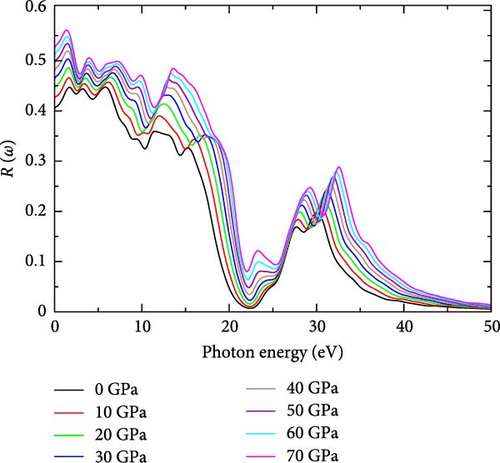
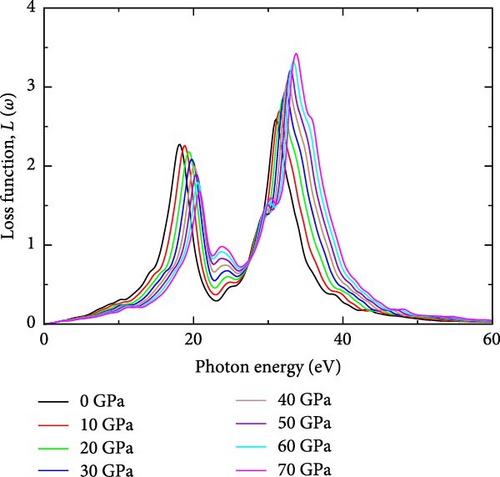
Figure 1b shows the real part of the dielectric function ε1(ω), which represents the material’s ability to polarize in response to an external electric field [32]. At ambient conditions, the real part of the dielectric function exhibits a peak of 21.51 at a photon energy of 1.0026 eV in the infrared region. As pressure increases to 10 GPa, this peak rises to 23.86, maintaining the same photon energy of 1.0026 eV, suggesting a stable optical response despite pressure changes. At 20 GPa, the peak increases to 26.51 but shifts to a lower photon energy of 0.84 eV, indicating modified optical properties under higher pressure. Further increases in pressure to 30 GPa show a peak of 29.25 at the same photon energy observed at 20 GPa. This trend continues at higher pressures, with peaks strengthening and reaching a maximum of 40.84 at 70 GPa, with sharp peaks spanning the spectrum range between 1.0026 eV (at 0 GPa) and 0.50 eV (at 70 GPa). In Figure 1b, the real part of the dielectric function is higher at lower photon energies and decreases as photon energy increases, which aligns with the findings of Alouani and Wills [33] regarding the calculated optical properties of Si, Ge, and GaAs semiconductors under hydrostatic pressure [29]. A noticeable peak is observed between 1 and 3 eV across all pressures, with the height of the peak increasing as pressure rises. This behavior suggests increased optical polarizability and stronger light-matter interactions under pressure. The tail end of the curves flattens out as photon energy exceeds 7 eV, indicating that higher energy photons have less interaction with the material, regardless of the pressure, which aligns with previous findings by Alouani and Wills [33] in the calculated optical properties of Si, Ge, and GaAs semiconductors under hydrostatic pressure [33]. The peak shifts toward lower photon energies as pressure increases, corresponding to the infrared region of the spectrum. This suggests that, with increasing pressure, the material’s electronic structure is compressed, leading to increasing polarizability and more significant light-matter interactions, which enhance the real part of the dielectric function. Additionally, the reduction in the bandgap with increasing pressure [30] allows for electronic transitions at lower photon energies in YHSe. This shift in the bandgap causes the peak of the dielectric function to move toward the infrared region of the spectrum, where lower-energy photons dominate, which is aligned with previous work [34]. Consequently, the material’s optical response is enhanced in the infrared range as pressure increases, reflecting both a stronger dielectric response and a shift in optical transitions to lower photon energies. The real part of frequency dependent on the dielectric function of YHSe presents significant results, where at 0 eV, it possesses a dielectric coefficient value at each pressure, which is called static dielectric constant ε1(0). Static dielectric constant ε1(0) in low energy limit strongly depends on the bandgap value of the material [32]. The static dielectric constant, ε1(0) for YHSe was calculated to be 20.27 (0 GPa), 22.61 (10 GPa), 25.22 (20 GPa), 27.86 (30 GPa), 30.55 (40 GPa), 33.33 (50 GPa), 36.23 (60 GPa), and 39.24 (70 GPa) for each respective pressure. The calculated values of all sharp peaks for real and imaginary parts of the dielectric function are listed with corresponding pressures in Table 1 in the spectrum range of 3 eV (0 GPa) to 1.5 eV (70 GPa).
| P (GPa) | α(ω) × 108 (cm−1) | ε1 | ε2 | n(ω) | k(ω) | R(ω) | L(ω) |
|---|---|---|---|---|---|---|---|
| 0.0 | 4.28 | 21.51 | 15.46 | 4.71 | 2.33 | 0.45 | 2.59 |
| 10 | 4.50 | 23.86 | 16.51 | 4.955 | 2.39 | 0.46 | 2.70 |
| 20 | 4.72 | 26.51 | 18.68 | 5.22 | 2.49 | 0.49 | 2.85 |
| 30 | 4.89 | 29.14 | 20.80 | 5.48 | 2.58 | 0.50 | 2.95 |
| 40 | 5.03 | 31.98 | 23.04 | 5.72 | 2.65 | 0.52 | 3.08 |
| 50 | 5.16 | 34.82 | 25.38 | 5.97 | 2.61 | 0.53 | 3.21 |
| 60 | 5.27 | 37.81 | 27.70 | 6.22 | 2.79 | 0.55 | 3.33 |
| 70 | 5.37 | 40.84 | 29.97 | 6.46 | 2.88 | 0.56 | 3.42 |
3.1.2. Refractive Index, n(ω)
This property is fundamental in optics as it determines how light behaves when passing through the material [35]. The refractive index consists of two parts: the real part, which describes the phase velocity of light, and the imaginary part, which accounts for the absorption of light within the material [36]. Figure 1c illustrates the real part refractive index of YHSe under various pressures investigated in this study. The peak real part of the refractive index of YHSe is found to be 4.7 at a photon energy of 1.17 eV under ambient pressure. The refractive index steadily increases with rising pressure, reaching a maximum value of 6.45 at 70 GPa, while photon energies range from 0.84 to 1.17 eV. Based on the current results, the refractive index decreases across the photon energy range from 0 to 10 eV, starting with a high refractive index in the low energy region. As pressure increases, the refractive index consistently raises for low-energy photons, reflecting an increase in the material’s optical density and polarizability under pressure. Our findings are consistent with earlier studies on different systems by Pan, Wan, and Galli [37]. At higher photon energies above 8 eV, the refractive index stabilizes, and pressure has a less pronounced effect, suggesting that the interaction between high-energy photons and the material becomes weaker as energy increases. This indicates that as pressure increases, the material became more optically dense, causing light to slow down even more as it passed through YHSe at low-energy photons. From this finding, the increase in refractive index with pressure is due to the material becoming denser, changes in its electronic structure, polarizability, and increased optical confinement. These factors cause light to slow down more when passing through YHSe, resulting in a higher refractive index as pressure rises. Therefore, YHSe increased refractive index under pressure makes it suitable for use in optical devices designed for high-pressure environments. This includes high-pressure sensors or optical devices used in deep-sea or high-altitude applications where pressure changes are significant [38]. The main peak values of the refractive index at different pressures, as determined in this investigation, are presented in Table 1.
3.1.3. Extinction Coefficients, κ(ω)
The extinction coefficient at different pressures in YHSe provides valuable insights into the material’s optical properties. The imaginary part of the refractive index is also called the extinction coefficient, which indicates the amount of absorption energy loss of the electromagnetic waves when propagate throughout the material [32]. Figure 1d illustrates the extinction coefficients of the YHSe at different pressures investigated in this study. From these findings, it is evident that as pressure increases, the photon energy associated with the peak in the extinction coefficient shifts accordingly. The trend observed in this investigation indicates that the extinction coefficient increases with pressure at lower photon energies. Our findings are consistent with earlier studies on other systems conducted by Pan, Wan, and Galli [37]. Moreover, the extinction coefficient exhibits a similar pattern to the imaginary part of the dielectric function, with peaks appearing between 5 and 15 eV. As pressure increases, the peaks in the extinction coefficient shift toward lower photon energies, indicating stronger absorption and energy loss at lower photon energies under pressure. The shift in the photon energy of the extinction coefficient peaks with increasing pressure is primarily due to changes in the electronic band structure and the density of states (DOS) in the YHSe system [30]. Between photon energies of 10 and 25 eV, the extinction coefficient shows a decreasing trend with increasing pressure, suggesting that the material becomes less absorptive or experiences less energy loss as it propagates throughout the material at mid-range photon energies under high-pressure conditions. In this energy range, the peak values are lower at higher pressures, indicating less pronounced absorption or energy loss. At higher photon energies, between 25 and 40 eV, the extinction coefficient curves for all pressures converge. This implies that pressure has a smaller effect on energy loss due to absorption in this range, and the material’s absorption characteristics become less dependent on pressure at higher photon energies. Extinction coefficients at different pressures (0–70 GPa) are noted as the main peak values in Table 1 for the YHSe investigation.
3.1.4. Reflectivity, R(ω)
Reflectivity indicates how well a material’s surface interacts with electromagnetic radiation [39]. This is illustrated in Figure 1f, which shows the effect of pressure on the reflectivity of YHSe. The results depicted in Figure 1f support the current study’s observation of a significant increase in reflectance with increasing pressure at lower photon energies. Based on the present findings, reflectivity generally rises with pressure across this photon energy range. This suggests that the material’s surface becomes more reflective under pressure, likely due to enhanced electronic interactions and polarizability, which lead to increased light reflection. Beyond 7 eV, a sharp decline in reflectivity is observed, indicating that less light is reflected at higher photon energies. However, reflectivity then increases slightly before displaying a complex pattern of peaks and troughs. Peaks around 20 eV show a dependence on pressure, with higher pressures (70 GPa) resulting in more pronounced reflectivity peaks. These peaks suggest regions of strong optical reflection that arise from specific electronic transitions within the material. At very high photon energies above 40 eV, reflectivity decreases significantly for all pressures. This indicates that the material becomes more transparent at these higher photon energies as its ability to reflect light diminishes. Crucially, our findings support earlier studies on different systems by Ahmad et al. [36] and Hussain et al. [39]. Table 1 provides a detailed summary of the highest peaks corresponding to different pressure levels and shows how reflectivity changes with pressure.
3.1.5. Absorption Coefficient, α(ω)
The absorption coefficient can be used to calculate the depth to which electromagnetic radiation penetrates a given material [40]. Figure 1e illustrates the absorption coefficient of YHSe at different pressures investigated in this study. The analysis reveals significant peaks in the absorption coefficient across all pressures, ranging from 0 to 70 GPa. The absorption coefficient increases sharply at low photon energies and peaks around 6 eV for all pressures, indicating strong photon absorption due to electronic transitions. As pressure increases, the absorption coefficient rises, particularly in the region between 0 and 10 eV. This suggests enhanced photon absorption under pressure, correlating with increased optical density and bandgap reduction. Our finding aligns with previous research by Ahmad et al. [36], which investigated the effect of external isotropic pressure on the widening of the bandgap, as well as the mechanical, thermodynamic, and optical properties of rubidium niobate, using first-principles calculations for photocatalytic applications. Peaks in absorption around 20 eV become more prominent at higher pressures, suggesting strong optical activity in this region due to pressure-induced electronic transitions. The absorption coefficient displays a strong peak near 30 eV, followed by a decline as photon energy increases. The peak becomes more pronounced under higher pressures, which indicates a stronger absorption response at these higher photon energies. Beyond 30 eV, absorption decreases across the spectrum for all pressures, indicating that the material becomes less absorptive at higher photon energies. As photon energy exceeds 40 eV, the material becomes more transparent. This finding is consistent with previous research on other systems, as noted in earlier studies [27]. The observed trend of increasing absorption coefficient with increasing pressure suggests a strong correlation between pressure variations and the optical properties of the material under investigation. Moreover, the peak absorption coefficient shifts to higher photon energies in the UV region as pressure increases. This pivotal observation underscores the dynamic tuning potential of photochromic materials under pressure modulation. Furthermore, the absorption coefficient drops sharply in the high-energy region, which is a typical property of semiconductors [41]. This finding suggests that the absorption coefficient effectively captures electromagnetic radiation, particularly in the UV range, along with other favorable criteria, making the material a promising candidate for photochromic technological applications. This result is consistent with previous studies by Dmitrii Moldarev on the composition of photochromic oxygen-containing YHx [42]. Table 1 illustrates the values of the sharp absorption coefficient peaks under the effect of pressure.
3.1.6. Energy Loss Function, L(ω)
The loss function is crucial for quantifying the energy dissipation of high-speed electrons within a material [39]. Figure 1g illustrates the energy loss function of YHSe under different pressures as investigated in this study. In the photon energy range from 0 to ~15 eV, the loss function remains relatively low across all pressures, indicating minimal energy loss in this range. This suggests that plasmonic excitations and other electronic interactions are less prominent at lower photon energies. The loss function starts to increase slightly as photon energy approaches 15 eV, signaling the onset of electronic excitations that contribute to energy loss. A prominent peak appears around 30 eV, corresponding to a strong plasmonic resonance where significant energy loss occurs due to collective electron oscillations in the YHSe material. As pressure increases, the intensity of this peak generally rises, and there is a subtle shift in the peak position toward higher photon energies. This observation aligns with previous work by Ahmad et al. [36] on the effects of external isotropic pressure on the widening of the bandgap, as well as the mechanical, thermodynamic, and optical properties of rubidium niobate, investigated using first-principles calculations for photocatalytic applications. This behavior indicates that under compression, the material becomes more responsive to plasmonic excitations in this energy range, with the peak shifting due to changes in the band structure and electronic density [30]. Additionally, Figure 1e shows that the absorption coefficient reaches its minimum value where the energy loss function is at its maximum, indicating that a higher loss function corresponds to a lower absorption coefficient. Moreover, in this investigation, a larger value of the imaginary part of the dielectric function ε2(ω), is associated with the lowest value of the energy loss function, which is a crucial characteristic of semiconductors. This observation aligns with previous work by Ahmad et al. [36]. The main peaks of the loss function at each pressure in this investigation are recorded in Table 1.
3.2. Doping Effects on the Properties of YHSe
3.2.1. Structural Properties
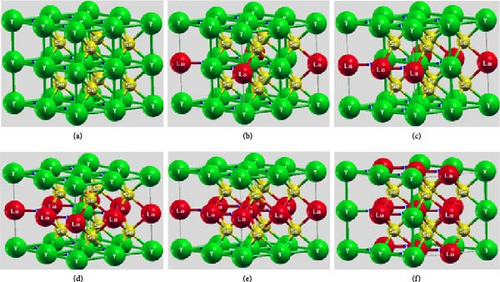
The optimized unit-cell parameters of the hexagonal crystal structure of YHSe at a fixed pressure are a = b = 3.07 Å, c = 3.20 Å, and V = 30.2 Å3. Subsequently, the optimized structural parameters of LaxY1−x HSe (x = 0, 0.125, 0.25, 0.375, 0.5, and 0.625) are calculated for each concentration, providing valuable insights into the structural modifications induced by La doping. Figure 2 shows the optimized crystal structures of (a) YHSe, (b) at x = 0.125, (c) at x = 0.25, (d) at x = 0.375, (e) at x = 0.5, and (f) at x = 0.625 La concentration. As a relaxed parameter, the lattice parameters for YHSe with La dopants are optimized while fixing the pressure at 200 GPa. At a La concentration of 0.125, the optimized lattice parameters are a = b = 6.17 Å, c = 6.45 Å, and V = 245.5 Å3; at x = 0.25, a = b = 6.28 Å, c = 6.51 Å, and V = 256.36 Å3; at x = 0.375, a = b = 6.18 Å, c = 6.63 Å, and V = 252.9 Å3; at x = 0.5, a = b = 6.13 Å, c = 6.79 Å, and V = 255.1 Å3; finally, at x = 0.625, a = b = 6.18 Å, c = 6.8 Å, and V = 259.5 Å3. The lattice parameter c increases from 6.45 to 6.80 Å as the La concentration rises from 0.125 to 0.625. These data show that the ratio of c/a increases with increasing La concentration. The increase in lattice parameters suggests that the introduction of La atoms, which are larger than yttrium atoms, induces a slight expansion of the unit cell. This expansion, particularly along the c-axis, correlates with increased atomic spacing. The increase in the c/a ratio upon La doping likely influences the crystal’s anisotropy, which can affect its mechanical behavior. A higher c/a ratio typically implies that the material may exhibit different responses to stress along the c-axis compared to the a–b plane. This anisotropy could result in direction-dependent mechanical properties, such as tensile strength or shear resistance, which may be advantageous for designing materials for specific structural applications. Additionally, the expansion of the lattice could impact the material’s thermal properties, particularly its thermal conductivity. As the lattice expands, increased phonon scattering due to larger atomic spacing could potentially lead to reduced thermal conductivity [43]. This behavior could be advantageous for applications requiring thermal insulation or materials that perform well under high-temperature conditions. Conversely, it might limit applications where high thermal conductivity is desired, such as in heat dissipation systems. The material’s ability to accommodate such structural modifications without losing stability suggests its suitability for tunable applications. These findings suggest that the increasing c/a ratio and its associated anisotropy could be leveraged to design materials with direction-specific mechanical or optical properties, which are desirable for advanced technologies such as optoelectronics and anisotropic superconductors in La-doped YHSe.
3.2.2. Band Structure
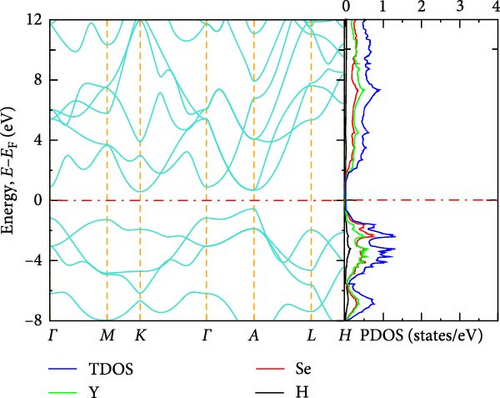
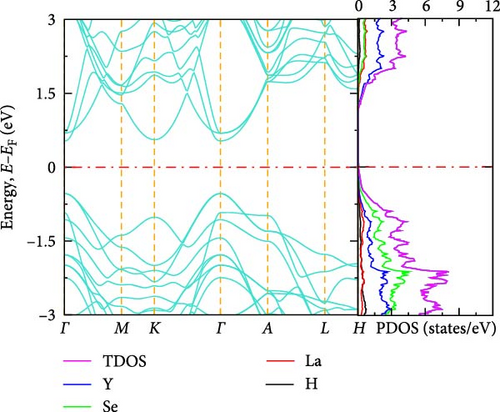
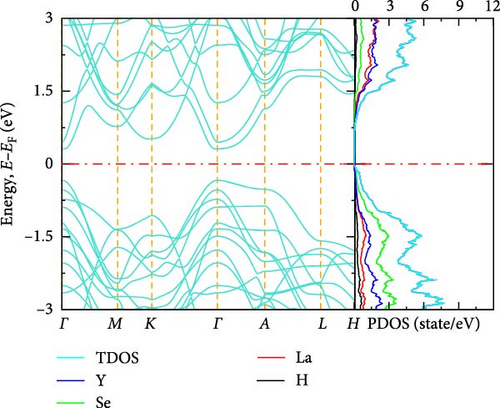
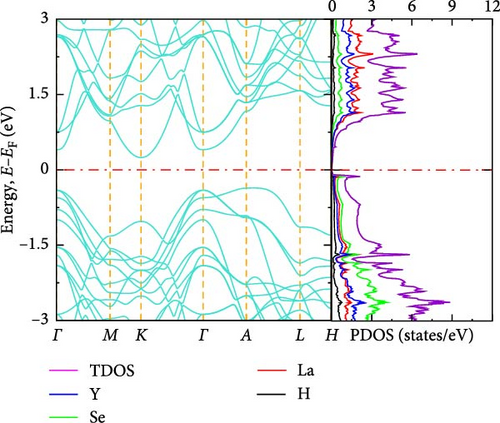
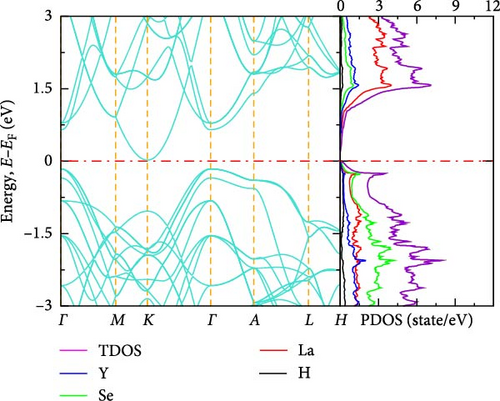
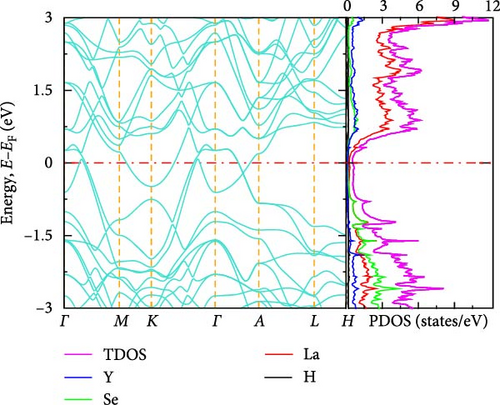
The electronic band structure and DOS characteristics of a material provide insight into its electronic response [41]. Figure 3a–f displays the computed electronic band structures of both pure and La-doped YHSe along high-symmetry directions. Our findings, as illustrated in these figures, focus on the electronic band structure of YHSe and La-doped YHSe materials, with particular emphasis on the behavior of the valence and conduction bands. Figure 3a shows that the maximum of the valence band occurs at the high-symmetry A-point, while the minimum of the conduction band is at the Γ-point, indicating an indirect bandgap. In contrast, Figure 3b reveals that both the maximum valence band and the minimum conduction band occur at the same wave vector. This suggests that doping La into YHSe changes the nature of the band transition from an indirect to a direct semiconductor, resulting in a narrowing of the bandgap. Specifically, the energy difference, often referred to as the bandgap energy, is calculated to be 1.16 eV at a La concentration of x = 0.125. This energy represents the minimum energy required to excite an electron from the valence band to the conduction band. Our results show that for a La concentration of x = 0.25, the bandgap is 0.57 eV, which decreases to 0.54 eV at x = 0.375. At x = 0.5, the bandgap drops further to 0.25 eV. Finally, at x = 0.625, the conduction and valence bands overlap. This indicates that the concentration of La has a significant effect on the material’s energy bandgap. Furthermore, at all La concentrations, the bandgap at the Γ-point is direct, and its value decreases as the La concentration increases. Unlike an indirect bandgap, where the band edges (valence band maximum and conduction band minimum) occur at different momentum values, a direct bandgap has its band edges aligned in both energy and momentum. Thus, during optical excitations, an electron can make a direct transition to the conduction band without a change in momentum. This study examines the transition from an indirect bandgap to a direct bandgap in La-doped YHSe. This behavior is particularly significant for optoelectronic applications, such as light-emitting diodes (LEDs) and other optoelectronic devices [44]. The transition from an indirect to a direct bandgap is crucial because direct bandgap semiconductors typically exhibit stronger optical absorption and emission, which are advantageous for light-emitting devices and laser technologies. Compared to other direct bandgap semiconductors, such as GaAs or CdTe, La-doped YHSe offers tunable optical properties with varying doping concentrations, allowing for a tailored response across a broad range of the electromagnetic spectrum. These tunable properties could be advantageous in applications requiring precise control of the optical response. Doping La at the Y site in YHSe alters the electronic band structure, as illustrated in Figure 3b–e. In this structure, both the top of the valence band and the minimum of the conduction band are situated at the Γ-point. When a heavier element with a higher atomic number is doped at the A cation site, the minimum of the conduction band shifts to lower energies, while the maximum of the valence band shifts to higher energies [34]. According to Figure 3b–f, as the concentration of the heavier La element increases from 0.125 to 0.625, the maximum of the valence band shifts to higher energies, and the minimum of the conduction band shifts to lower energies. This shift is notably observed at the K and Γ points, leading to the overlapping of the two bands at a La concentration of 0.625. At all La concentrations, the maximum of the valence band and the minimum of the conduction band are generally aligned and located at the Γ point. Furthermore, doping YHSe with the heavier La element reduces the bandgap, leading to a transition from a semiconducting to a metallic nature.
3.2.3. DOS
In transitioning from the analysis of the band structure to the examination of the DOS, it is crucial to understand the availability of states at each energy level. Figure 3a shows the PDOS for pure YHSe, while Figure 3b–f depicts the PDOS after La doping at a fixed pressure. From Figure 3a, it is evident that Y atoms contribute more to the total DOS than Se and H atoms in the conduction band. Conversely, Se atoms contribute more to the total DOS in the valence band compared to Y and H atoms. Additionally, there is a noticeable overlap between Y and Se atoms in the valence band, leading to hybridization within a certain energy range. In Figure 3b, the total DOS includes contributions from Y, La, Se, and H. Similar to previous observations, the total DOS increases as the La concentration rises from 0 to 0.125. At this lower concentration, La contributes less to the electronic DOS in both the valence and conduction bands compared to Y and Se. However, as the La concentration increases, as shown in Figure 3b–f, La contribution to the electronic DOS becomes more significant in both bands. This results in an enhanced total electronic DOS near the Fermi energy in both the conduction and valence bands. At La concentrations beyond x = 0.25, La increasingly contributes to the total electronic DOS in the conduction band, thereby raising the total electronic DOS near the Fermi energy. As illustrated in Figure 3a–e, the total DOS at the Fermi energy remains zero for La concentrations ranging from 0 to 0.5, indicating a semiconducting nature, as previously studied theoretically using DFT for YHSe by Tadesse et al. [30]. However, with a further increase in La concentration, as shown in Figure 3f, La contributes even more to the total electronic DOS, exhibiting a nonzero value at the Fermi energy. This indicates metallic characteristics at a La concentration of x = 0.625, consistent with the overlap of the conduction and valence bands in the band structure at this concentration. The calculated total DOS at the Fermi energy, N (EF), is 0.54 states/eV for x = 0.625. This increase is primarily due to the La element contributing 0.27 states/eV to the electronic DOS at the Fermi energy. The inclusion of La facilitates the transition of YHSe from semiconductor-like behavior to a more metallic nature. This finding is aligned with previous work on the electronic structures and optical properties of γ-Si3N4 doped with La, studied using first-principles calculations by Ding et al. [45]. Furthermore, at higher La concentrations beyond x = 0.25, the increased contribution of La to the DOS, particularly in the conduction band, results in a narrowing of the bandgap. As the bandgap narrows, the material becomes more conductive, leading to a transition from a semiconductor to a metal-like conductor at a La concentration of x = 0.625. The nonzero DOS at the Fermi energy indicates that electronic conduction will be significantly enhanced due to the increased availability of states for electron movement.
3.2.4. Vibrational Analysis
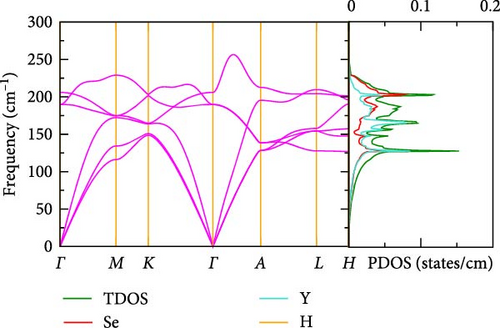
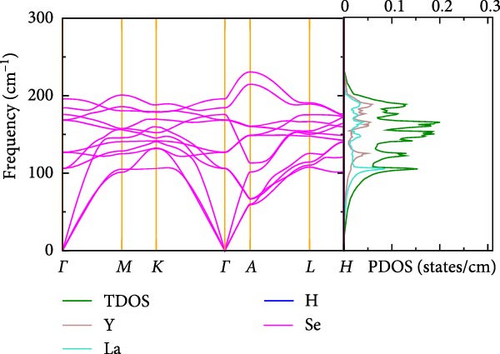
The phonon dispersions and projected phonon densities of states for La-doped and pure YHSe are shown in Figure 4a,b at various La concentrations. The absence of any imaginary frequencies within the BZ confirms the dynamic stability of both the La-doped and pure YHSe systems. Our results demonstrate that La-doped YHSe is dynamically stable across all concentrations, as depicted in Figure 4a,b. The phonon dispersion curves ω(q) in Figure 4a,b illustrate the relationship between phonon frequency and wave vector, providing insights into the material’s vibrational behavior across different momentum states. The absence of imaginary modes suggests that the material is stable, with no structural instabilities present. The phonon DOS F (ω) in Figure 4a,b, at concentrations x = 0 and x = 0.5, illustrates the distribution of phonon frequencies within the La-doped YHSe material. This provides a comprehensive view of its vibrational spectrum and reveals how La doping alters the vibrational modes. The distinctive structure observed in the phonon spectrum, as highlighted in Figure 4a,b, results from the varying atomic masses of La, Y, Se, and H within the material. The phonon DOS of La-doped YHSe reveals that low-frequency vibrations are predominantly dominated by the heavier La atoms, followed by Y atoms. In contrast, the lighter Se and H atoms contribute significantly to the high-frequency modes. This variation creates four distinct regions in the partial phonon DOS F (ω), each predominantly influenced by the vibrations of specific atomic species mass [30]. As shown in Figure 4a,b, the total phonon density of states (TDOS) slightly increases in the La-doped system (x = 0.5) compared to pure YHSe. This suggests that La doping introduces additional vibrational states, as indicated by the higher TDOS values for the doped system. The inclusion of La leads to more defined and separated phonon density regions, representing an increase in vibrational modes. Furthermore, the introduction of La results in the formation of a new low-frequency region dominated by La vibrations, while the Y and Se contributions shift slightly toward higher frequencies compared to pure YHSe. Notably, in the La-doped YHSe (x = 0.5), the longitudinal acoustic phonon branch shifts to lower frequencies compared to the pure YHSe (x = 0). In addition to the acoustic modes, the optical phonon modes in the La-doped YHSe occupy the higher frequency range. However, there is a noticeable difference in the dispersion of these optical modes compared to the pure YHSe system. Both systems exhibit a strong influence of Yttrium and La atoms on these modes, as heavier atoms tend to dominate the low-frequency regions. Specifically, in the La-doped system, the frequency of the acoustic branches near the Γ-point is reduced compared to the pure system, and this reduction is particularly prominent in the longitudinal acoustic mode. This observation suggests weakened bonding strength in the doped material, which could lead to altered mechanical stability. Moreover, in the La-doped system, the higher frequency modes, which are dominated by Se and H atoms, show some broadening, particularly in the range of 150 to 250 cm−1. This broadening indicates changes in the vibrational dynamics caused by La doping. In the pure YHSe system, the phonon DOS is primarily dominated by contributions from Y, Se, and H atoms. In the La-doped system, however, there is a clear redistribution of phonon DOS across frequencies, especially for Y and Se atoms. The PDOS of Y shifts slightly toward lower frequencies, reflecting the influence of La doping on the vibrational properties of Y. This redistribution, along with the softening of the acoustic modes, underscores the significant role that La plays in modifying both the phononic structure and mechanical stability of YHSe. This shift, combined with the broadening of the Se peak, indicates that La has a significant impact on both low- and high-frequency phonon modes. The softening of the longitudinal acoustic mode, a key feature of the doped system, suggests a reduction in the material’s stiffness or rigidity. This softening likely results in a more mechanically flexible material, which may exhibit lower shear and elastic moduli. Given that low-frequency acoustic modes are crucial for heat transport, their softening could lead to a decrease in lattice thermal conductivity. This reduction in thermal conductivity is advantageous for thermoelectric materials, as it helps maintain a temperature gradient by minimizing heat conduction, thereby improving their efficiency. The presence of La, with its heavier atomic mass, affects the phonon spectrum, leading to shifts in phonon frequencies and altered phonon interactions, which impact both the thermal and vibrational properties of the material.
3.2.5. Optical Properties
Pure YHSe, classified as a yttrium-based hydride semiconductor [30], exhibits intrinsic optical properties that make it suitable for applications in optoelectronic devices. La doping provides a strategic approach to altering these characteristics, particularly by introducing specific elements at designated sites within the YHSe material for targeted applications.
3.2.5.1. Dielectric Function, ε(ω)
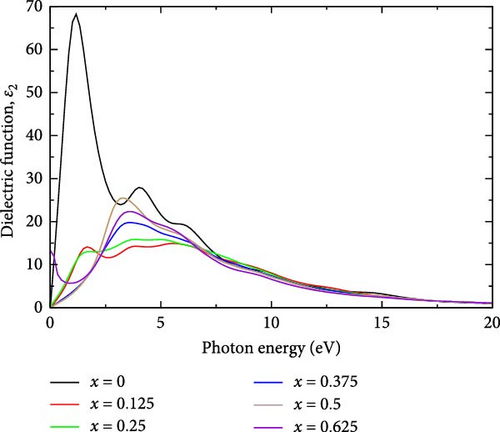
The real part of the dielectric function is a fundamental optical property that offers insights into the material’s response to external electric fields [46]. Specifically, the real part of the dielectric function, ε1(ω), reflects the material’s ability to polarize in response to an external electric field [28]. Figure 5a,b shows the real and imaginary parts of the dielectric function of La-doped YHSe at different La concentrations: (a) x = 0, (b) x = 0.125, (c) x = 0.25, (d) x = 0.375, (e) x = 0.5, and (f) x = 0.625, respectively. In La-doped YHSe, the real part of the dielectric function at different La concentrations reveals the material’s optical behavior.
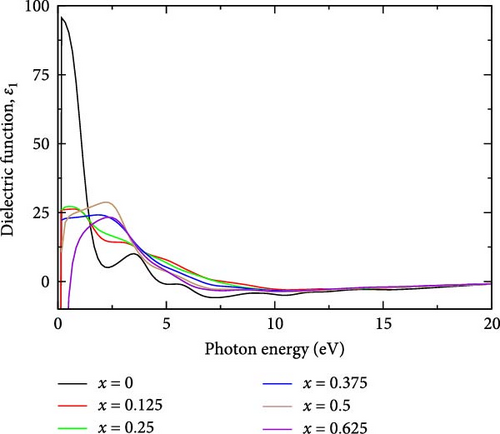
In pure YHSe, the real part of the dielectric function ε1 is exceptionally high at 95.61 at a photon energy of 0.1679 eV, as shown in Figure 5a. This elevated value indicates a strong interaction with external electric fields, reflective of the material’s intrinsic optical properties. This finding is consistent with previous studies by Rizwan et al. [34] on the electronic and optical behavior of La-doped perovskite using the DFT approach [47]. However, upon incorporating La into YHSe, there is a significant reduction in ε1 to 26.30, occurring at a higher photon energy of 0.67 eV compared to pure YHSe. As the La concentration increases to 0.25, ε1 rises slightly to 27.22, with the peak shifting to a lower photon energy of 0.5 eV. Further increasing the La concentration to 0.375 results in a decrease in ε1 to 24.16, with the peak occurring at a photon energy of 1.84 eV, indicating reduced interaction with external electric fields at this concentration. Additionally, as the La concentration reaches 0.5 and 0.625 ε1 slightly increases to 28.77 at 2.17 eV and then decreases to 23.33 at 2.34 eV, both within the visible region. These observations suggest that La doping significantly influences the behavior of the real part of the dielectric function, ε1, causing it to either increase or decrease depending on specific electronic transitions and the concentration of La, which alters the electronic structure.
Furthermore, the imaginary part of the dielectric function, ε2 for pure YHSe exhibits a peak value of 68.22 at a photon energy of 1.170 eV, indicating strong energy dissipation at this photon energy. However, with La doping at a concentration of 0.125, the imaginary part ε2, decreases sharply to 14.13, with the peak shifting to photon energy of 1.67 eV. This significant reduction in ε2 suggests that the introduction of La atoms modifies the electronic structure, leading to diminished energy dissipation or loss factor at 1.170 eV and shifting the absorption peak to a higher photon energy of 1.67 eV. As La doping increases to a concentration of 0.25, ε2 rises slightly to 15.87 at a photon energy of 3.84 eV, which lies in the UV range. This modest increase in ε2 indicates a partial restoration of energy dissipation in the material. With further doping to 0.375, ε2 increases to 19.78 at a photon energy of 3.33 eV in the UV range. This upward trend in the imaginary part of the dielectric function continues as the La concentration reaches 0.5, where ε2 peaks at 25.48 at a photon energy of 3.34 eV. This increase suggests that further doping enhances the material’s energy dissipation or loss factor, shifting the peak into the UV range. Furthermore, the imaginary part of the dielectric function for the pure YHSe system is higher compared to that of the La-doped YHSe, which is consistent with previous studies by Rizwan et al. [34] on the electronic and optical behavior of La-doped perovskite using the DFT method [47]. Additionally, from those findings, the observed fluctuations in the imaginary part of the dielectric function ε2 and shifts in photon energy can be explained by changes in the electronic structure induced by La doping.
3.2.5.2. Absorption Coefficient, α(ω)
The absorption coefficient in the UV region is a crucial optical property that offers valuable insights into a material’s potential suitability for various optoelectronic applications [14]. Figure 6 illustrates the absorption coefficient of La-doped YHSe at various La concentrations, corresponding to the system discussed in Figure 5a,b. For pure YHSe, the absorption coefficient significantly increases in the energy range of 6.68–7.01 eV, indicating strong absorption in the UV region. The absorption coefficient for pure YHSe is higher compared to its La-doped counterparts. As the La concentration increases, the absorption coefficient decreases relative to the pure system and shifts toward higher photon energies, moving into the upper UV range of the spectrum. This pronounced absorption characteristic of YHSe at specific energy ranges is consistent with previous studies by Rizwan et al. [34] on the electronic and optical behavior of La-doped perovskite using the DFT method [47]. At a La concentration of 0.125, the absorption coefficient drops to 5.597 × 108 cm−1 and shifts to a higher energy range of 12.69–13.02 eV, suggesting a reduction in light absorption capabilities. However, as the La concentration increases to 0.25, the absorption coefficient slightly rises to 5.985 × 108 cm−1, occurring in the photon energy range of 9.85–10.19 eV, indicating an enhancement in light absorption. At a La concentration of 0.375, the absorption coefficient decreases again to ~5.855 × 108 cm−1 within the same photon energy range of 9.85–10.19 eV. Additionally, at a concentration of 0.5, the absorption coefficient shows a minor decrease to 5.825 × 108 cm−1, shifting to a photon energy range 6.85–7.18 eV, reflecting a slight reduction in light absorption with increasing La concentration.
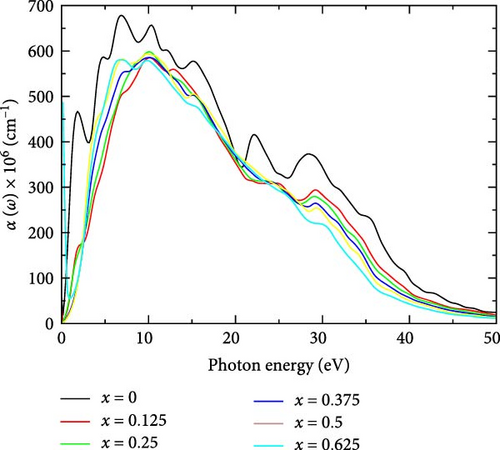
Finally, at the highest La concentration studied, 0.625, the absorption coefficient further decreases to 5.805 × 108 cm−1, occurring within the photon energy range of 6.68–7.01 eV in the UV region. The peak absorption coefficient across all concentrations, within the UV range of 6.68–13.02 eV, indicates that La-doped YHSe effectively captures electromagnetic radiation, particularly in the UV range. Along with other favorable criteria, this makes the material a promising candidate for photochromic applications. This finding is consistent with previous research on photochromic oxygen-containing YHx conducted through experimental approaches [42].
3.2.5.3. Refractive Index, n(ω)
The refractive index n(ω) of La-doped YHSe exhibits a complex relationship with both La concentration and photon energy. Figure 7 shows the refractive index of La-doped YHSe at various La concentrations, corresponding to the systems discussed in Figures 5 and 6. In pure YHSe, the real part of the refractive index (n) is notably high, reaching a peak value of 9.8 at a photon energy of 0.168 eV. This high refractive index indicates strong light–matter interaction and significant optical confinement, suggesting a dense and highly polarizable electronic structure within the La-doped YHSe material. For pure in Figure 7, YHSe, the refractive index starts high, peaking sharply around 0.168 eV, with a value of 9.8, indicating a strong response to electromagnetic waves at very low photon energies. As the La concentration increases, this peak becomes less pronounced, and the refractive index drops significantly for all doped systems. In the region between 0 and 3 eV, all La-doped samples 0.125–0.625 exhibit reduced refractive indices compared to pure YHSe, with higher concentrations generally resulting in lower values of refractive index. The refractive index continues to decrease for all concentrations, and the different curves converge around 10 eV, where the refractive indices are nearly identical. Beyond this point, the refractive index stabilizes, and the distinction between different La concentrations becomes minimal. This finding is consistent with previous studies by Rizwan et al. [34] on the electronic and optical behavior of La-doped perovskite using the DFT method [47]. The effect of La doping is more noticeable at lower photon energies. At higher photon energies, the refractive index continues to gradually decrease for all concentrations. There is little variation in the refractive index in this range, indicating that the impact of La doping on the refractive index diminishes significantly at higher photon energies. As the photon energy increases, the refractive index for all doped concentrations tends to stabilize and converge, particularly beyond 10 eV, where the refractive index becomes relatively uniform across all concentrations. The impact of La doping is most pronounced in the low energy range and becomes less significant at higher photon energies.
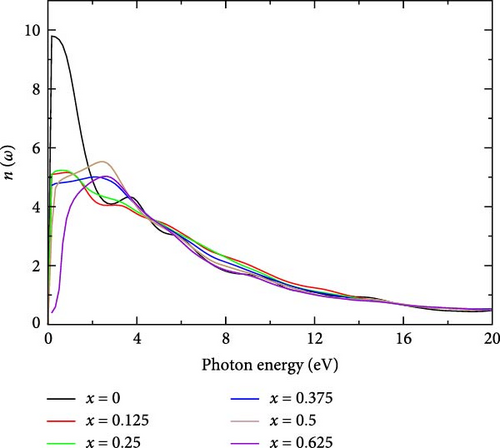
These results suggest that, as La concentration increases, the electronic structure becomes less dense and less polarizable at certain levels, leading to a reduction in the refractive index. This decrease signifies weaker light-matter interactions and lower optical confinement, particularly at concentrations of 0.125 and 0.375. Conversely, at 0.25 and 0.5 concentrations, the increased refractive index indicates enhanced electronic polarizability and stronger optical confinement due to the greater influence of La. Overall, each doping level introduces distinct modifications to the electronic structure, impacting polarizability, light–matter interaction, and optical confinement.
3.2.5.4. Extinction Coefficient, κ(ω)
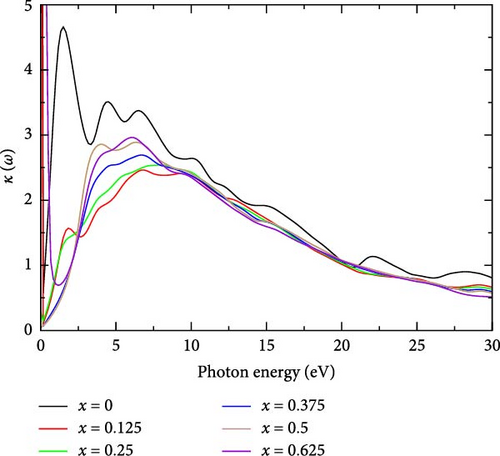
The extinction coefficient (κ) of La-doped YHSe provides valuable insights into the material’s optical properties. The imaginary part of the refractive index indicates the amount of energy loss due to the absorption of electromagnetic waves as they propagate through the material [48]. Figure 8 shows the extinction coefficient of La-doped YHSe at different concentrations, corresponding to the systems discussed in Figures 5–7. In pure YHSe, the extinction coefficient is notably high, reaching κ = 23.22 at a photon energy of 0.001 eV. This finding aligns with the prior research by Rizwan et al. [34], which investigated the electronic and optical characteristics of La-doped perovskite using the DFT approach [47]. For pure YHSe, the extinction coefficient exhibits a pronounced peak around 0.001 eV, indicating strong light absorption energy loss in this region. As the La concentration increases, the peak slightly shifts and the intensity of the extinction coefficient decreases, particularly for x = 0.25 and higher. In this range, the extinction coefficient decreases for all concentrations but displays several smaller peaks, indicating fluctuations in light absorption. The κ value generally remains higher at lower La concentrations, while for higher concentrations, the extinction coefficient flattens and becomes relatively lower. The κ value gradually diminishes for all concentrations, suggesting reduced absorption energy loss at higher photon energies. In this range, the extinction coefficient becomes nearly uniform, indicating minimal differences between La-doped samples at higher energies.
3.2.5.5. Reflectivity, R(ω)
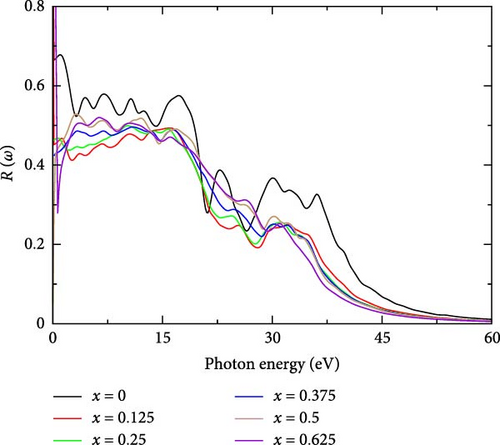
Reflectivity is a crucial optical property that describes how well a material reflects incident light at various wavelengths or energies [49]. For La-doped YHSe, reflectivity at different La concentrations provides valuable insights into the material’s optical behavior. Figure 9 illustrates the reflectivity of La-doped YHSe at various concentrations, corresponding to the systems discussed in Figures 5–8. For pure YHSe, the reflectivity peaks at r = 0.9, at a photon energy of 0.001 eV, indicating nearly perfect reflection of incident light at this energy level. This exceptionally high reflectivity suggests strong optical properties and efficient light reflection by the YHSe material. In the low photon energy range of 0–10 eV, the reflectivity remains high across all doping concentrations. However, between 10 and 30 eV, the reflectivity drops significantly across all concentrations, exhibiting noticeable oscillations. These oscillations may correspond to inter-band transitions, where the photon energy matches the energy gap between electronic bands, causing variations in reflectivity. While reflectivity for the pure material remains higher throughout this range, the curves for different doping concentrations begin to converge, suggesting that doping levels significantly alter the electronic structure and, consequently, the optical behavior of the material [50]. In the high photon energy range, all concentrations show a steady decline in reflectivity. By around 50 eV, reflectivity reaches a lower stable level for all doping levels. The convergence of all curves at this high-energy range suggests that doping has a diminishing effect on reflectivity at higher photon energies, likely because photons at these energies possess sufficient energy to interact with deeper core levels or pass through the material with reduced interaction. This result is consistent with previous studies by Rizwan et al. [34] on the electronic and optical behavior of La-doped perovskite using the DFT approach [34].
3.2.5.6. Loss Function, L(ω)
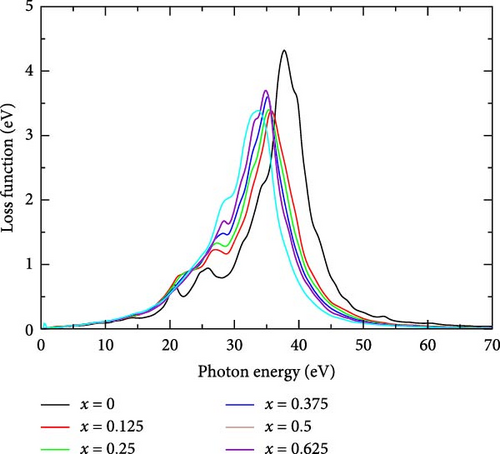
The electron energy loss function of La-doped YHSe was examined across various La concentrations. Figure 10 illustrates the electron energy loss function for doping concentrations ranging from 0.0 to 0.625. As shown in Figure 10, the loss function remains relatively low across all doping concentrations within the 0–20 eV photon energy range. Although the curves exhibit slight fluctuations, no significant peaks are observed, indicating minimal energy loss due to electron excitations or plasmonic oscillations in this range. The absence of major peaks suggests that this region corresponds to lower energy transitions that do not result in significant energy loss. The pure material displays a higher peak, indicating stronger plasmonic interactions compared to the doped materials. As the La concentration increases, the height of the peak decreases slightly, suggesting that doping reduces the strength of these collective oscillations. Beyond 40 eV, the loss function drops off for all concentrations, with no major peaks observed. This implies that at higher photon energies, the system does not exhibit strong plasmonic resonance or other significant energy loss mechanisms. The convergence of the curves at higher photon energies further indicates that the effects of doping become less pronounced as photon energy increases, with all concentrations displaying similar loss characteristics. La doping alters the electronic structure of YHSe, modifying the distribution of electron densities and energy levels. These changes can shift the plasmon resonance to lower photon energies as the electron cloud becomes less tightly bound, reducing the energy required to excite collective electron oscillations [50]. These findings are consistent with previous studies by Rizwan et al. [34] on the electronic and optical behavior of La-doped perovskite using the DFT approach.
4. Conclusion
In this study, the structural, electronic, phonons, and optical properties of La-doped YHSe, as well as the effects of pressure variations on its optical properties, are investigated using a DFT approach. Phonon calculations indicate that both the La-doped and undoped YHSe systems are dynamically stable, as they exhibit no imaginary frequencies in the BZ. Analysis of the structural properties shows that the introduction of La atoms, which are larger than yttrium atoms, causes an expansion of the lattice parameters, particularly along the c-axis. This increase in the lattice parameter c with higher La concentrations results in a higher c/a ratio, indicating anisotropic structural modifications. Furthermore, the addition of La as a dopant enhances both electron mobility and conductivity while also reducing the energy bandgap. This narrowing facilitates easier electron transitions between energy states, suggesting a shift toward metallic behavior in the YHSe material. Doping La into the YHSe system under fixed extreme pressure significantly enhances the compound’s optical properties. These results indicate that La-doped YHSe exhibits greater sensitivity to various UV-light wavelengths. Additionally, the enhanced optical behavior of YHSe under varying pressure suggests its potential for strong radiation absorption in the UV-light wavelength range. As pressure increases in the UV region, there is a noticeable shift toward higher photon energy in the peak absorption coefficient. The observed increase in the peak absorption coefficient signifies a fine-tuning process in which the optical behavior of YHSe evolves in response to changing pressure conditions.
Overall, the combined effects of La doping and applied pressure synergistically enhance the optical behavior of YHSe, particularly in the UV-light spectrum. This dual enhancement not only increases the material’s absorption coefficient in the UV spectrum but also refines its structural parameters, making it suitable for optimizing photochromic materials. While this study has provided valuable insights into the effects of La doping and pressure on YHSe, further research is needed to explore the compound’s performance in practical device applications, such as UV detectors and photochromic devices. Additionally, a deeper exploration of the thermal and mechanical stability under varying pressure conditions, along with experimental validation of these theoretical predictions, would enhance our understanding of YHSe’s potential in advanced optoelectronic applications.
Conflicts of Interest
The authors declare no conflicts of interest.
Author Contributions
All authors listed have made a substantial, direct, and intellectual contribution to the work and approved it for publication.
Funding
No funding was received for this research.
Acknowledgments
We gratefully acknowledge the Adama Science and Technology University (ASTU) for their support during this work.
Open Research
Data Availability Statement
The data that support the findings of the study are available within the article.


