Thermal Aging of Asahi SB-1000 Polymer Optical Fibers: Study on the Light Transmission Loss
Abstract
Different samples of Asahi model SB-1000 polymer optical fibers arranged at different curvatures were aged to predict the loss of light transmission over 10 years. They were used in the FV0 detector of the ALICE experiment at the LHC. The fibers were exposed to 80°C, maintaining a relative humidity of less than 50% RH. The relative transmission loss was measured before and after aging. A maximum loss of 15% was found for 632 hr of aging, equivalent to 5 years for the ALICE experiment conditions considering thermal aging. This estimate is based on the Arrhenius model, using energy activation data from the literature. Complementary tests were done to analyze the fiber materials, such as XRD (WAX), FTIR, and mechanical tensile tests. For FTIR, no changes are found that indicate modifications in the chemical structure but in the physical properties of the materials. A study based on XRD shows that during the first 72 hr, changes in crystal size were observed, and consequently, there was a loss of transparency. Hence, mechanical tests indicate that the fiber decreases its Young’s modulus with longer aging times, making the material more tenacious to rupture.
1. Introduction
Polymeric optical fibers (POF) have been intensively studied during the last decades. They are important in many applications in areas such as telecommunications, medicine, the automotive industry, high-energy physics experiments, etc. One of the interests of these studies is the lifetime estimation, which is related to the deteriotion of optical and mechanical properties that are very important for any application. These changes due to natural aging usually occur over decades, and it is not advisable to conduct studies for that long, that is why most research uses accelerated aging techniques [1, 2]. POF studies on this topic have been reported in many publications, such as in [3, 4, 5, 6].
In high-energy physics, various types of radiation detectors are developed. These detectors utilize different kinds of POFs to transmit light generated when a subatomic particle passes through the detector’s active area. Given the typical lifespan of a high-energy physics experiment, which lasts around a decade, it is crucial to study the behavior of these POFs over such a period.
This study is mainly related to estimation of optical and mechanical changes of a particular type of POFs that were used in the design of the FV0 detector, which is part of the fast interaction trigger (FIT) of A Large Ion Collider Experiment (ALICE). ALICE is one of the four accelerator Large Hadron Collider (LHC) experiments.
FIT detectors serve as an interaction trigger, online luminometer, initial vertex position indicator, and forward multiplicity counter [7]. FV0 detector consists of a scintillating plastic disk with a novel light collection scheme that ensures uniform response on the entire 2 m2 surface [8]. This light collection scheme is composed of around 50,000 POFs. The light emitted by the scintillator disk has a wavelength of 408 nm, according to the manufacturer reports (Eljen, model EJ204). These POFs are subjected to different curvatures due to the design and space limitations of the detector (Figure 1). Therefore, the main interest of the work is to predict the loss of transmission in the POF as a consequence of environmental aging and the stresses generated by the curvatures during 10 years that it will be in operation.

The loss of light transmittance in the FV0 detector, as a result of aging, can lead to a significant loss of registration of numerous photons produced by the scintillator. This loss of information would directly impact the amplitude and time resolutions, potentially rendering the detector incapable of meeting the experiment’s requirements to serve as its trigger. Losses exceeding 50% are already considered a threshold for the renewal of the detector; however, even losses below this threshold can be mitigated by adjusting the gain of the photosensor.
2. Aging Acceleration
Aging can be defined as physical and chemical processes which irreversibly affect a material over time [2].
Moisture, visible, UV and ionizing radiation, temperature changes, chemical agents, and others can cause aging, which reducing a material’s lifetime [9, 10].
Although, ambient temperatures or relatively elevated temperatures ranging from 50 to 80°C are not sufficient to generate breaks in backbones for a majority of organic polymers, a combination of conditions, such as elevated temperatures and oxygen, can generate changes in the material. This aging is known as thermo-oxidation [11].
It is well-known that thermodegradation is a common technique to accelerate a material’s aging [5, 9, 10]. Thermal aging generates thermal degradation that contributes to changes, and alterations in polymer’s physical properties, such as mechanical and optical properties. In mechanical properties, toughness, elasticity, or strength are involved [11]. For optical properties, changes can be observed in transparency.
Exposure at elevated temperatures for short or long periods can produce irreversible chemical and physical changes. When the temperature increases, the degradation process accelerates [12].
| Temperature (°C) | γ | Aging time (hr) |
|---|---|---|
| 80 | 69.52 | 1,264 |
| 100 | 226.47 | 388 |
The Arrhenius model was considered to obtain the acceleration factor, which helps predict the time in which the material’s aging can be accelerated. Several models allow for this factor to be obtained, are relatively valid depending on the temperature range, and can be integrated into a wide range of these. In our case, only two temperatures were used, so the Arrhenius model based on Van’t Hoff’s rule is also valid [5].
3. Experimental
The FV0 detector has clear polymer optical fibers, Asahi brand model SB-1000, which are made up of a PMMA core and a cladding, which the manufacturer only mentions that it is a fluoropolymer.
The ALICE experiment is 60 m underground, where the average temperature and humidity are 23°C and around 40% RH, respectively. The detector is located in the middle of ALICE and isolated from UV radiation. Only temperature was considered in our aging acceleration experiments, maintaining low humidity conditions (<50% RH). A temperature value of 80°C was chosen to reduce the aging time and avoid physical damage to the fiber, such as shrinkage in the cladding when approaching the glass transition temperature. The glass transition and melting point temperatures of PMMA are about 105 and 130°C, respectively [18]. At the end of the studies, tests were carried out also at 100°C, and no physical damage was observed.
3.1. Preparation of POFs Samples
3.1.1. Loss Transmission Test
One meter-long fibers were cut for the transmission loss tests, and FC-type connectors for 1 mm diameter fiber optics were placed. The connector was glued with optical epoxy cement (Eljen Ej-500), and the fibers on the terminal faces were polished. Likewise, before aging the fibers, the transmittance was measured with the straight fiber and then measured again, but the fibers were arranged at different curvatures of 50, 70, 100, and 200 mm in diameter (Figure 2). Measurements indicate a transmission loss due to curvature; for smaller diameters, the loss was between 4% and 3%, respectively; no losses were found for larger diameters. Optical grease with a refractive index of 1.47 was used to avoid light losses due to a change of medium (splitter fiber–air–fiber).
For this research, the fibers were aged using an oven Thermo Scientific Heratherm model OGH-60; every 72 hr, the transmission loss was measured. To ensure the stability of the oven, a datalogger was used to monitor the temperature, which did not exceed ±0.2°C.
3.1.2. Complementary Tests
Complementary tests were carried out to characterize the material that makes up the POF. These studies included mechanical stress tests, X-ray diffraction (XRD), and Fourier transform infrared spectroscopy (FTIR).
The mechanical tension test aimed to obtain the Young’s module and the stress–strain curve at different aging times. For this test, nine fibers of 90 cm were cut from the reel, and groups of three fibers were formed for various ages: unaged, 72, and 432 hr aging. An Instron 1125 universal tension machine, with a deformation speed of 10 mm/min was used.
The X-ray diffraction WAX (Wide Angle X-ray) was used to study the amorphous or crystallinity of the polymer. As mentioned, the fiber is composed of two polymers, so both were separated from the fiber to be studied separately. The core was obtained by washing the fiber with a few drops of acetone and removing the cladding with tweezers. The cladding was obtained by dissolving the PMMA core in chloroform for 24 hr. The samples were cut into 2 cm of length. The X-ray diffraction was done using the powder technique, so the complete fiber, core, and cladding samples were pulverized. A diffractometer Bruker, D8-Discovery, was used for this test with a λ = 1.54 Å.
For infrared spectroscopy, the three samples (fiber, core, and cladding) were analyzed similarly at different aging times: unaged, 72, and 432 hr. A Nicolet 510P Fourier Transform spectrometer was used.
3.2. Methodology for Measuring Transmission Loss
An experimental arrangement was used to measure the transmission loss consisting of a Picosecond Laser System laser, Model EIG2000DX, with a 405 nm wavelength. This wavelength is within the range the plastic scintillator emits (408 nm). This laser is connected to a commercial light splitter with 16 channels, of which only two channels were used, called SP1 and SP11. The fibers of the splitter are made up of silica and are 100 μm in diameter. Channel SP1 was connected to a photomultiplier tube (PMT) that would serve for the monitoring laser intensity variation, called reference PMT, and SP11 was connected to the fiber to be studied, and this, in turn to, another photomultiplier called PMTCV (Figure 2). Both photomultipliers are Hamamatsu Model R5946-70.
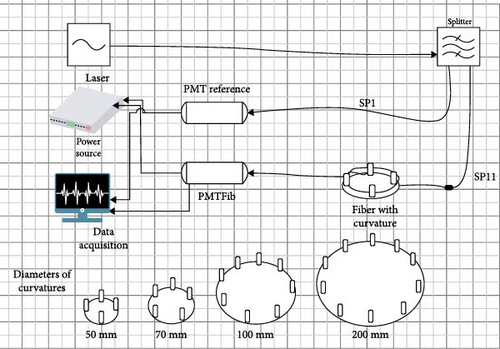
Data acquisition (DAQ) was performed using concurrent VME SBC (Single Board Computer) technology. A standard CAEN VME 4-channel V1729 digitizer module was used to digitize the PMT signals. The analysis data were made by using ROOT, a framework of large-scale data analysis, designed at CERN and it is based on C++ language.
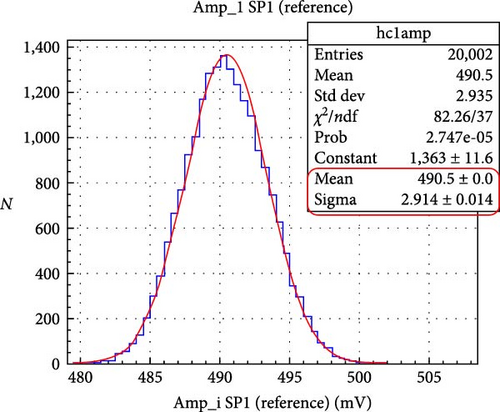
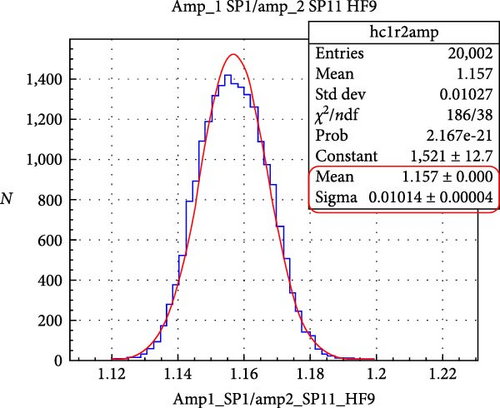
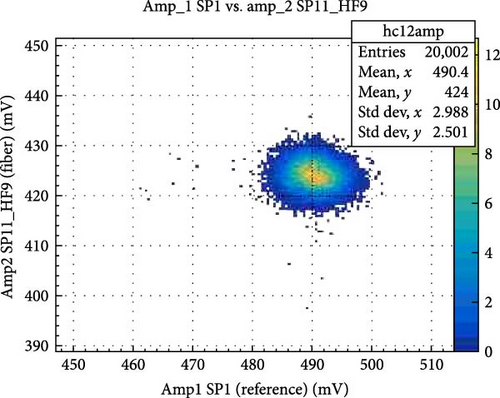
The light transmission loss from the splitter to plastic fiber is negligible because of fiber diameters. Splitter fibers are 10 times smaller than Asahi fiber. Between 5 and 10 measurements of 20,000 laser pulses, each was made to measure the relative transmission for both channels of the splitters. In each measurement, a Gaussian function was used for fitting signal amplitude distribution; in Figure 3, the distribution of amplitudes from the PMTCV with SP11-fiber and the PMT reference are shown in Figures 3(a) and 3(b), respectively. Distribution of ratio between both amplitudes can be seen in Figure 3(c). In the red box in the upper right of the graph, the standard deviation indicates that the precision of the ratio is less than 1%. Figure 3(d) shows the correlation between both amplitudes.

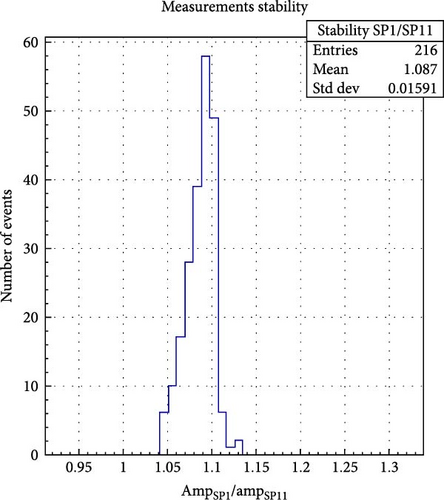
The reliability was evaluated from the systematic error, related to the methodology of transmittance measurement, which required the constant connections and disconnections of the fiber to/from the photo-sensor in order to measure its transparency during the aging experiments. The ends of the fiber may be partially damaged or get some impurities on the surface during these procedures resulting in transmission loss not related to aging. This kind of error could be avoided by cleaning the fiber between experiments and checking the surface damages with a microscope. That is why we have done multiple measures to estimate the systematic error. These measurements consist of the amplitude of the output pulse of each photo-sensor, which is proportional to the transmittance. The distribution of the ratios of the amplitudes is shown in Figure 4, where we can estimate the systematic error of transmission losses of 1.5%, which was used to generate the error bars in Figure 5.
4. Results
4.1. Transmission Loss
The results of the transmission loss for the different samples at 80, 100°C, and low humidity conditions are shown in Figure 5. As can be seen from the figure, the transmission loss behavior depends on the size of the curvature. The initial transmission was measured in the samples before bending them and before aging. It is well-known that there are transmission losses due to bending, and it was observed that there is indeed a loss due to bending, as mentioned in Section 3.1.1. However, for accelerated aging, the transmission loss is slightly lower for small curvature diameters than for bends with larger diameters within the first 100 hr, where the transmission drops down faster. This probably can be explained by that the small curvatures created superficial microcracks and, after the heating, these were somehow recovered. Therefore, we expect that there will probably be no repair in the cracks in natural aging at room temperature. It is believed that there would be an initial loss due to bending, but it may not imply different aging than fibers of larger curvature.
The same tests were performed for samples at 100°C for two fibers with curvatures of 500 mm diameter. Measurements were performed every 24 hr after heating. As can be seen from the figure, the fast drop in transmission loss also happens in the first 24 hr after starting the thermal aging. A fit was made to this curve, allowing us to identify the times for each transmission in both temperature conditions.
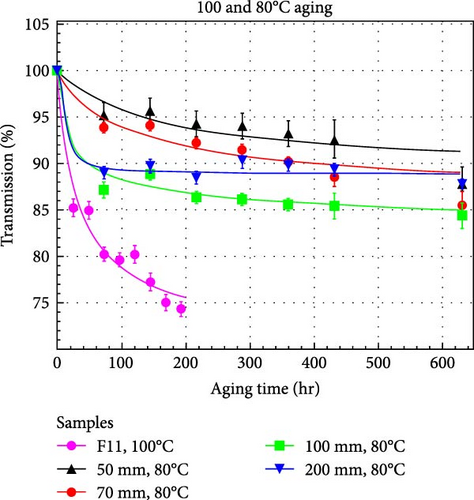
For both cases, the aging time was estimated using the Arrhenius equation with Ea = 0.67 eV, and the accelarated aging time corresponds to 5 years of aging at 23°C. As can be seen from Figure 5, the transmission loss is different for these temperatures, which could indicate that this activation energy value is not suitable for these transmission loss estimations.
The question of whether the Arrhenius model can be used to estimate fiber transmission losses due to thermal aging is not yet established. The other option is to assume that the Arrhenius model can still be used for this purpose and try to find the value for the energy activation that can explain these results. Following the last option and using the relative acceleration factor γ for two different temperatures and the same transmission loss, a connection can be derived from the Arrhenius relation that can be used for the activation energy estimation.
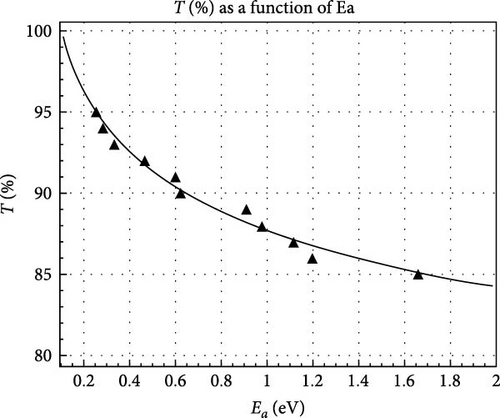
Another study on transmission loss was performed by Appajaiah [11]. He measured the transmission of different brands of POFs at 100°C near the Tg of PMMA at low humidity, demonstrating a 65% loss of transmission for the Asahi brand fiber model TB-1000 in the first 125 hr. He used wavelengths of 550, 590, and 650 nm for his study, in which there is loss of transmission due to absorption of molecular vibrations. In our case, we tested the transmission loss with a wavelength of 405 nm, this loss is associated with the absorption of electronic transitions. Therefore, the loss must be lower [11]. Searching the literature has not found anything that associates transmittance with activation energy; hence, this model could be used to verify whether it is fulfilled with different temperature ranges and wavelengths.
With the results obtained to calculate the transmission loss using the Arrhenius model, the optical properties of the materials the fiber is composed of must be studied separately to verify if the aging of the fiber is due to thermal aging, defined by the Arrhenius equation or deterioration of the boundary between the cladding and the core.
4.2. Fourier Transform Infrared Spectroscopy
In the case of cladding, the OMIC software was used to compare the FTIR spectrum to identify which fluoropolymer it is. The results returned by the database show a 69.68% coincidence with fluorinated polyvinylidene (PVDF).
PVDF is a 57% partially fluorinated polymer with a melting point of 177°C, an operating temperature of less than 140°C, UV resistant, and partial crystallization [19].
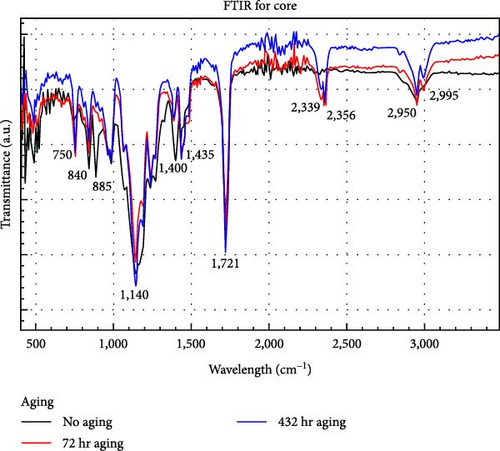
Figures 8, 9, and 10 show the transmission spectra for each sample, fiber, core, and cladding, respectively, at different times of aging. For the fiber and cladding spectrums, we observe the same absorption bands; this is expected because the FTIR test is only superficial.
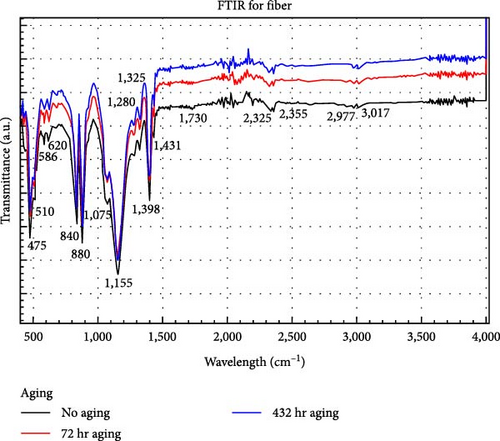
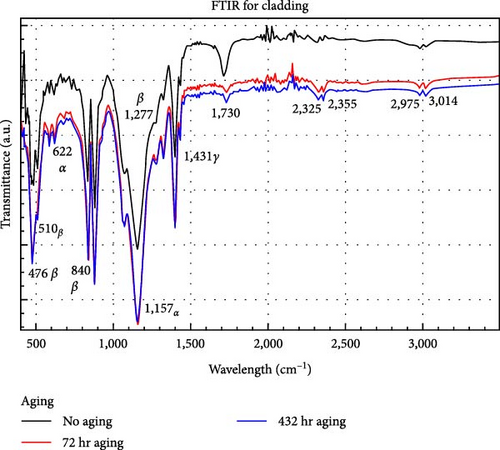
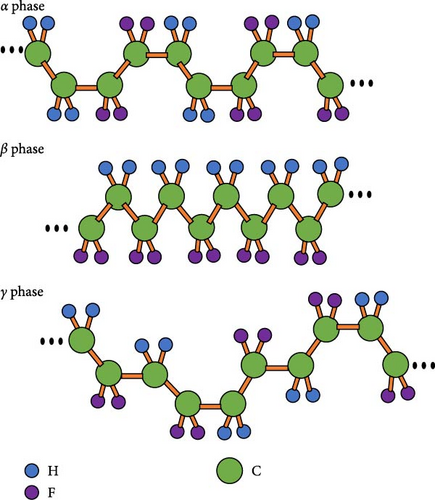
The bands for the cladding correspond largely to the β and γ phases of PVDF (Figure 11), which have characteristic bands at 445, 473, 1,275, and 1,431 cm −1 for the β phase and 837–841 and 508–512 cm −1 in both phases. Bands belonging to the three polyforms (α, β, and γ) are found in 876–885, 1,067−1,075, 1,171–1,182, and 1,398–1,404 cm −1 [19]. For band 620 cm −1 corresponds to α phase. It can be seen in Figure 9 that for the unaged sample, the band at 1,730 cm −1, the intensity of this band is higher than that for the aged samples, and the molecular vibration decreases in this functional group in the latter; the same happened with fiber samples (Figure 8). This decrease in intensity is due to physical changes and not chemical changes [3]. What is reported indicates that it belongs to a carboxylic acid in the ranges of (1,700–1,730) (C═O) or an ester (1,730–1,750) [20]; however, they report ester carbonyl in checar redaccion [21].
For the core and cladding spectra, the bands found between 2,320 and 2,355 cm −1 appear from the first aging of 72 hr. The band 2,340 cm −1 corresponds to carbon dioxide. This can be a background in the measurement [22]. Additionally, bands at 885 and 1,400 cm −1 in the core’s spectrum could be a remnant of PVDF from the cladding and core separation process in the unaged core (the unaged and aged samples for this test are different samples). Traces of ammonium bisulfate from the production of MMA is also may appear around 885 cm −1 [23]. This band is not shown by the aged samples. For PMMA, the absorption bands are presented in Table 2.
| PMMA | ||
|---|---|---|
| Bond | Wavenumber range | Vibration type |
| C═O | 1,721 | Stretching |
| CH2 | 1,485 | Bending |
| CH of α─CH3 | 1,455 | Asymmetric bending |
| CH of O─CH3 | 1,435 | Symmetric bending |
| CH of αCH3 | 1,387–1,400 | Symmetric bending |
| C─C─O | 1,270–1,240 | Symmetric stretching |
| C─O─C | 1,190–1,140 | Asymmetric stretching |
| C─O | 1,065 | Stretching |
| OCH3 | 983 Unaging—987 aging | Rocking |
| α─CH3 | 964 | Rocking |
| CH2 | 840 | Rocking |
| C─C | 750 | Asymmetric stretching |
No significant changes were found that indicate a change in the chemical structure of both materials. However, there can be physical changes in the cladding, and it could be observed that the three crystalline phases are present in the PVDF. This polymer has at least five polyforms α (TGTG’), β (TTTT), γ (T 3GT 3G’), δ, and ɛ; the last two polyforms are constructed depending on the fabrication process [19].
4.3. X-Ray diffraction (WAX)
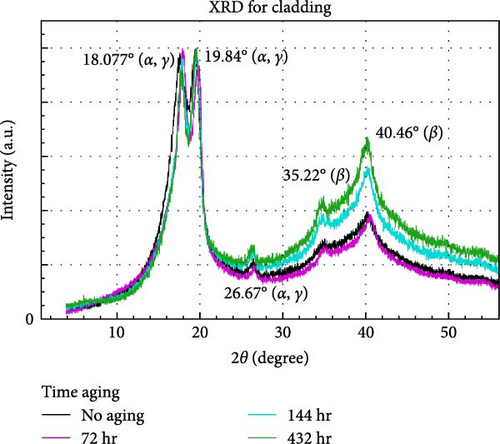
The core and cladding diffractograms for each aging time are shown in Figures 12 and 13. As can be seen, the cladding has well-defined narrow peaks that demonstrate that the material is semicrystalline, contrary to the core, which is observed to be amorphous. As has been found in the literature, the diffractogram of the nucleus effectively corresponds to PMMA, the cladding diffractogram resembles the diffractogram of PVDF, with 2θ angles corresponding to those presented in the literature for both [18, 19, 24, 25]. Table 3 shows the diffraction angles along with their interplanar distances according to Bragg’s law (Equation (9)):
| Core | ||||
|---|---|---|---|---|
| Reflection | Diffraction angle, θ (degree) | Interplanar distance 0 hr (Å) | Interplanar distance 72 hr (Å) | Ineterplanar distance literature [25] |
| First reflection | 7.31 ± 0.005 | 6.05 ± 0.005 | 6.177 ± 0.004 | 7 |
| Second reflection | 14.7 ± 0.002 | 3.04 ± 0.002 | 2.99 ± 0.002 | 2.94 |
| Third reflection | 20.07 ± 0.006 | 2.24 ± 0.006 | 2.25 ± 0.004 | 2.79 |
| Cladding | ||||
| Reflection | 2θ (degree) | 2θ (degree) literature [19] | Interplanar distance (Å) | Interplanar distance (Å) 72 hr |
| First reflection | 17.77 ± 0.006 | 18.4 | 4.99 ± 0.002 | 4.90 ± 0.002 |
| Second reflection | 19.49 ± 0.007 | 20 | 4.55 ± 0.0016 | 4.47 ± 0.0012 |
| Third reflection | 26.45 ± 0.014 | 26.6 | 3.366 ± 0.002 | 3.34 ± 0.002 |
| Fourth reflection | 35.1 ± 0.039 | 35.9 | 2.56 ± 0.003 | 2.546 ± 0.0016 |
| Fifth reflection | 40.2 ± 0.018 | 41.1 | 2.24 ± 0.001 | 2.22 ± 0.0007 |
- The data obtained and those found in the literature are presented.
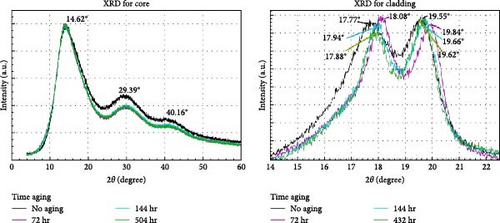
The diffractogram for the cladding demonstrates a displacement in the angles of maximum intensity (Figure 12); which modifies the interplanar distance. For the first 72 hr, we can observed a change of 1.68% and 1.77% for the first and second reflections, respectively. However, for 432 hr in both reflections, the modification is only of 0.6% (Table 3). A change in interplanar distance implies a variation in crystallographic planes and, therefore, in the optical properties of the material [26].
Before aging, the first peak at angle 2θ = 17.77 ° is associated with plane (100), and after 72 hr aged, the angle increase to 18.1 °; therefore, the plane is (020), both cases correspond to α phase [27, 28]. For the second peak, before aging, angle 2θ = 19.49 °, corresponds to (002) and is associating to γ phase. After aging 2θ = 19.85 ° is represented by (110) and could be associated with α or γ phases [27, 28], and for the three subsequent peaks, the planes correspond to (021), (200), and (002), respectively, for α or β phases [27, 28]. In those cases, the interplanar distance change is insignificant with aging. Transparency of the material can depend on the directions of the crystallographic planes [26].
On the other hand, there is a change in the width of the peaks presented in the diffractogram with respect to the aging time. In Table 4, the decrease in peak width is observed; which indicates that the material is crystallizing [29].
| Crystal size for core | |||
|---|---|---|---|
| Reflection | Aging time (hr) | Width peak (degree) | Crystal size (Å) |
| First reflection | 0 | 7.60 ± 0.07 | 11.00 ± 0.10 |
| 72 | 6.14 ± 0.037 | 13.61 ± 0.083 | |
| 144 | 6.47 ± 0.05 | 12.93 ± 0.1 | |
| 504 | 6.5 ± 0.065 | 12.93 ± 0.13 | |
| Second refelction | 0 | 15.03 ± 0.13 | 5.71 ± 0.049 |
| 72 | 14.62 ± 0.12 | 5.88 ± 0.048 | |
| 144 | 14.73 ± 0.12 | 5.83 ± 0.049 | |
| 504 | 14.56 ± 0.12 | 5.90 ± 0.047 | |
| Third reflection | 0 | 16.44 ± 0.67 | 5.37 ± 0.22 |
| 72 | 18.85 ± 0.44 | 4.69 ± 0.11 | |
| 144 | 19.11 ± 0.47 | 4.62 ± 0.11 | |
| 504 | 20.07 ± 0.55 | 4.40 ± 0.12 | |
| Crystal size for cladding | |||
| Reflection | Aging time (hr) | Width peak (degree) | Crystal size (Å) |
| First reflection | 0 | 2.59 ± 0.042 | 32.39 ± 0.52 |
| 72 | 1.77 ± 0.0282 | 47.57 ± 0.76 | |
| 144 | 1.76 ± 0.035 | 47.70 ± 0.96 | |
| 432 | 1.66 ± 0.038 | 50.51 ± 1.14 | |
| Second reflection | 0 | 1.89 ± 0.033 | 44.61 ± 0.81 |
| 72 | 1.43 ± 0.026 | 58.77 ± 1.02 | |
| 144 | 1.55 ± 0.033 | 54.26 ± 1.17 | |
| 432 | 1.39 ± 0.028 | 60.38 ± 1.24 | |
| Third reflection | 0 | 2.04 ± 0.1 | 41.80 ± 2.13 |
| 72 | 1.96 ± 0.1 | 43.61 ± 2.33 | |
| 144 | 2.34 ± 0.1 | 36.41 ± 1.65 | |
| 432 | 2.30 ± 0.11 | 37.13 ± 1.84 | |
| Fourth reflection | 0 | 2.71 ± 0.48 | 23.47 ± 3.06 |
| 72 | 3.70 ± 0.19 | 23.54 ± 1.24 | |
| 144 | 3.34 ± 0.17 | 26.04 ± 1.37 | |
| 432 | 3.37 ± 0.2 | 25.78 ± 1.55 | |
| Fifth reflection | 0 | 5.02 ± 0.12 | 17.61 ± 0.42 |
| 72 | 3.87 ± 0.08 | 22.85 ± 0.47 | |
| 144 | 3.98 ± 0.075 | 22.19 ± 0.43 | |
| 432 | 3.72 ± 0.068 | 23.73 ± 0.43 | |
- The size of the crystal for the cladding in the different reflections increases during the aging time.
For the core, Table 3 shows changes in the 2θ angle for the first and second peaks, reflecting a change in the interplanar distances. For the first peak, a decrease in the interplanar distance of 2% is observed in the first aging process, and for the second peak, an increase in the distance of 1.56% is observed for the same aging. After this aging, the core recovers 0.4% and remains stable until 504 hr. Likewise, the width decreases for the first two peaks, indicating that the material crystallized.
The mechanism behind these changes is the conformation movement of the polymer chains. The chains in the amorphous polymers are arranged relatively freely with a lot of free space between and inside them, called fractional free volume. Besides, PMMA does not contain groups capable of forming strong inter- and/or intra-molecular interactions, as hydrogen bonds, therefore, the chains may easily change their conformation by their segmental movements. When the material is heated, the chain rearrangement is faster, causing a better packing, including small crystalline sections. Therefore, the existence of crystalline sections resulted in a less transparent material due to the variation in the refractive indexes within the material. It is very well-known that amorphous materials are more transparent than crystalline materials, which are usually opaque [31].
The X-ray diffraction (XRD) technique determines or may bring information on the degree of crystallinity of the polymer. As is well-known, a polymer can be semicrystalline, microcrystalline, or amorphous.
There is evidence that thermal treatments can cause an increase in the crystallinity degrees of some polymers [32, 33].
We can also observe that the diffractogram shows that the three phases of PVDF may coexist in the cladding. It is reported that the α phase has intensity peaks of 18.4°, 20.0°, and 26.6°, and for the β phase 35.9° and 41.1° [19]. For γ, a diffractogram is not found with the pure phase; however, its intensity peaks can be associated with those corresponding to the α phase, as reported in [34].
4.4. Tensile Testing
The mechanical tension test was performed using an Instron 1125 universal tension machine, with a deformation speed of 10 mm/min. Stress–strain curves were obtained for each aging time for 90 cm long samples Figure 14 shows the decrease in the Young’s moduli with respect to the aging time, within the range of 0.008–0.016 of deformation.
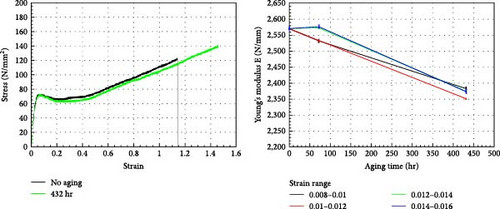
The difference between the Young’s moduli of metal, ceramic, or polymer lies in the different types of bonds in the constituent atoms. However, in the case of the three types of materials, the Young’s modulus decreases as the temperature increases.
On the other hand, polymers that exposure to temperature experience changes in their mechanical properties. This is because the material expands due to temperature, causing the volume to grow and the cohesive forces to weaken; consequently, the tensile strength and Young’s modulus decrease, and the elongation increases. In the case of flexible and crystalline polymers, when the material is subjected to mechanical stress in the elastic zone, the lamellar structures separate from each other, leaving an intermediate space between caused by the chain stretching, but they can return to their original position once the effort subsides. When the yield point is reached, the lamellar structure breaks, making smaller sections of them. This occurs because secondary bonds are broken, resulting in a material unable to recover with the orientation of the chains being the same as the applied stress [35].
5. Conclusion
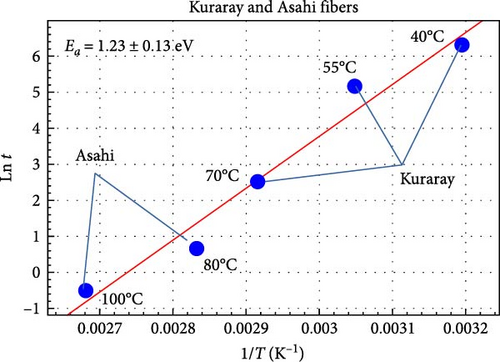
Using the Arrhenius equation for samples that were exposed to accelarated aging at 80 and 100°C, activation energy (Ea) was calculated for a relative transmittance loss of 5%–15%, which resulted in a range of 0.225–1.66 eV. For Kuraray scintillating fibers at different aging temperatures combined with our data, the activation energy calculated through the slope turned out to be 1.23 eV, which is within the range.
The maximum transmittance loss for Asahi SB-1000 fibers can be 15% for at least in 5 years. The FV0 won’t present a loss of transmission that requires renewal of the optical fibers. Curvatures with diameter greater than 50 mm will not present a problem in the precision of the detector due to aging; however, there will be a 10% change in detector accuracy. Our methodology can be used to calculate the Ea through the relative transmission.
FTIR demonstrated that the cladding is made of fluorinated polyvinylidene while core is PMMA. In the FTIR spectra of both materials, no variations were observed indicating changes in their chemical structure, but the physical properties were rather affected. Furthermore, XRD shows a change in the chain conformation, which causes crystallization in the material, making it less transparent. Mechanical tests demonstrate that the fiber is more tenacious to rupture according to the aging time.
Possible improvements to reduce our uncertainties include adapting the aging oven in such a way that the fibers remain assembled with the equipment for transmission measurements all the time during the aging experiment. Additionally, it would be worth reducing the temperature in the aging camera to 60°C and increase the exposition time of the fiber in the camera. Thus, low energetic processes occurring in the fiber may be better considered. Besides, studies can be performed with different kinds of fibers and wavelengths to validate the overall model. Likewise, it is necessary to conduct tests on the materials of the optical fiber to study their optical properties concerning thermal aging.
Conflicts of Interest
The authors declare that they have no conflicts of interest.
Authors’ Contributions
The planning and design of the experiment were carried out by Laura Helena González Trueba with the supervision of Dr. Varlen Grabski as main advisor. Dr. Larissa Alexandrova contributed the ideas to carry out the characterization of the materials, as well as Dr. Carla Aguilar Lugo contributed her expertise in the complementary studies. All authors supported the data analysis of this study.
Acknowledgments
We thank the following laboratory managers and technicians for the technical support provided to carry out this study: Dr. Luis Manuel Montano Zetina—LFAEIFM-Physics Department-CINVESTAV; B.S. Chem; Miguel Angel Canseco Martinez and MSc; Eliezer Hernandez from IIM-UNAM; Dr. Daniella Reggio LANCIC-IFUNAM Laboratory; Dr. Guerda Massillon, MSc; Cesar Ruiz Trejo and MSc; Eduardo Lopez Pineda Dosimetry Laboratory, IFUNAM; Tech. Antonio Morales Espino LREC-IFUNAM; Aaron Ramirez Torres, Joel Itauqui Osornio Martinez Mechanical Workshop, IFUNAM; M.E. Francisco Marquez Torres, Design Department, IFUNAM; and Dr. Oscar Ovalle Encinia LCM-IFUNAM. Open access funding enabled and organized by UNAM.
Open Research
Data Availability
The data used to support the findings of this study are available from the corresponding author upon request.


