Energy-Saving Optimization Design of Propeller Boss Cap Fin Based on BP Neural Network Coupled with Northern Goshawk Optimization Algorithm
Abstract
Facing the escalating global energy demand and environmental pressures, efforts to enhance ship efficiency and reduce carbon emissions have become pivotal strategies in addressing energy challenges. This study focuses on optimizing propeller boss cap fin (PBCF), proposing a strategy that integrates a backpropagation neural network (BPNN) with an intelligent optimization algorithm. PBCF’s positions relative to the propeller are expressed parametrically, and the sample space for PBCF parameters is constructed using Latin hypercube sampling. Building upon this, a BPNN model is established, with design parameters as inputs and hydrodynamic performance calculated by computational fluid dynamics as outputs. Simultaneously, the approximate model trained by the neural network serves as the objective function for the northern goshawk optimization algorithm, significantly enhancing the iteration speed. After determining the PBCF’s position parameters, the optimal performance airfoil is chosen as the PBCF profile from seven airfoil types. Finally, visualization techniques were employed to compare the flow field distributions of the optimized fin and the original propeller. The results demonstrate that the optimized fins effectively absorb tangential kinetic energy from blade flow, reduce hub cap pressure differences, and suppress post-hub vortices. Under specified design conditions, the optimized fins enhance the propulsion system’s efficiency by 1.5%. This study underscores the transformative potential of intelligent optimization techniques in shaping the future of maritime engineering, providing sustainable solutions to global energy challenges.
1. Introduction
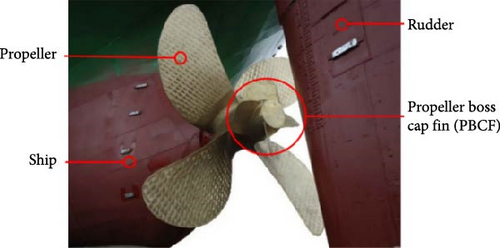
In the face of escalating global climate change and energy challenges, the maritime industry, characterized by high energy consumption and emissions, confronts immense pressure to enhance energy efficiency and reduce emissions. Clear guidelines have been established by the International Maritime Organization (IMO) through emission standards and energy efficiency requirements. Among these, the energy efficiency design index (EEDI) and the energy efficiency operational indicator (EEOI) stand out as pivotal criteria for evaluating vessel efficiency [1, 2]. To meet these demands, the maritime sector must adopt a series of effective measures, encompassing vessel design enhancements [3], propulsion system upgrades [4], and the application of energy-saving devices [5, 6]. Within the realm of energy conservation and emission reduction in maritime transport, the propeller boss cap fin (PBCF), as an energy-saving device, has garnered significant attention. The PBCF achieves energy efficiency by incorporating a specially designed hub cap and fins installed at the rear of the propeller. Its primary function is to weaken the hub vortex, thereby reducing energy losses and enhancing propulsion efficiency. In comparison to other devices, it not only boasts straightforward installation and substantial energy savings but also demonstrates wide applicability and stability. Importantly, it significantly lowers retrofitting costs and time without necessitating extensive vessel modifications, aligning seamlessly with the stringent energy efficiency standards set forth by the IMO. Consequently, PBCF, with its outstanding performance, has emerged as a key technology propelling the sustainable development of the maritime transportation industry. The structure of PBCF is illustrated in Figure 1.
The PBCF, developed by Japanese researchers, has found widespread application in the Japanese shipbuilding industry, attracting significant global attention [8]. According to relevant data, the implementation of this energy-saving device under actual operational conditions can reduce fuel consumption by 5% [9]. Both full-scale trials and model experiments are mainstream methods to study the hydrodynamic performance of PBCF. Cheng et al. [10] and Kim et al. [11] conducted model experiments on different propellers with PBCF, revealing that PBCF enhances propulsion system efficiency primarily by increasing thrust and reducing torque. Seo et al. [12] utilized a towed underwater stereoscopic particle image velocimetry (SPIV) system and a propeller open-water (POW) to measure the wakefield and thrust of the entire system. The study discovered significant performance differences of PBCF under different ship loading conditions, namely light load and heavy load. With the continuous advancement of computer technology, computational fluid dynamics (CFD) methods have gained widespread application in maritime engineering. Through precise numerical simulations, this method assists researchers in gaining profound insights into the mechanisms and performance of energy-saving devices like PBCF. Kurt employed a combination of CFD and optimization algorithms to optimize PBCF parameters. The results indicated that PBCF could enhance the energy efficiency of propulsion systems by 1.3% [13]. Ghassemi et al. [14] used the boundary element method to compare induced velocities in the flow field before and after installing PBCF. The outcomes demonstrated that PBCF could reduce induced velocities behind the propeller. Majumder [15] and Yin [16] optimized the airfoil profiles of fins and found that specific airfoil shapes significantly improve the performance of energy-saving devices. Trimulyono [17] shows that hubcap inclination and fin diameter directly affect the hydrodynamic performance of propellers and tests the hydrodynamic performance with different fin diameters and hubcap inclinations by the CFD method. Cheng et al. [10] proposed an integrated design approach combining theoretical design with numerical simulations for propellers and PBCF. Through model experiments, they validated that the optimized propulsion system exhibited high efficiency. Gaggero and Villa [18] and Gaggero [19] developed an optimization framework for PBCF based on CFD solving the RANS equations. The study confirmed that reducing hub vortex strength, torque, and the impact of fins on propeller blades are the primary factors for enhancing performance. Besides eliminating hub vortex and improving propeller efficiency, some studies have explored the impact of PBCF on noise radiation, cavitation performance, and ship-propeller matching [20, 21, 22].
In the realm of shipbuilding and aerospace equipment design, the emergence of machine learning and intelligent optimization algorithms has ushered in innovative methodologies. Artificial neural networks, among other techniques, are now being applied for design and optimization purposes. Neocleous and Schizas [23], for instance, extensively employed propeller cavitation experimental data to scrutinize the precision of neural network surrogate models with diverse architectures. Zeng et al. [24] utilized internal experimental data to establish a backpropagation neural network (BPNN) model for high-speed ship propellers. By integrating genetic algorithms with the BPNN models, they presented optimization scenarios for both single and multiple objectives. In a related study, Vesting and Bensow [25] and collaborators compared the performance of various surrogate models, revealing that optimization methods based on surrogate models outperformed those relying solely on numerical simulation. Additionally, Xue et al. [26] and team devised a propeller lift surface design approach grounded in a combination of genetic algorithms and a two-layer backpropagation neural network.
Traditional PBCF’ research primarily relies on CFD methods and model experiments. However, these methods come with certain issues and limitations. While CFD methods offer detailed flow field information, they are computationally intensive and time-consuming. Moreover, they are highly dependent on model accuracy, making it challenging to address complex nonlinear flow problems. Model experiments, on the other hand, are constrained by experimental conditions and costs, making it difficult to fully replicate real oceanic environments. Consequently, the reliability of their results is often in question. To address these methodological shortcomings, this paper adopts a research approach that combines neural networks with intelligent optimization algorithms. Neural networks possess strong nonlinear modeling capabilities, enabling them to learn from vast datasets and uncover intricate relationships within them. When combined with intelligent optimization algorithms, they not only enhance the accuracy of neural network models but also facilitate the identification of optimal solutions in multi-dimensional parameter spaces.
In this study, a dataset for constructing the neural network model is generated by continuously altering the position of PBCF relative to the propeller. The northern goshawk optimization (NGO) algorithm is employed with the goal of maximizing propeller propulsion efficiency to determine the best parameter combinations for PBCFs. Subsequently, various airfoil shapes are tested for their hydrodynamic performance as fin profiles, leading to the identification of the optimal PBCF’s shape. Finally, the energy-saving characteristics of the optimized propeller-fin system are comprehensively analyzed under design conditions.
2. Methodology
2.1. Numerical Model
2.1.1. Fundamental Equations of Fluid Dynamics
- (1)
Continuity equation:
- (2)
Momentum equation:
The Reynolds stress term in the equations is a new unknown quantity, so for the equations to be closed, some assumptions must be made about this stress term, and the pulsation values in the stress term must be related to the time-averaged values by creating an expression for the stress (or introducing a new turbulence modeling equation).
2.1.2. Turbulence Modeling
2.1.3. Model-Scale Propeller/PBCF System
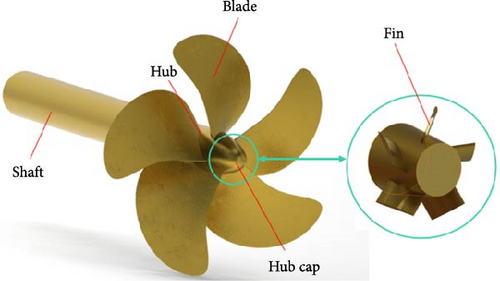
The research focuses on optimizing the geometric parameters of PBCFs, utilizing the KP505 propeller as the baseline. This specific propeller underwent extensive experimental and numerical investigations during the 2015 Tokyo Ship CFD Workshop, where a rich set of data was gathered and shared to validate numerical computational methods [30]. After much deliberation, model experiments are chosen over real-scale experiments in this paper. This decision stems from the application of similarity theory to ensure that the model matches the actual situation in terms of key hydrodynamic features. The use of a small scale provides better experimental controllability, and by reducing the scope of the study, the variables can be more precisely controlled. Second, considering the characteristics of the research problem, the small-scale model can greatly reduce the difficulty of data collection. The propeller is scaled down by a factor of 31.6, and the main parameters of the resulting model propeller are shown in Table 1. In order to better accommodate the installation of the PBCF, appropriate modifications were made to the hub cap component. The geometric model of the propeller is shown in Figure 2.
| Propeller parameters | Values |
|---|---|
| Diameter (R) | 0.125 m |
| Area ratio (Ae/Ao) | 0.818 |
| Pitch ratio (P/D) | 0.964 |
| Hub diameter ratio (λ) | 0.180 |
| Blade number (Z) | 5 |
| Direction of rotation | Right |
| Scale down | 31.6 |
2.1.4. Determination of Optimization Parameters and Construction of Sample Space
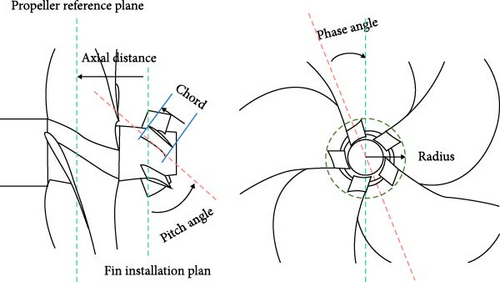
To determine the variables requiring optimization, this study thoroughly defined the PBCF based on their spatial positions and cross-sectional airfoil shapes. The phase angle was defined as the angle between the midline of the blade and the midline of the fin within the plane of the propeller disc. The axial distance was represented as the distance between the fin and the blade in the axial direction. The pitch angle denoted the angle between the fin and the vertical direction, while the chord length and radius were as illustrated in the diagram. Figure 3 provides a schematic representation of the position parameters of the PBCFs.
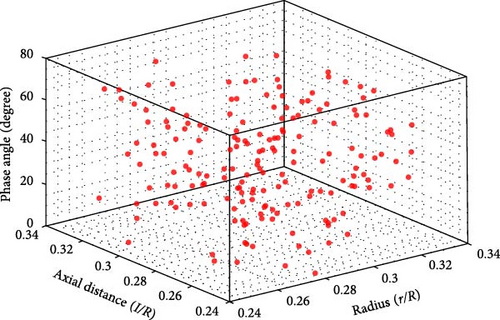
To optimize the PBCFs effectively, five key parameters were chosen: fin radius r, axial distance l, phase angle φ, pitch angle β, and chord length lc. Considering the computational challenges posed by a full factorial design method due to its high sample size and cost, a Latin hypercube sampling (LHS) approach was adopted. LHS allows for the division of each dimension into levels or intervals, with each level or interval accommodating only one sample. This method ensures a uniform and comprehensive distribution of samples across each dimension. By employing the LHS technique, a total of 230 distinct configurations were generated, as depicted in Figure 4. Table 2 outlines these factors and their respective levels.
| Decision variable | Range | Decision variable | Range |
|---|---|---|---|
| Radius (r/R) | 0.25–0.33 | Pitch angle (β/°) | 26–52 |
| Axial distance (l/R) | 0.24–0.336 | Chord length (lc/R) | 0.192–0.228 |
| Phase angle (φ/°) | 0–72 | Airfoil shape | Variable |
The profile design of the PBCF primarily relies on a rectangular shape. However, previous research indicates that utilizing airfoil profiles can significantly enhance hydrodynamic performance. After determining the installation positions and dimensions of the PBCFs using the optimization strategy combining a BPNN proxy model and the NGO algorithm, a comparison was made among seven different airfoil profiles for the PBCF. The basic parameters of these seven airfoil profiles are presented in Table 3.
| Serial number | Profile | Max thickness (%) | Max thickness position (%) | Max camber (%) | Max camber position (%) |
|---|---|---|---|---|---|
| 1 | NACA 2412 | 12.01 | 29.9 | 1.92 | 41.7 |
| 2 | GOE 491 | 4.85 | 20 | 2.95 | 30 |
| 3 | BE8356 | 8.1 | 20 | 6.51 | 30 |
| 4 | S1020 | 15.08 | 35 | 5.04 | 50.9 |
| 5 | EPPLER E662 | 15.02 | 42.4 | 4.08 | 47.6 |
| 6 | SG 6042 | 9.99 | 35.1 | 3.75 | 47.1 |
| 7 | RAF 33 | 12.64 | 30 | 4.69 | 30 |
2.1.5. Calculation Domain and Boundary Condition Settings
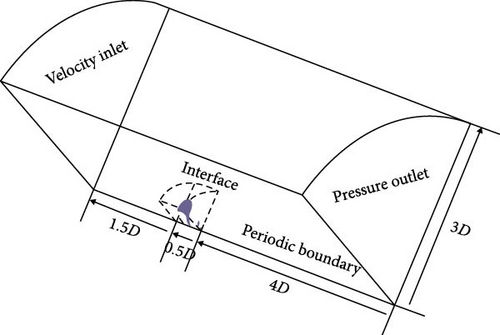
Numerical simulation using CFD is employed for the open water test of the propeller. In order to replicate the working environment of the propeller, a computational domain is established for simulation. The size of this domain is determined to ensure full fluid development while avoiding interference from walls and upstream effects. Taking advantage of the uniformity in incoming flow and the geometric periodicity of the propeller, the computational domain is focused on a single channel containing a single blade. This approach reduces computational time and enhances efficiency. Figure 5 illustrates the computational domain. The computational domain comprises two parts. One part rotates synchronously with the propeller to simulate its rotation—referred to as the rotating domain. This domain takes the form of a fan-shaped column with a diameter of 1.2D (D being the propeller diameter) and a height of 0.5D. The other part needs to be sufficiently large, known as the hydrostatic domain. The entire computational domain has a height of 6D, with a radius of 3D, constituting one-fifth of the cylindrical region. An interface is established between the two domains for information interaction. The propeller surface is designated as a no-slip wall, while both sides of the hydrostatic and rotating domains are defined with rotating periodic boundary conditions. To conserve computational resources and ensure accuracy in calculations, the method of a rotating coordinate system (MRF) is employed. The propeller’s rotational speed is set to n = 9.5 rps.
2.1.6. Verification of Grid Features and Grid Convergence
The rotating and stationary domains are discretized separately. The fluid domain undergoes meshing utilizing the software-exclusive trimmed mesh, with the mesh template growth rate set to the slow method. Mesh encryption is executed along the edges of the blade and fin, and a prismatic layer mesh is generated to maintain an approximate average y + value of 10 on the blade surface. To enhance the representation of the wake behind the blade and mitigate numerical dissipation, encryption of the mesh is applied in the aft region of the blade and at the inlet to the blade disc surface. The grids for the blade and fin surfaces, along with the computational domain grid, are illustrated in Figure 6.
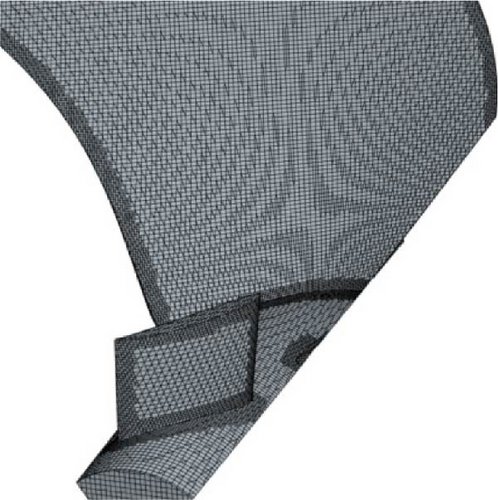
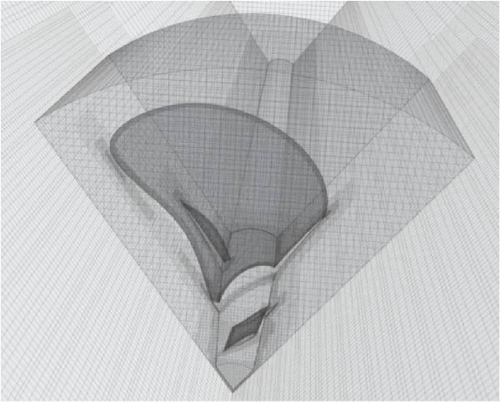
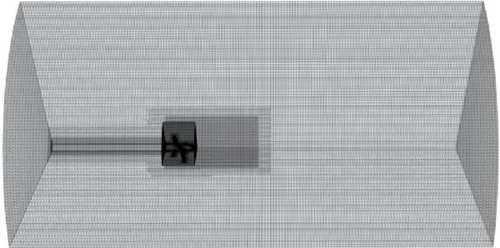
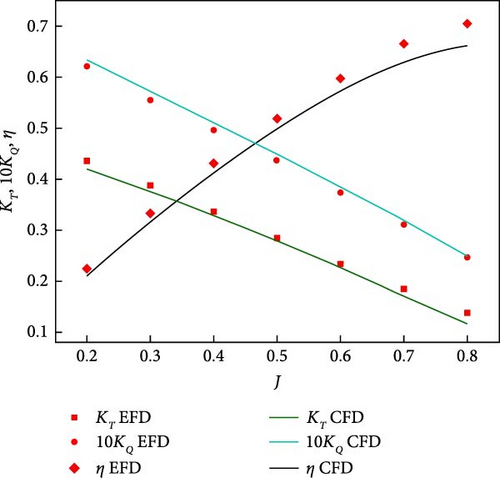
In CFD simulations, the precision of calculations is significantly influenced by the number of grid cells employed. Insufficient cells may lead to inaccuracies in surface approximation, while excessive cells inflate computational costs. Ensuring the accuracy of numerical simulations necessitates verifying grid independence [22]. In this study, four grid configurations, ranging from 0.66 to 2.44 million cells, were applied to compute the propeller’s open-water performance. Through a comparative analysis of the results from these configurations, grid independence was substantiated. The thrust coefficient results are summarized in Table 4. Examination of the data in the table reveals closely matched open-water performance results for the propeller across the four grid configurations. Notably, the configuration with 2.44 million cells exhibited the optimal grid independence. This configuration was consequently chosen as the baseline for subsequent computations. The open water results obtained from this grid were graphically represented (as shown in Figure 7). The computational outcomes are closely aligned with experimental values, underscoring the efficacy of the CFD methodology employed in this study for precisely forecasting the propeller’s open water performance.
| Mesh | Size (million cells) | KTCFD | KTEFD | Error (%) |
|---|---|---|---|---|
| 1 | 0.66 | 0.420 | 0.435 | 3.45 |
| 2 | 1.27 | 0.427 | 0.435 | 1.84 |
| 3 | 1.79 | 0.430 | 0.435 | 1.15 |
| 4 | 2.44 | 0.430 | 0.435 | 1.13 |
2.1.7. PBCF Energy Efficiency Assessment Method
2.2. Optimization Model
The optimization of PBCF design encounters certain limitations and precision challenges within the realm of traditional CFD methods and model experiments. CFD mandates a substantial volume of simulation experiments, while model testing is constrained by elevated costs and the interference of measurement errors. However, the adoption of an optimization framework that combines the BPNN with the NGO algorithm yields notable enhancements in the model’s adaptability. This integrated approach significantly reduces the extensive workload associated with CFD simulations and effectively mitigates experimental errors.
2.2.1. Optimization of Processes
The energy-saving optimization process for PBCFs is illustrated in Figure 8. The optimization variables consist of the parameters defining the position and size of the PBCFs, with the objective of maximizing the enhancement of propeller efficiency. Initially, the aLHS method is employed to form the sample space. The hydrodynamic performance of the sample points in the sample space is assessed through CFD simulations. The obtained data samples are then utilized to train a BPNN, generating the initial surrogate model. This surrogate model is employed as the objective function for the NGO algorithm during iterative optimization.
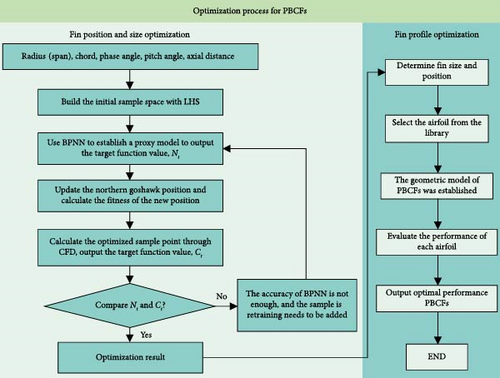
After the optimization iterations converge, the results are validated using CFD simulations. Concurrently, a continuous refinement of the surrogate model’s predictive accuracy is carried out by comparing the CFD results with the surrogate model’s outputs, ensuring compliance with error tolerance requirements. Once the optimal parameters defining the position and size of the PBCFs are determined, the optimization focus shifts to the wing profile. By comparing the hydrodynamic performance of several different wing profiles at the optimal position, the best wing profile is identified as the optimization outcome. With this step, the comprehensive parameter optimization of the PBCFs is successfully completed.
2.2.2. BPNN Prediction Model
The BPNN serves as a fundamental deep-learning model constructed based on artificial neurons. Its purpose is to address diverse machine learning and artificial intelligence tasks, including classification, regression, pattern recognition, and function approximation [31]. The architecture of this network comprises an input layer, hidden layers, and an output layer. Each neuron in the network receives inputs from the neurons in the preceding layer. These inputs are processed through weighted summation and nonlinear activation functions to produce outputs. Figure 9 illustrates a schematic diagram of the neural network model.
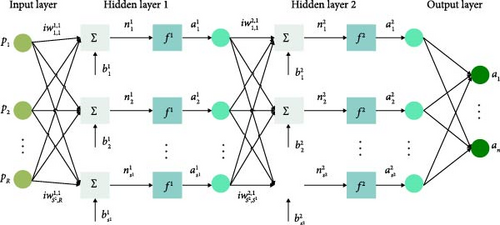
According to the requirements of the prediction task, five input neurons (r, l, φ, β, lc) are employed, and the network’s output is the efficiency η of the propeller under the specified operating conditions. Both input and output data are normalized, with 70% used as the training set, 15% as the validation set, and the remaining 15% as the test set. The network structure significantly influences the prediction performance during the training process. Traditional methods for setting hyperparameters include manual search, grid search, random search, and automated hyperparameter tuning. Grid search involves constructing independent models for all hyperparameters, evaluating the performance of each model, and selecting the hyperparameter values that yield the best results. Given the simplicity and efficiency of grid search, and considering that the parameter selection range in this study is not extensive, grid search is employed to optimize the numerical values of hyperparameters. The grid search is conducted for three key hyperparameters related to the network structure: the number of neurons in the hidden layers, batch size, and learning rate. The number of hidden layers is determined by an empirical method. The search space for each hyperparameter is outlined in Table 5.
| Hyperparameter | Number of hidden layer neurons | Batch size | Learning rate |
|---|---|---|---|
| Value | 3–16 | 12, 24, 48 | 0.001, 0.01, 0.1 |
In BPNN, the weights play a crucial role, representing the strength of connections between neurons. Through the process of gradient descent and backpropagation, the network autonomously learns and adjusts the weights to minimize the loss function, enhancing the model’s performance. During the training process, the loss function quantifies the error between the network predictions and the actual targets.
2.2.3. Northern Goshawk Optimization Algorithm
The Northern Goshawk optimization algorithm is a heuristic optimization technique inspired by the hunting behavior of goshawks [32]. This algorithm is primarily employed to address optimization problems and finds applications in engineering design, machine learning, and other domains. It emulates the hunting strategies of goshawks, continuously iterating and adjusting the search space to seek the optimal solution. The selection process of this algorithm comprises the following two stages [33]:
- (1)
Form a population of goshawks, define the search space, and specify the objective function.
- (2)
Evaluate the fitness of each goshawk to assess the quality of solutions.
- (3)
Observe the positions and directions of neighboring goshawks to determine individual search strategies.
- (4)
Update the positions of goshawks based on their search strategies and compute the fitness of the new positions.
- (5)
Examine whether the stopping criteria are met. If met, output the optimal solution; otherwise, return to step 3.
- (6)
Conduct global and local searches with a certain probability to increase the diversity of exploration.
2.2.4. Error Feedback Mechanism
The error feedback mechanism makes the accuracy and performance of the surrogate model meet the expected requirements by supervising and compensating the difference between the output results of the surrogate model and the real results. In order to quickly obtain the hydrodynamic performance of PBCFs with different configurations, a BPNN surrogate model is established. Due to the small performance difference between the PBCF of the energy-saving devices, an error feedback mechanism is introduced to ensure that the hydrodynamic performance of the new configuration can be accurately predicted during the optimization process.
The flowchart of the error feedback mechanism is shown in Figure 10, where both the agent model and the CFD method are used to calculate the optimal configuration output by the NGO and compare the errors between them. If the error of the output of the surrogate model is within a preset threshold, this indicates that the accuracy of the surrogate model has met the requirements and can be considered credible. However, if the error exceeds the preset threshold, the system introduces additional samples and uses these to further train the neural network model. The process of repeatedly introducing new samples and retraining the model ensures that the surrogate model fits the real data well.

3. Results and Discussion
3.1. Neural Network Fitting Effects and NGO Optimization Results
The root mean square error (RMSE) and coefficient of determination (R2) are commonly employed as pivotal evaluation metrics in appraising the effectiveness of neural network prediction models. RMSE gauges the disparity between the predicted values of the model and the actual values, with a smaller square root indicative of a more precise fit of the model to the data. On the other hand, the R2 furnishes an index of the model’s capacity to expound the variability in the observed data, with its value spanning from 0 to 1. Proximity to 1 signifies a superior ability of the model to elucidate the data.
Figure 11 visualizes the training effect of the BPNN on the sample points of the optimization strategy. The R-value of the BPNN surrogate model is above 0.9 for both the training set and the test set. The RMSE of the test set is 1.3E−04, and the test set data performs well without overfitting.
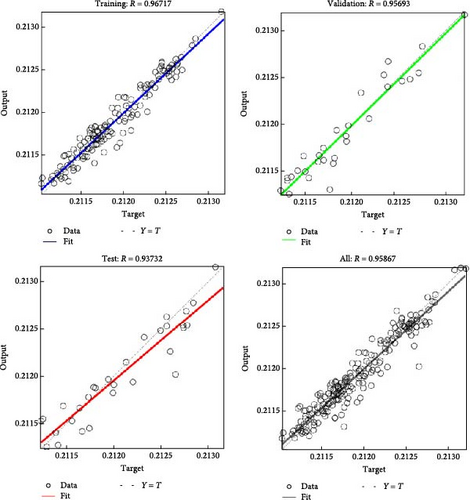
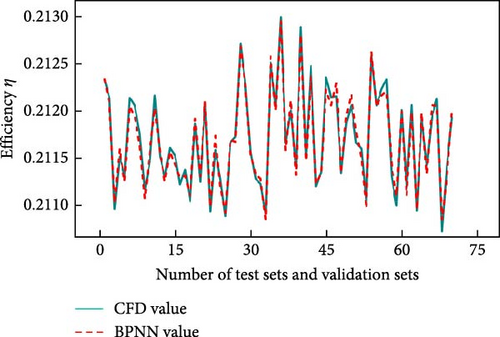
Figure 12 shows the comparison between the neural network prediction results and the CFD calculation results; the two models fit well, and it can be assumed that the BPNN can predict the hidden relationship between the independent variables and the response variables. The surrogate model established in this paper meets the requirements and can replace the cumbersome CFD method.
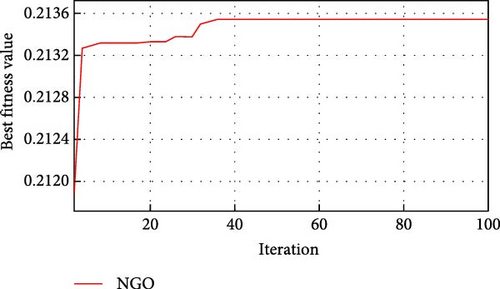
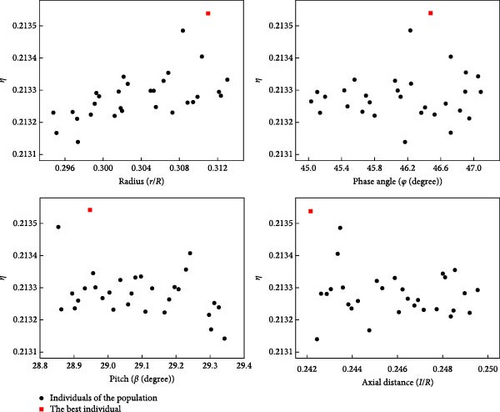
The goshawk population is set to 30, the maximum number of iterations is set to 100, the surrogate model is the optimized fitness-seeking function, and the iteration process is shown in Figure 13. As can be seen from Figure 13, the NGO algorithm stabilizes after about 30 iterations. If the optimization process adopts the CFD method, it will call the CFD software at least thousands of times, which is much larger than the number of times to construct the surrogate model. Figure 14 shows the resultant plots of radius, phase angle, pitch angle, and axial distance for 100 iterations of the NGO algorithm.
3.1.1. Optimized Results Validation and Presentation
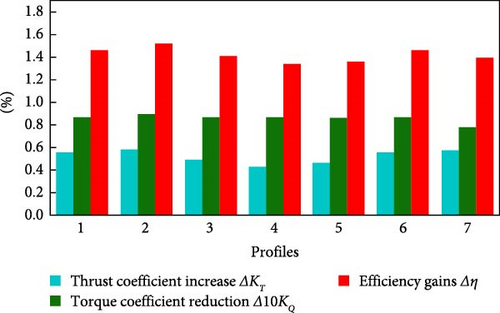
After optimizing the size and installation parameters of the PBCFs using specific strategies, seven different airfoil shapes were selected for further analysis. CFD methods were employed to compare the aerodynamic performance of these seven airfoil shapes. The study focused on determining the reduction in the torque coefficient, increase in thrust coefficient, and efficiency. Figure 15 illustrates the performance of these seven airfoil shapes under the same conditions. Table 6 presents the optimized parameter values and the corresponding energy-saving effects.
| Design parameter | Optimum design |
|---|---|
| Size | |
| Radius (r/R) | 0.311 |
| Chord (l/R) | 0.184 |
| Installation | |
| Axial distance (l/R) | 0.242 |
| Phase angle (φ/°) | 46.470 |
| Pitch angle (β/°) | 28.950 |
| Profiles | GOE 491 |
| Efficiency increment | 1.528% |
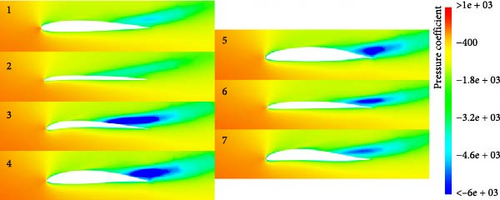
In order to showcase the improved hydrodynamic performance of the optimized airfoils, we extracted the pressure coefficient distribution in the fin end section’s flow field for seven different airfoils at J = 0.2. The lower end of the airfoil, positioned at the back of the propeller and serving as the pressure surface, bears the high-pressure region generated by the propeller. Conversely, the upper-end functions as the suction surface and exhibits a distinct low-pressure region. This low-pressure area can adversely affect propeller thrust due to the pressure difference between the fin and the propeller. Figure 16 reveals a correlation between the strength of the low-pressure zone and the degree and location of airfoil bending. Notably, airfoil GOE491 minimizes the pressure difference between its two sides, resulting in reduced thrust loss from the propeller and thereby enhancing hydrodynamic performance.
The open-water numerical simulations of the propeller and the propeller/optimized fin system were conducted separately using the RANS method. Postprocessing of the flow fields was performed for both cases. Figure 17 illustrates the streamlines behind the hub-cap. It can be observed that when the propeller rotates, due to the fluid viscosity and the induced velocity field created by the propeller, the water flow possesses tangential and axial velocities. Consequently, the streamlines take on a helical shape, converging into a hub vortex at the center of the hub-cap. Within this vortex, the fluid undergoes friction, collisions, and backflow along the propeller axis, resulting in a wastage of kinetic energy. After attaching the optimized fins, these fins absorb the tangential kinetic energy of the water flow and convert it into torque to rotate the propeller blades. As a result, the flow field behind the hub-cap exhibits only axial velocities, causing the streamlines to become straight. The Q-criterion is a method commonly used for visualizing localized flows in rotating machinery such as water turbines, tidal turbine blades, and propellers [34]. The vortex structures shed from the propeller are mainly distributed at the blade tips, the blade root area, and the central region behind the hub. Following the installation of the optimized fins, the central vortex structure behind the hub vanishes, replaced by a reduced number of shed vortices at the tips of the fins.
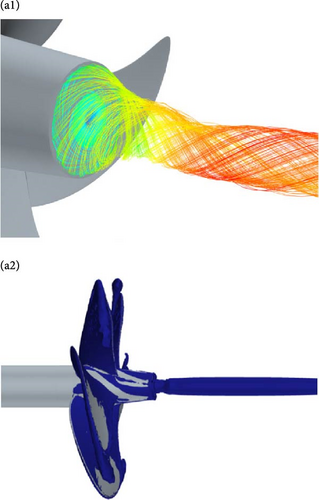

Figure 18 illustrates the pressure distribution on the propeller surface and the cross-section of the flow field behind the propeller, comparing scenarios with and without PBCFs and with optimized fins. It is evident that the incorporation of optimized fins effectively enhances the pressure at the hubcap’s center while mitigating the pressure differential between the propeller’s front and rear ends, thereby augmenting the overall thrust of the system. Analyzing the pressure distribution in the cross-section of the flow field reveals that the presence of optimized fins contributes to the elimination or attenuation of the low-pressure region at the hub’s rear end. This amelioration is primarily manifested through a reduction in the extent of the low-pressure zone and alterations in pressure values, albeit confined to the radius region of the PBCF. The mitigation of the low-pressure region at the flow field’s center becomes more conspicuous with an increase in axial distance.
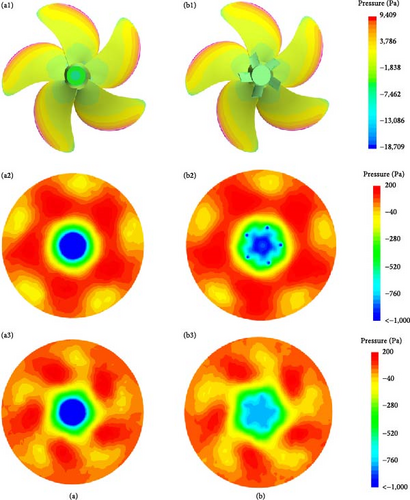
Figure 19 presents a comparative analysis of the velocity flow fields between the two scenarios. It is evident that the PBCF exerts an influence on the flow characteristics in the vicinity of the propeller hub, resulting in a discernible reduction in the flow velocity within the immediate proximity. This velocity loss corresponds to the phenomenon in which the PBCF absorbs the kinetic energy inherent in the water flow, subsequently converting it into an axial reactive force that propels the propeller.


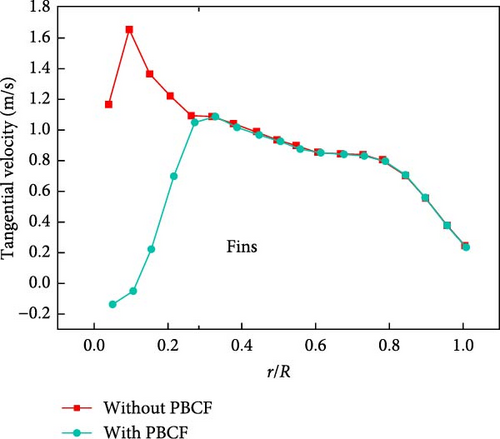
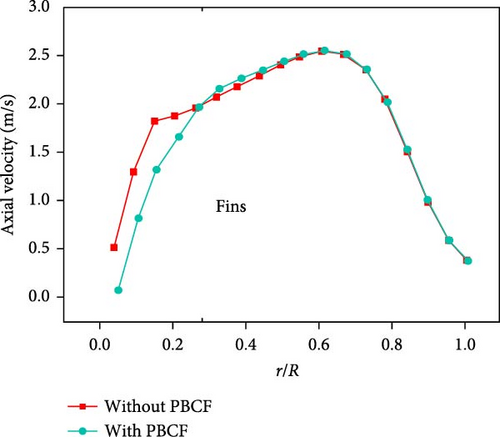
To further investigate the effect of the optimized fins on the flow field behind the blade, the distribution of tangential and axial velocities along the radial direction of the cross-section at the position 0.3D behind the blade disc surface are extracted and analyzed. The distribution of tangential velocity directly reflects the tangential disturbance of the water flow by the propeller, while the axial velocity is related to the magnitude of the hydrodynamic load. Figure 20 shows that both tangential and axial velocities of the flow field behind the hub with the optimized fins are significantly reduced within the radius of the PBCF, especially when the tangential velocity is reduced significantly. It indicates that the PBCF mainly absorbs the tangential kinetic energy from the water flowing through the blade. The optimized fins also cause a weak disturbance to the flow field outside the fin radius region, which increases the axial flow velocity near the radius region by a small amount and solidly improves the system thrust coefficient.
4. Conclusions
- (1)
The BP neural network proposed in this paper, combined with the NGO optimization PBCF strategy, has good global convergence, which allows the design variables to be searched in a large range to approximate the theoretically optimal solution. The establishment of the BPNN approximation model can be a good alternative to the CFD method to complete the hydrodynamic performance calculations of individuals in the population, saving a large amount of numerical computation costs.
- (2)
The PBCFs of the KP505 propeller have been meticulously engineered to achieve optimal design. These optimized PBCFs exhibit the capacity to enhance propeller efficiency by a notable 1.5% under design conditions. Further performance testing conducted under nondesign conditions yielded similar improvements. A visual postprocessing examination unveiled that this notable enhancement primarily stems from the PBCFs’ ability to mitigate the hub vortex, absorbing the tangential velocity of the water flow behind the propeller and subsequently converting it into kinetic energy.
Despite the fact that the optimization method in this study is for the full parameters of the PBCF and achieved good results under specific conditions, the optimization process was only carried out under a single design condition without much consideration of the hydrodynamic performance under multiple conditions. The work done in this paper aims to improve the propeller efficiency, and does not investigate the direction of PBCF structural strength, cavitation performance, and noise performance. In future research, this can be carried out under multiple working conditions with consideration of properties such as noise and cavitation to achieve a comprehensive optimization of multi-objective performance in order to solve the problem of design optimization of energy-saving devices for ships.
Nomenclature
-
- Ae/Ao:
-
- Blade area ratio (−)
-
- a(l):
-
- Output of the neural network (−)
-
- Dω:
-
- Diffusion of specific rate of dissipation (s−1)
-
- d(l):
-
- Desired output value (−)
-
- Erms(l):
-
- Error in training samples (%)
-
- Fp:
-
- Objective function value (−)
-
- Gk:
-
- Generation of turbulent kinetic energy (m2/s3)
-
- Gω:
-
- Generation of specific rate of dissipation (s−1)
-
- gi:
-
- Component of gravitational acceleration (m/s2)
-
- J:
-
- Advanced speed coefficient (−)
-
- k:
-
- Turbulent kinetic energy per unit mass (m2/s2)
-
- l:
-
- Axial distance (m)
-
- lc:
-
- Chord length (m)
-
- Nt:
-
- Number of samples for training (−)
-
- P/D:
-
- Pitch ratio (−)
-
- Q:
-
- Torque (N · m)
-
- R:
-
- Propeller radius (m)
-
- Rc:
-
- The hunting radius of the northern goshawk (−)
-
- r:
-
- Fin radius (m)
-
- Sk:
-
- The source of k (m2/s3)
-
- Sω:
-
- The source of ω (s−1)
-
- T:
-
- Thrust (N)
-
- ui:
-
- Component of fluid velocity (m/s)
-
- VA:
-
- Advance speed (m/s)
-
- X:
-
- The new state of the northern goshawk (−)
-
- Yk:
-
- Turbulent dissipation of turbulent kinetic energy (m2/s3)
-
- Yω:
-
- Turbulent dissipation of specific rate of dissipation (s−1)
-
- y+:
-
- The dimensionless distance of node to wall (−)
-
- Z:
-
- Blade number (−)
-
- ρ:
-
- Fluid density (kg/m3)
-
- Γ:
-
- Effective diffusion coefficient (m2/s)
-
- ω:
-
- Specific rate of dissipation (s−1)
-
- ε:
-
- Error coefficient (%)
-
- φ:
-
- Phase angle ( °)
-
- β:
-
- Pitch angle ( °)
-
- η:
-
- Propeller open water efficiency (%)
-
- μ:
-
- Fluid viscosity coefficient (Pa · s)
-
- Δη:
-
- Changing of η (%)
-
- ΔKT:
-
- Changing of KT (%)
-
- ΔKQ:
-
- Changing of KQ (%)
-
- λ:
-
- Hub diameter ratio (−)
-
- :
-
- Reynolds stress tensor (m2/s2).
Abbreviations
-
- BPNN:
-
- Back-propagation neural network
-
- CFD:
-
- Computational fluid dynamics
-
- EEDI:
-
- Energy efficiency design index
-
- EEOI:
-
- Energy efficiency operational indicator
-
- ESD:
-
- Energy-saving device
-
- IMO:
-
- International Maritime Organization
-
- LHS:
-
- Latin hypercube sampling
-
- MRF:
-
- Moving reference frame
-
- NGO:
-
- Northern goshawk optimization
-
- PBCF:
-
- Propeller boss cap fin
-
- POW:
-
- Propeller open-water
-
- RANS:
-
- Reynolds-average Navier-stokes
-
- RMSE:
-
- Root mean square error
-
- SPIV:
-
- Stereoscopic particle image velocimetry
-
- SST:
-
- Shear stress transport.
Conflicts of Interest
The authors declare no competing financial interests.
Authors’ Contributions
All authors contributed equally to the article.
Acknowledgments
This work was supported by the Guangdong Marine Economic Development Special (JCKY2021414B011) and is gratefully acknowledged.
Open Research
Data Availability
Data are available upon appropriate request from the corresponding authors.


