Impact of Applied Pressure on Tin-Based Cubic Halide Perovskite ASnX3 (A = Li, Na and X = Cl, Br, and I) in Reference to Their Optoelectronic Applications
Abstract
Semiconductor behavior has emerged as a promising substance for numerous advancements in natural energy production, storage, and conversion, as well as in medical technology due to exceptional properties and capabilities of the perovskites. Additionally, this property also presents a great opportunity for solar cells to serve as a substitute for conventional silicon-based photovoltaic systems, as they provide greater efficiency and cost-effective conversion of sunlight to electricity. Here, we are for the first time investigating lead-free environment-friendly cubic perovskites ASnX3 (A = Na and Li; X = Cl, Br, and I) under different hydrostatic pressures ranging from 0 to 5 GPa. Utilizing the GGA + PBE functional method with a space group of 221 (Pm3m), ASnX3 compounds (A = Na and Li; X = Cl, Br, and I) demonstrate direct bandgaps at 0 GPa, ranging from 0.790 to 0.282 eV for Li-based halides and 0.760–0.296 eV for Na-based halides, characterizing their semiconductor nature within the perovskite crystal lattice. Furthermore, our analysis revealed that the conduction band and the valence band intersect at a point above the Fermi level which influences the transition of semiconductor to metal or the creation of a half-metallic state. The optical and structural properties of the compound were also examined, and as the pressure rose from 0 to 5 GPa, the absorption redshift occurred. The analysis of magnetic properties revealed that ASnX3 (A = Na and Li; X = Cl, Br, and I) compounds have diamagnetic behavior in both normal and under pressure conditions. Meanwhile, compounds that satisfy mechanical stability requirements up to certain pressures demonstrate alternations in bulk modulus, shear modulus, and Young’s modulus. The compounds show ductile behavior as their Poisson’s ratio values range between 0.28 and 0.44 for every compound. Increasing pressure increases the values of the compounds, but the compounds remain in the same range of ductile material and show better ductility. Finally, increasing pressure influences the characteristics of the compounds as I-based compounds change phase transitions from semiconductor behavior to metallic behavior. On the other hand, Cl-based and Br-based compounds show semimetallic behavior for increased pressure.
1. Introduction
Cubic halide perovskite has garnered considerable interest among academics because of its diverse and remarkable features, including structural, electrical, optical, mechanical, magnetic, thermodynamic stability, population analysis, and charge density mapping [1]. Scientists are continuously searching for different perovskite materials in the field of photovoltaics [2]. So, the applicability of different types of semiconductor perovskite materials can be a great choice for solar cells [3], light-emitting diodes (LEDs) [4], photodetectors [5], X-ray detectors [6], radiation detection [7], optoelectronic devices [8], sensors [9], energy storage [10], catalysis [11], and many more. The phase transition from semiconductor range to metallic range which increases the application fields for the compounds is calculated using generalized gradient approximation with Perdew–Burke–Ernzerhof (GGA-PBE) functionals.
In our investigation, we utilized the GGA-PBE methodology to study the lead-free cubic perovskites ASnX3 (A = Na and Li; X = Cl, Br, and I) under varying hydrostatic pressures. This choice of methodology aligns with previous research in the field, where density functional theory (DFT) has proven to be a powerful tool for predicting the properties of materials with high accuracy. Notably, Pakravesh and Izadyar [11] in 2024 demonstrated the effectiveness of DFT calculations, specifically employing the PBE functional, in investigating the structural and optoelectronic properties of LiBX3 halide-based perovskites for solar cell applications. Also, Ullah et al. [12] utilized DFT to study lead-free ASnX3 (A = K, Rb) semiconductor materials under pressure conditions, revealing insights into the structural changes and electronic properties induced by external pressure. These studies, along with others in the literature, provide a solid foundation for our choice of methodology, highlighting the reliability and versatility of DFT calculations, particularly when coupled with the GGA-PBE functional, in elucidating the behavior of perovskite materials under varying environmental conditions.
The article titled “Perovskite Solar Cells, an emerging photovoltaic technology” developed by Park [13] offers a thorough examination of the progress, attributes, and prospects of perovskite solar cells. The overview encompasses the historical context, scientific achievements, optoelectronic characteristics of perovskite materials, contemporary advancements in perovskite solar cell research, and the obstacles encountered by the technique [13]. In terms of physical argumentation, the article presents a detailed discussion on the optoelectronic properties of perovskite materials, including their crystal structure, bandgap, absorption coefficient, and electronic band structure. By describing the fundamental principles underlying perovskite solar cell technology, the review satisfies the requirement for physical argumentation by providing a theoretical framework to understand the behavior and performance of perovskite solar cells. Comparing the article with our work titled “Impact of Applied Pressure on Tin-Based Cubic Halide Perovskite ASnX3 (A = Li, Na and X = Cl, Br, and I) in Reference to their Optoelectronic Applications,” both studies contribute to the field of perovskite materials and solar cell technology. While Park’s review provides a broad overview of the status and potential of perovskite solar cells, our work focuses on a specific aspect of perovskite materials—studying the effect of hydrostatic pressure on tin-based cubic halide perovskites. The electrical and optical properties of the lithium (Li)-based perovskite LiBX3 for solar cell applications were recently investigated by Pakravesh and Izadyar [11] using DFTs as their methodology. After looking at the structural, elastic, and optoelectronic properties of lead-free metal-halide perovskites, they concluded that LiBX3 halide-based perovskites were the best kind of perovskites to employ in solar cells and other photovoltaic devices [12]. Using the foundational ideas of DFT, Ullah et al. [12] revisited lead-free ASnX3 (A = K, Rb) eco-friendly semiconductor materials in 2022. As a result of a reduction in bond length, they further demonstrate that the compounds’ lattice constants drop as pressure rises. Additionally, under 5 GPa, all materials have a metallic bandgap, except for chlorine (Cl)-based perovskites. The compound’s optical and structural characteristics were studied, and the redshift of absorption occurred when pressure increased from zero to a greater level [14]. The lead-free combination MSnX3 (M = K, Rb) containing potassium (K) and rubidium (Rb) was the subject of another investigation in 2024 by Rony et al. [14]. Under varying hydrostatic pressures, which lead to a decrease in the lattice parameter and unit cell, they provide predictions about the structural, electrical, bonding, optical, mechanical, and anisotropic elastic constant properties. Utilizing the GGA exchange–correlation functional, the PBE system is put into action. Due to the compounds’ ductile and anisotropic natures, which are strongly affected by external pressure, the researcher’s defined mechanical characteristics were an accurate depiction of these aspects [15]. In 2022, Rashid et al. [15] investigated the properties of rubidium-based halide perovskites RbSnX3 at various hydrostatic pressures ranging from 0 to 10 GPa. The ductile nature of the perovskites is shown by the fact that Pugh’s ratio, Poisson’s ratio, and Cauchy’s pressure all get stronger as the pressure increases. Perovskites also exhibit improved anisotropic behavior as a result of the pressure effect [16]. In 2024, Azeem et al. [17] researched that CsGeCl3, KGeCl3, and RbGeCl3 exhibit direct semiconductor nature with promising energy bandgaps, mechanical stability, and favorable optical characteristic, suggesting their potential for applications in photovoltaics and optoelectronics. But the experiment lacks real-life experiment comparison, which is essential for the enhancement of future experiment validation and for applying in real-life applications [17]. In 2023, Zhou et al. [16] reported structural phase transition and optical properties of RbSnX3 under pressure of 0 and 160 GPa by using the first principles theory. For RbSnCl3, ppPv-Pnma → I4mm → P21/c(III), and, for RbSnBr3, ppPv-Pnma → Pmn21 → ppPv-Pnma(IV) are the two reconstructive phase transitions that the researcher anticipates. For RbSnI3, the two transitions are ppPv-Pnma → Pmn21 → ppPv-Pnma(IV). The findings were comprehensive theoretical guidance and support for enriching the high-pressure phase diagram and diversified properties of halide perovskites under different pressures [18]. The CsSnX3 was studied by Yalameha et al. [18] in 2020 at varying hydrostatic pressures. To find the Z2 topological invariants for every structure, the compositions were studied using the Fu–Kane and Wilson loop techniques, with a bandgap of ≤1.83 eV. Using the semi-infinite Green’s function, the topological surface states (TSSs) of the (001) plane of these substances were studied. Under pressure, these TSSs ensure that CsSnX3 molecules are nontrivial [19]. In 2022, Ur Rehman et al. [19] and Hasan et al. [20] independently researched for an investigation of the semiconductor material like CsSnX3 (X = I, Br, and Cl) and FrBX3 (B = Ge, Sn; X = Cl, Br, and I) perovskite separately for solar cell applications [20, 21].
The purpose of our research is to analyze the various characteristic properties, such as structural, electrical, optical, mechanical, magnetic, thermodynamic stability, population analysis, and charge density mapping of cubic perovskites of LiSnCl3, LiSnBr3, LiSnI3, NaSnCl3, NaSnBr3, and NaSnI3 under different hydrostatic pressures ranging from 0 to 5 GPa. Here, A and B cations occupy specific sites within the crystal lattice, and X anions fill the interstitial spaces. These structures, renowned for their flexibility and tunability, serve as a platform for exploring a wide range of physical phenomena and applications. Through comprehensive first principal calculation and so using DFT GGA-PBE, we seek to unravel for first time the complex behavior of those materials and the impacts of different hydrostatic pressures, offering valuable insights for natural energy and future advancement in perovskite-based technologies.
2. Computational Method
Theoretically, perovskites are based on a combination of methods: DFT, the plane-wave pseudopotential (PW-PP) total energy approach, and the CASTEP code [21]. This computation is grounded in perovskites theory. We investigated the valence electron-ion-core interaction via the Vanderbilt-type ultrasoft pseudopotential [22]. The impact of exchange–correlation can be explored using the GGA and the PBE functional [23]. Differentiating between core states and valence levels is made possible by the plane-wave basis sets 700 eV cutoff energy. To allow for distinct point sampling across the Brillouin zone, the k-point mesh with 8 × 8 × 8 dimensions is utilized [24]. This strategy is implemented using the Monkhorst–Pack approach. Geometry optimization also uses the Broyden–Fletcher–Goldfarb–Shanno (BFGS) reduction method to identify the energy-efficient structure rapidly [25]. The results show that the ionic Hellmann–Feynman force is below 0.03 eV/Å, the biggest displacement is below 0.001 Å, the maximum stress is over 0.05 GPa, and the overall energy difference is over 1 × 10⁻⁵ eV/atom. The expected range included all these numbers. The correct convergence factors were determined by factoring in these numbers. The optimized crystal structure and intriguing physical properties of the perovskite materials under research are examined here in the hydrostatic pressure range of 0–5 GPa. We want to achieve a top performance.
3. Results and Discussion
3.1. Structural Properties
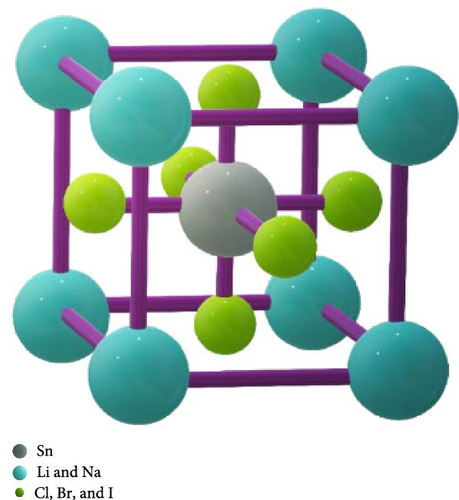
In the space group Pm3m, with the international number 221, there are compounds with the structural equation ABX3. These compounds, along with others, have cubic crystal structures with the 1-a Wyckoff site coordinates (0, 0, 0) and the “A” atom positioned on the cube’s corner [26]. At the 1-b Wyckoff site, which is 0.5, 0.5, and 0.5 from the center of the body, you may find the “B” atom, tin (Sn). At the 3-c Wyckoff site (0, 0.5, and 0.5), face-centered locations indicate the existence of the halogen “X” anion (Cl, Br, and I) [27]. As may be shown in Figure 1, every molecule has a unit cell that contains five atoms. 3D VESTA was utilized to model these crystal structures [28]. Unit cell, lattice constant, and formation enthalpy under normal pressure were the first determinants of the atomic configuration. These results were obtained by subjecting the compound to hydrostatic pressures of 0, 1 2, 3, 4 and 5 GPa. Here, the optimized cell volumes and resultant lattice parameters as a function of pressure were indicated in Table 1. The lattice constant and atomic volume of compounds LiSnX3 and NaSnX3 are affected by the substitution of various halogens (Cl, Br, and I) for X. An “octahedral effect” that affects cell volume is demonstrated by the periodic pattern in the fluctuation of lattice parameters, which is the halide size change. The trend sections corroborate this finding by demonstrating that various perovskite materials exhibit atomic size and charge variations [29, 30, 31].
The same phenomenon is seen when there is a variation in A site, all the values of lattice constant and atomic volume are higher for each halide of sodium (Na) compared to each halide of Li. Because, when Na replaces Li in the crystal lattice, the larger size of the Na+ ion compared to Li+ could lead to a distortion in the octahedral coordination geometry.
| Compound | Calculated data | Pressure (GPa) | |||||
|---|---|---|---|---|---|---|---|
| 0 | 1 | 2 | 3 | 4 | 5 | ||
| LiSnCl3 | a (Å) | 5.577 | 5.523 | 5.448 | 5.386 | 5.335 | 5.288 |
| V (Å3) | 173.428 | 167.504 | 161.695 | 156.257 | 151.805 | 147.849 | |
| ΔEf (eV/atom) | −3.302 | −3.121 | −2.915 | −2.717 | −2.52467 | −2.338 | |
| LiSnBr3 | a (Å) | 5.856 | 5.756 | 5.674 | 5.606 | 5.558 | 5.511 |
| V (Å3) | 200.807 | 190.717 | 182.663 | 176.168 | 171.486 | 167.404 | |
| ΔEf (eV/atom) | −2.981 | −2.737 | −2.504 | −2.281 | −2.085 | −1.886 | |
| LiSnI3 | a (Å) | 6.199 | 6.138 | 6.024 | 5.943 | 5.871 | 5.809 |
| V (Å3) | 238.179 | 228.301 | 218.605 | 209.866 | 202.321 | 195.990 | |
| ΔEf (eV/atom) | −2.592 | −2.343 | −2.063 | −1.796 | −1.538 | −1.290 | |
| NaSnCl3 | a (Å) | 5.560 | 5.484 | 5.418 | 5.362 | 5.315 | 5.271 |
| V (Å3) | 171.901 | 164.922 | 159.085 | 154.132 | 150.152 | 146.438 | |
| ΔEf (eV/atom) | −3.355 | −3.145 | −2.943 | −2.748 | −2.558 | −2.373 | |
| NaSnBr3 | a (Å) | 5.825 | 5.732 | 5.657 | 5.593 | 5.539 | 5.490 |
| V (Å3) | 197.640 | 188.320 | 181.006 | 174.932 | 169.962 | 165.463 | |
| ΔEf (eV/atom) | −3.022 | −2.782 | −2.551 | −2.329 | −2.114 | −1.904 | |
| NaSnI3 | a (Å) | 6.206 | 6.089 | 6.000 | 5.923 | 5.857 | 5.799 |
| V (Å3) | 239.013 | 225.799 | 216.000 | 207.837 | 200.858 | 195.016 | |
| ΔEf (eV/atom) | −2.656 | −2.366 | −2.090 | −1.826 | −1.571 | −1.324 | |
A compound’s formation enthalpy is the change in enthalpy that occurs during the process of converting its individual components into one mole of the compound. The formulation enthalpy (Ef) of the chemical (ASnX3) may be determined using Equation (1). The unit cell’s total energy, abbreviated as Etot, is made up of ASnX3. N is the number of atoms in the cell, and Es (A), Es (Sn), and Es (X) are the energies of the individual atoms Li, Na, bromine (Br), and iodine (I), respectively [32]. By changing the halogen in the compound ASnX3 (A = Na and Li; X = Cl, Br, and I), the structural features and performance of the material, including its electrical, optical, magnetic, and mechanical capabilities, are changed. The formation enthalpy estimates for this material are negative, indicating that it is thermally stable. Table 1 shows the link between the formation enthalpy and the chemical’s hydrostatic pressure; as the pressure increases, so does the formation enthalpy. What this means is that at high pressure, the stability of the molecule ASnX3 (A = Na and Li; X = Cl, Br, and I) is minimized. A decrease in bond length and volume of the unit cell is caused by an increase in pressure on the lattice characteristics of the combination ASnX3 (A = Na and Li; X = Cl, Br, and I). Closer to the nucleus is where an atom’s electrons are placed. The resulting chemical bond between the atoms is stronger. An increase in the formation enthalpy of the molecule occurs because the bond between the atoms in the complex requires more energy to be broken.
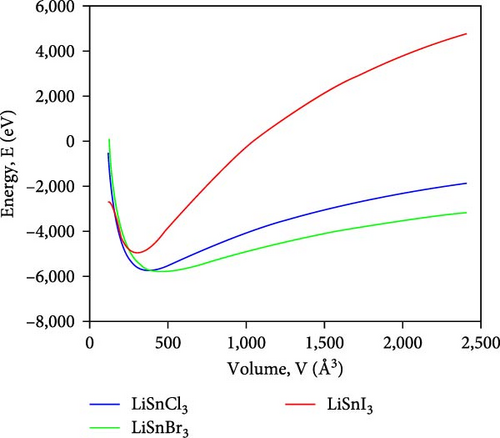
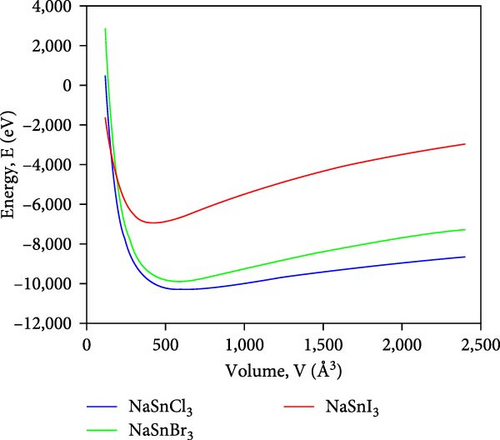
Figure 2 illustrates the variation in energy as it relates to the volume of the lattice for the compounds ASnX3 (X = Cl, Br, and I) and so the decrease in energy as the volume of the unit cell decreases, eventually reaching its minimum value. The optimal volume corresponds to the ground-state energy, which signifies the minimum energy level. However, an increase in system energy leads to a rise in unit cell volume, indicating the system’s lack of stability. This phenomenon indicates that the material becomes energetically disadvantageous and may undergo structural alterations beyond a specific threshold [33].
Das et al. [34] in 2023 illustrated that increasing hydrostatic pressure causes a gradual decrease in lattice parameters of cubic halide perovskites KMCl3 (M = Ge, Sn) which indicates the compression in the crystal lattice. This study also demonstrates the structural response of these compounds according to pressure conditions [34]. The comparison of this work with other published dataset works is given below in Table 2.
| Refs. | Compounds | Parameters | ||
|---|---|---|---|---|
| Lattice constant | Bandgap | |||
| This work | Li-based | LiSnCl3 | 5.577 | 0.79 |
| LiSnBr3 | 5.856 | 0.59 | ||
| LiSnI3 | 6.199 | 0.282 | ||
| [35] | Li-based | LiGeCl3 | 5.190 | 0.792 |
| LiGeBr3 | 5.470 | 0.441 | ||
| LiGeI3 | 5.880 | 0.427 | ||
| This work | Na-based | NaSnCl3 | 5.560 | 0.76 |
| NaSnBr3 | 5.825 | 0.504 | ||
| NaSnI3 | 6.206 | 0.276 | ||
| [36] | Na-based | NaGeCl3 | 5.240 | 0.760 |
| NaGeBr3 | 5.500 | 0.450 | ||
| NaGeI3 | 5.900 | 0.440 | ||
| [37] | K-based | KSnCl3 | 5.596 | 0.89 |
| KSnBr3 | 5.873 | 0.57 | ||
| KSnI3 | — | — | ||
| [38] | Rb-based | RbSnCl3 | 5.581 | 0.878 |
| RbSnBr3 | 5.853 | 0.556 | ||
| RbSnI3 | 6.249 | 0.383 | ||
| [20] | Fr-based | FrSnCl3 | 5.64 | 1.050 |
| FrSnBr3 | 5.90 | 0.670 | ||
| FrSnI3 | 6.27 | 0.420 | ||
As shown in Table 2, the calculated values for the lattice constants and bandgaps under normal stress in this research are almost like those computed in the previous work. The increased lattice constant values for the compounds increased gradually as the halogen site is changed by bigger atoms. The calculated results of this work yield at the comparable nearest values with the same halide-based compounds (Cl, Br, and I) as “A” or “B” site atoms are changed by same Group-I elements. The bandgap values decreased as the lattice constant values increased for the compounds. These bandgap values also satisfy the other works like this work which provides the application fields for the compounds.
- (i)
rA is the ionic radius of the A site cation.
- (ii)
rB is the ionic radius of the B site cation.
- (iii)
rX is the ionic radius of the halide anion.
The calculated tolerance factors for the compounds LiSnX3 (X = Cl, Br, and I) are 0.91, 0.92, and 0.93 for Cl-, Br-, and I-based halides, respectively. These values are slightly lower for NaSnX3 (Cl, Br, and I) as these compounds’ retaining values are 0.85, 0.86, and 0.87, respectively. Typically, materials with a tolerance factor ranging from 0.89 to 1.1 (0.8–1.0 for cubic structure) exhibit a flawless cubic structure; when the values are less than 0.89, then the materials are distorted; and when the value exceeds 1.1, then the compound is unstable [40]. The obtained values for “t” fall within the permissible range for perovskite compounds at ambient and hydrostatic pressure. This indicates that the present compounds are suitable for research.
3.2. Electronic Properties
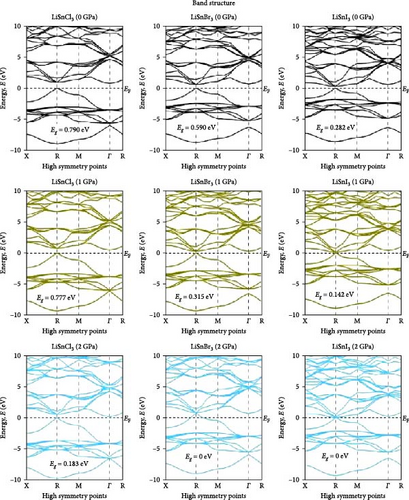
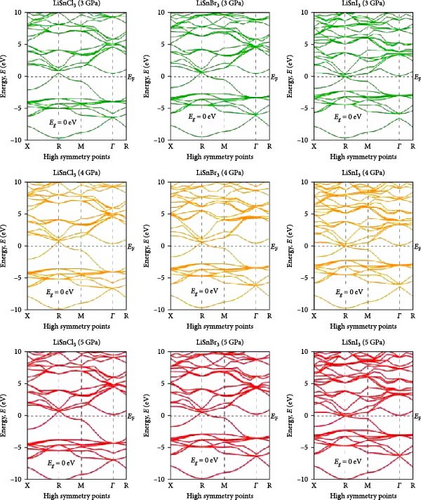
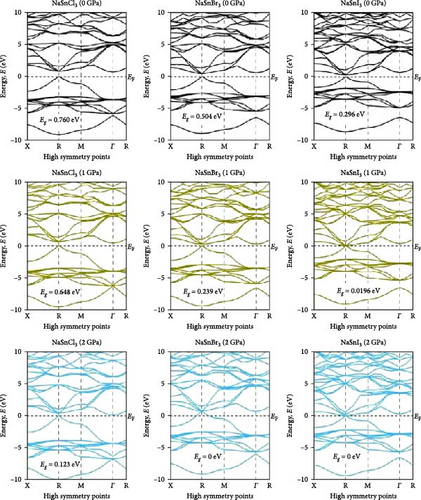
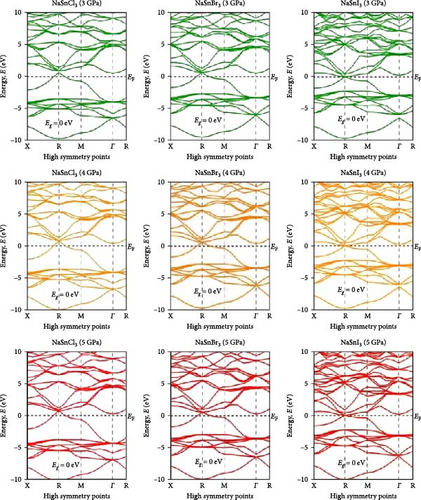
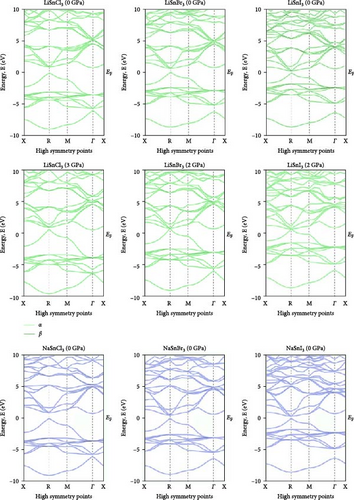
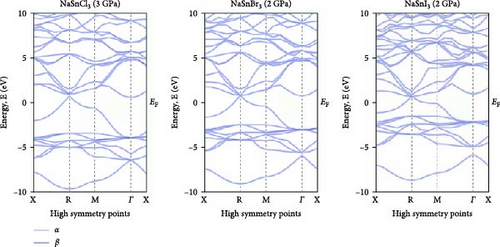
Investigating electrical characteristics is necessary before understanding visual attributes. The electrical characteristics in the high-symmetrical directions of the Brillouin zone are emphasized. The findings from the analysis of the electronic band structures are shown in Figure 3, and the density of states (DOS) of pure ASnX3 (A = Na and Li; X = Cl, Br, and I) compounds is shown in Figure 4. Using the PBE functional under the GGA approximation, this research was carried out [41]. The energy conduction band is shown in the illustration to extend from −30 to +30 eV, and the Fermi level is shown as 0 eV. The bandgap values for all ASnX3 (A = Na and Li; X = Cl, Br, and I) compounds at various pressures are shown in Figure 3. All compounds’ bandgaps were measured, while the pressure was raised from 0 to 5 GPa. External pressure has an inverse effect on the bandgap [42]. The right side of the Fermi level diagram shows the conduction band, and the left side shows the valence band. An important part of understanding a compound’s physical characteristics, according to semiconductor theory, is looking at its material band structure at the Fermi energy level. There is an energy disparity between the conduction and valence bands of a semiconductor, which is called the bandgap. Because of the compounds’ high degree of symmetry, the bandgap is perfectly straight. With the application of pressure, the energy bandgap of every ASnX3 (A = Na and Li; X = Cl, Br, and I) molecule will decrease. And many compounds have distinct bandgaps. Adding a larger atom to a molecule at either the X or A sites reduces its bandgap. Under extreme conditions of stress, the mixture also changes into a conductor. Although I halides (LiSnI3 and NaSnI3) and Br halides (LiSnBr3 and NaSnBr3) exhibit conductive properties at 2 GPa, chlorides (LiSnCl3 and NaSnCl3) need 5 GPa to get the same result. It is also found that Cl- and Br-based compounds have half-metallic properties that undergo a shift of the high symmetry point as they approach the metallic area and continue to experience increasing pressure. The high symmetric point will be higher than the Fermi level when pressure is applied after the bandgap has been zero. Figure 3 shows the band structures of ASnX3 (A = Na and Li; X = Cl, Br, and I) at different pressures.
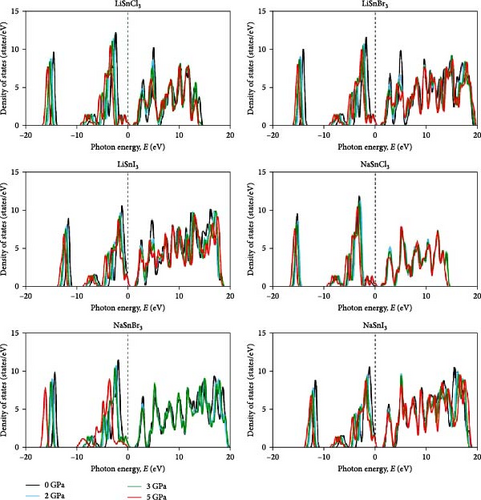
The Fermi level (EF) is shown by the horizontal dashed line at 0 eV. A system’s DOS shows how many states there are at each energy level. The graph’s x-axis shows the electron energy level, while the y-axis shows the number of electron states at that level. To see which states have electrons, move the graph’s peak to the positive side. Vacancies are present in situations where the peak is negative. Figure 4 shows the DOS of ASnX3 (A = Na and Li; X = Cl, Br, and I) at 0, 2, 3, and 5 GPa, which allows us to examine the electronic behavior in the energy range of −10 to 10 eV. Figure 4 shows that the curve forms under pressure do not vary much, indicating that ASnX3 (A = Na and Li; X = Cl, Br, and I) has a stable structure and does not undergo any structural phase shift at the pressures studied. Figure 4 shows that the DOS below the Fermi level is pushed to lower energy, while the states above the Fermi level move to higher energies when the DOS in 0, 2, 3, and 5 GPA is compared. The reduced space between atoms, when subjected to pressure, might explain these phenomena. Khan et al. [43] in 2023 illustrated that increasing hydrostatic pressure leads to a reduction in the bandgap of CsMgI3 perovskite. It enhances the movements of electrons from the valence band to the conduction band. Increasing pressure narrows the bandgap which is accompanied by the conduction band shifts in the band structure and DOS. It results in enhanced conductivity and optical properties and increases the application fields in optoelectronic devices [43].
The charge density plotting for ASnX3 (A = Na and Li; X = Cl, Br, and I) represents irregular charge density lines, which is the indication of covalent bonding. The effect of hydrostatic pressure on charge distribution was investigated at 5 GPa. There is little change in the spherical charge density lines around Li (Na) and X atoms along the (100) plane in Figure 5. Along the (200) plane, the formations around Sn and X atoms become more elliptical, which suggests a stronger covalent bond of Sn─X in Figure 5.
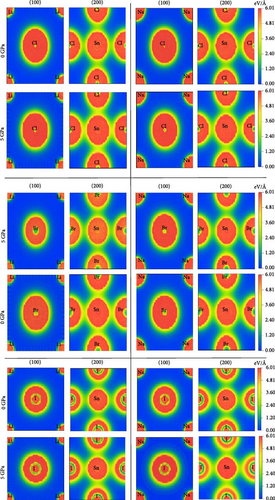
This covalent nature signifies the compounds’ hardness, and the value is consistent with their elastic properties. The local field surrounding the A (Li and Na) and X (Cl, Br, and I) sites represents a hybridization among the states. It also shows that ASnX3 (A = Na and Li; X = Cl, Br, and I) compounds exhibit a covalent bond between A (Li and Na) and X (Cl, Br, and I) atoms. This shows that the covalent bond of Ge─X was weaker and the ionic bond of Li (Na)─X was stronger in the crystal structure of ASnX3 (A = Na and Li; X = Cl, Br, and I), which converges with the charge density mapping of the compounds. The article by Rashid et al. [15] in 2022 investigates the chemical bonding in RbSnX3 (X = Cl and Br) perovskite compounds through charge density mapping, revealing ionic bonding between Rb and Cl/Br atoms and covalent bonding between Sn and Cl/Br atoms at 0 GPa, with pressure-induced reductions in bond lengths reinforcing these bonding characteristics, as observed through increased overlapping of charge density distributions along crystallographic planes (100) and (200) at 10 GPa.
Charge density maps depict the spatial distribution of electron density within the compounds, which are instrumental in elucidating the nature of bonding and electronic interactions. By analyzing these maps, the electron accumulation regions and depletion are identified, thereby gaining insights into the ionic and covalent characteristics of the bonds present. The impact of different alkali metals (Li and Na) and halides (Cl, Br, and I) on electronic properties such as band structure and conductivity is visualized by charge density mapping. The electronic properties of ASnX3 (A = Li, Na and X = Cl, Br, and I) compounds are linked to variations in charge density, which influence the potential applications in optoelectronic devices and energy storage systems [44].
3.3. Optical Properties
Lead-free metal halides are remarkable due to their nontoxicity and excellent optical properties. They are great for solar cells and optoelectronics. Comprehensive research of ASnX3 (A = Na and Li; X = Cl, Br, and I) optical characteristics under pressure may improve optoelectronic device efficiency. The cubic ASnX3 (A = Na and Li; X = Cl, Br, and I) metal halide is inappropriate for perovskite solar cells due to its intermediate absorption and weak optical conductivity. To overcome this constraint and investigate optoelectronic applications, we devised a pressure-based thermodynamic approach. Cubic ASnX3 (A = Na and Li; X = Cl, Br, and I) was studied at hydrostatic pressures up to 5 GPa for its optical characteristics, including absorption, reflectivity, dielectric functions, and optical conductivity. There is a close relationship between the material’s physical characteristics and how electromagnetic radiation reacts to its surface [41]. The reaction to external radiation is totally under the control of energy-dependent properties such as the dielectric function, conductivity, refractive index, reflectivity, and absorption coefficient [42, 45, 46, 47, 48]. The optical absorption coefficient (α) shows how much light energy a substance can absorb. You may use it to find out whether a material is good for high-performance solar panels. The amount of light that a material can absorb is indicated by its absorption coefficient (α) [49]. The relationship between absorption coefficients (α) and bandgap is straightforward. As a result of structural changes to their electrical band, materials may undergo increased absorption when subjected to high pressure. Figure 3 shows that the bandgap between the conduction and valence bands decreases as pressure rises. Less energy is needed for electrons to transition from the valence band to the conduction band, as the bandgap narrows. The material’s absorption properties improve as a result, particularly in the bandgap corresponding wavelength range. Figure 6 shows a comparison of the computed ASnX3 (A = Na and Li; X = Cl, Br, and I) absorptions at different pressures and energies from 0 to 30 eV. The red shift indicates that the bandgap is narrowing as pressure increases, as the absorption edge moves to the low-energy region. This phenomenon was also seen in the other cubic halide perovskite [12, 26, 50]. A narrowing of the bandgap lends credence to this color change. When evaluating a material for use in solar cells, it is essential to look at how it changes from visible light to infrared (IR) rays. Unlike visible light, IR rays are often not absorbed by solar cells to the same extent. Figure 6 shows that, in contrast to other perovskites, this one has a much larger absorption coefficient at lower energies (in the IR energy range) [51]. The distinct electrical and structural characteristics of NaSnX3 (X = Cl, Br, and I) and LiSnX3 (X = Cl, Br, and I) explain why their absorption spectra vary under pressure and in the absence of it. The absorption characteristics of materials are affected by the presence of several components, which change their band structure and energy levels. Compared to all NaSnX3 (X = Cl, Br, and I) halides, all LiSnX3 (X = Cl, Br, and I) halides exhibit a high absorption coefficient at 0 GPa. The electronic band structure is impacted by pressure-induced changes in the crystal lattice. Their absorption characteristics may vary because of differences in how NaSnX3 (X = Cl, Br, and I) and LiSnX3 (X = Cl, Br, and I) react to pressure. As an example, when subjected to pressure, NaSnX3 may show a more noticeable shift in band structure, leading to higher absorption values than LiSnX3. As pressure increases, the absorption value in the visible light band increases substantially, whereas the IR ray band has a larger value. Among all halides, the absorption coefficient for the two compounds based on Cl is the highest. Solar cells made of ASnCl3 (A = Na, Li) may be feasible after all, according to this finding. The maximum absorption grows monotonically and sharply with increasing pressure for all ASnX3 halides (A = Na and Li; X = Cl, Br, and I) at the A site, with distinct ultraviolet (UV) peaks observed for LiSnCl3 at ~15–16 eV, NaSnCl3 at around ~12–13 eV, LiSnBr3 at about ~14–15 eV, NaSnBr3 at around ~12–13 eV, LiSnI3 at about ~11–12 eV, and NaSnI3 at around ~10–11 eV. Both compounds effectively filter UV light at 0 GPa in these conditions. Hydrostatic pressure causes an increase in the optical energy range for all ASnX3 (A = Na and Li; X = Cl, Br, and I) combinations, as seen in the graph. Alam et al. [52] in 2022 demonstrated that applying pressure up to 30 GPa modifies the absorption spectra of KGeF3 and RbGeF3 perovskites which shifts their bandgaps and enhances absorption in the visible light region, and it improves their efficiency for solar energy conversion.
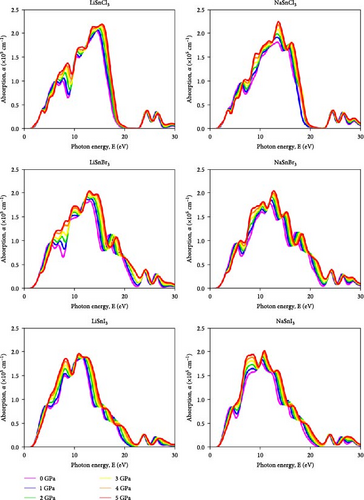
A significant improvement in absorption is also shown by the high-pressure absorption measurements. The optoelectronic device’s performance in the visible and UV regions is improved by this increase in absorption value of ASnX3 (A = Na and Li; X = Cl, Br, and I). In most cases, the rise in absorption spectra is because localized interband transitions become more influential when pressure is applied [53]. As the bandgap of ASnX3 (A = Na and Li; X = Cl, Br, and I) decreases with increasing pressure, the transition of an excited electron from the valence band to the conduction band becomes simpler and quicker [54]. In the visible and UV areas, the absorption coefficient (α) of ASnX3 (A = Na and Li; X = Cl, Br, and I) increases in intensity as the applied hydrostatic pressure increases.
The capacity of a material to carry electric current and its electromagnetic reactivity is studied by measuring its optical conductivity (σ) [55]. Both electrical conductivity and photoconductivity are improved by increasing photon absorption. The material’s improved photon absorption has raised its conductivity. Figure 7 shows the results of applying different hydrostatic pressures and photon energy up to 30 eV to the conductivity spectra of the compound ASnX3 (A = Na and Li; X = Cl, Br, and I). A material’s conductivity is enhanced by the release of free carriers as it absorbs energy. These similarities make it straightforward that the material’s conductivity is proportional to its absorption rate. Analyzing a material’s optical conductivity—its capacity to carry an electric current—was a major focus of the study. All ASnX3 (A = Na and Li; X = Cl, Br, and I) compounds have a conductivity of around 3 S/m at 0 GPa within the ~8–11 eV range. There is little change in conductivity when compounds at sites A and X are changed. At 5 GPa, the conductivity of all compounds reaches its maximum. Islam and Hossain et al. [25] in 2020 demonstrated that increasing pressure on CsSnCl3 perovskite leads to enhanced optical conductivity spectra, attributed to the augmentation of the absorption coefficient with increasing pressure, suggesting a transition from semiconducting to metallic behavior with outstanding optoelectronic properties.
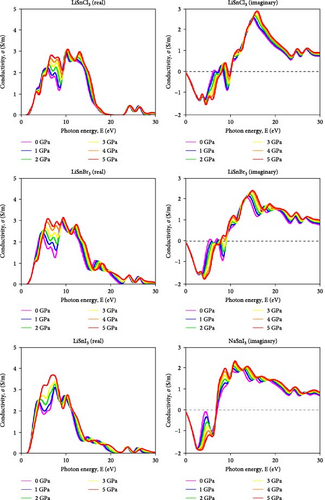
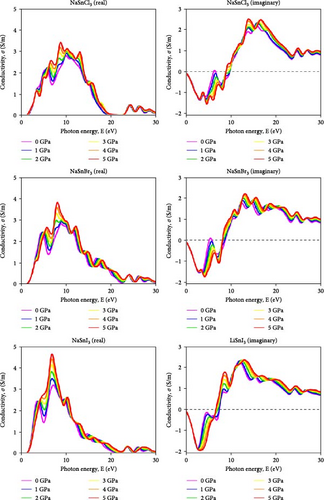
When pressure is applied, the impact of altering the chemical at the A and X sites becomes obvious. The use of Na instead of Li results in a greater rise in conductivity under applied pressure, indicating that bigger size atoms enhance conductivity. Changing X results in the same observation. It displays the greatest increase in conductivity with applied pressure.
All mentioned NaSnI3 displays the greatest conductivity at 0 and 5 GPa. IR optoelectronic devices may use ASnX3 (A = Na and Li; X = Cl, Br, and I) since conductivity is also present at lower energy. The imaginary component of conductivity shows how effectively a material absorbs and releases energy in an electric field. The negative component indicates energy release, which is roughly −2 S/m for all ASnX3 (A = Na and Li; X = Cl, Br, and I) compounds and does not vary with substance or pressure. At 12 eV, all compounds’ conductivity values surpass 2 S/m, indicating enhanced energy absorption. All compounds had conductivity values of about 2.2 S/m at 5 GPa. This research investigated how compounds react to electromagnetic radiation.
In this case, ε1 (ω) and ε2 (ω) represent the real and imaginary dielectric function components, whereas η (ω) and k (ω) represent the refractive index components.
We analyzed optical characteristics such as absorption coefficient, calculated from ε1 (ω) and ε2 (ω). LiSnX3 and NaSnX3 molecules are isotropic and homogenous, according to our research.
Due to this property, its dielectric constant value is independent of the electric field vector direction of the incoming radiation. It is true that the dielectric constant changes as a function of the incoming radiation’s frequency. Figure 8 illustrates that the dielectric function’s real portion ε1 (u) reaches its maximum in LiSnX3 (X = Cl, Br, and I) compounds at around 3 eV, with values of 4.5 F/m for LiSnCl3, 6 F/m for LiSnBr3, and 7.2 F/m for LiSnI3, respectively. The polarization response of the material to incoming radiation is shown by this peak. The energy absorption peak, which is linked to the fundamental bandgap, is located at around 6.5 eV. Figure 9 represents the imaginary portion ε2 (u) which reaches its initial peak at this point. At this peak, LiSnCl3, LiSnBr3, and LiSnI3 all had values of 3.8, 4.6, and 5.8 F/m, respectively. Both LiSnX3 (X = Cl, Br, and I) and NaSnX3 (X = Cl, Br, and I) exhibit stable reactions to radiation, and the substitution of Li with Na has no discernible effect on these properties. In the ASnX3 perovskite compounds where A represents either Li or Na and X denotes Cl, Br, or I, the deviation in dielectric behavior influences the materials’ optical and mechanical properties. The real part of the dielectric constant drops below zero due to electronic interactions within the material. This behavior is observed for the negative dielectric response at certain energy levels, which is influenced by the nature of the electronic band structure and the interaction of charge carriers with the lattice. The antiresonance effects and the strong coupling between the electronic states and the phonon modes in these materials contribute to this phenomenon. Such a negative dielectric constant indicates the presence of metallic or plasmonic behavior, which can significantly affect the material’s optoelectronic properties, making it suitable for applications that leverage these unique characteristics [56].
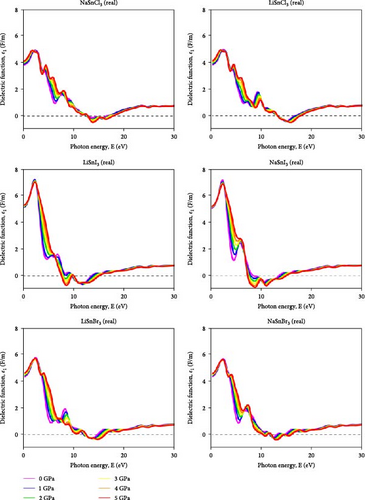
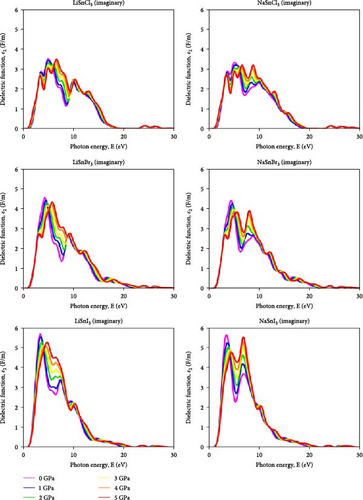
The dielectric response of these compounds is intricately linked to their crystal structure, bonding nature, and electronic configuration. Specifically, the interactions between the A site cations (Li or Na) and the X site halide ions (Cl, Br, or I) play a crucial role in determining the dielectric constant of the material. These interactions can lead to changes in the polarization behavior of the compounds under an applied electric field, affecting their ability to store and transmit electrical energy. Additionally, variations in the size and electronegativity of the halide ions can influence the band structure and optical properties of the perovskite compounds, further impacting their dielectric behavior. Islam and Hossain et al. [25] in 2020 observed that increasing pressure on CsSnCl3 perovskite leads to a rise in the static peak of the dielectric constant which indicates a reduction in charge carrier recombination rate and enhanced efficiency of optoelectronic devices. The imaginary part of the dielectric function increases significantly with pressure that shifts to lower energy regions, suggesting an increase in absorption and transparency in high-energy regions above 26 eV [25].
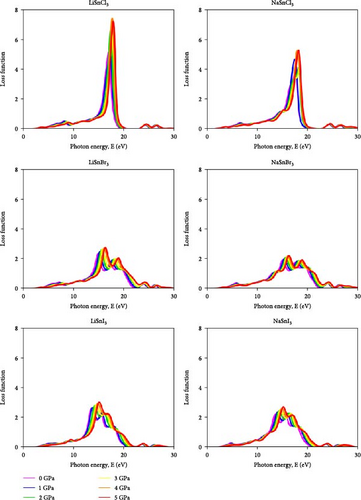
The loss function is used to calculate the amount of energy that a chemical loses during an optoelectronic transition. In this case, the loss function’s value is shown by the graph’s peak. If the peak is greater, then the loss function is bigger. The loss function of a chemical, as seen in Figure 10, normally increases as the pressure increases. The Cl-based compounds LiSnCl3 and NaSnCl3 showed a stiffer and narrower peak, which rose gradually with increasing pressure. Under pressures ranging from 0 to 5 GPa, they achieve a maximum value of around 15–20 eV. In comparison to Cl-based compounds, the loss functions of other halide-based compounds are lower, with Br-based compounds exhibiting the lowest loss functions of all. Altering the A site element also results in a noticeable shift in color. The loss function value is higher for Li-based halides compared to Na-based halides.
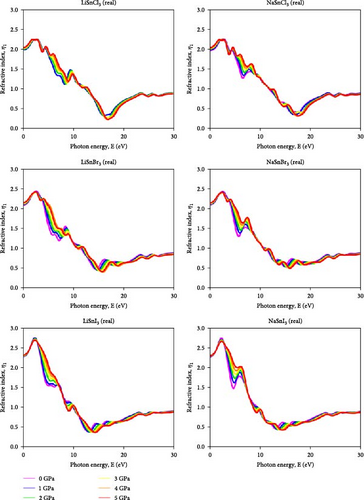
The refractive index is calculated by comparing the incident ray angle (θ) to the refractive ray angle after a substance passes through a medium [57]. The refractive index shows how a substance affects light speed. The imaginary and real refractive index components affect the dielectric function. Part of the refractive index (η1) for ASnX3 (A = Na and Li; X = Cl, Br, and I) compound is illustrated in Figure 11. As energy rises, its value falls. ASnX3 (A = Na and Li; X = Cl, Br, and I) has static refractive index η (0) values of 2, 2.1, and 2.25, which match theoretical and experimental values. The real portion of the refractive index η1 shows electromagnetic wave phase velocity inside a material, whereas the imaginary part η2, extinction coefficient, k, shows wave attenuation. At 3 eV, the refractive index peaks at 2.25 (Cl), 2.5 (Br), and 2.75 (I). This behavior affects light transmission through the material. This shows that pressure increases light confinement and optical density in these materials. The growing refractive index peaks suggest a shift toward higher photon energies, calculating better visible and UV light interaction. Both LiSnI3 and NaSnI3 have the largest refractive index peak under ambient and pressurized circumstances, making them suitable for optical systems with high indices. The imaginary portion of the refractive index presented in Figure 12 for ASnX3 (A = Na and Li; X = Cl, Br, and I) compounds rises from 1 to 1.2 for ASnCl3 (A = Li and Na), 1–1.25 for ASnBr3 (A = Li and Na), and 1.25–1.6 for ASnI3 (A = Li and Na), indicating that hydrostatic pressure increases light absorption capacity. Mitro et al. [58] in 2022 highlighted that increasing pressure on RbGeX3 perovskites (X = Cl and Br) results in a higher static refractive index, indicating greater light absorption potential. This suggests enhanced suitability for optoelectronic and photovoltaic device applications, generating considerable interest among researchers [58].
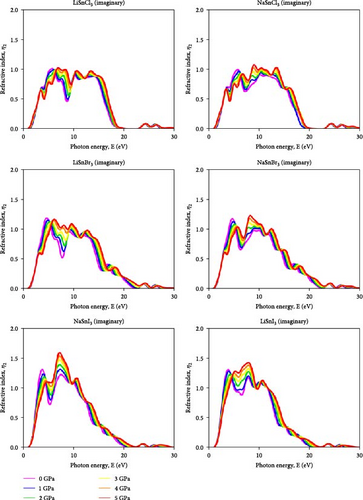
Applying pressure make certain materials better at absorbing photons in the specific energy range. Photodetectors, solar cells, and optical sensors need this property to absorb light. LiSnI3 and NaSnI3 had the greatest imaginary refractive index under ambient and pressured conditions, suggesting efficient light absorption in the given energy range.
One of the most important factors in the photovoltaic performance of perovskite materials is their reflectivity. The low reflectance values over the visible range are shown by the perovskite compounds ASnX3 (A = Na and Li; X = Cl, Br, and I) in Figure 13. For the Cl-based compound, the reflectance is about 11%, for LiSnBr3 and NaSnBr3 it’s between 12% and 15%, and for LiSnI3 and NaSnI3 it’s between 15% and 12%. Within the 10–20 eV range, ASnX3 (A = Na and Li; X = Cl, Br, and I) compounds showed their most prominent peak. The halide-based compound has the most reflective properties among the three. When A site is changed, there is also a change in reflectance. Compounds containing Na exhibit higher reflectivity than those containing Li. Haq et al. [59] in 2021 illustrated that increasing pressure on KCaCl3 perovskite results in a rise in reflectivity in the low-energy region which decreases photovoltaic efficiency. While in the high-energy zone, the material’s reflectivity increases, that suggests better results for solar heating reduction [59].
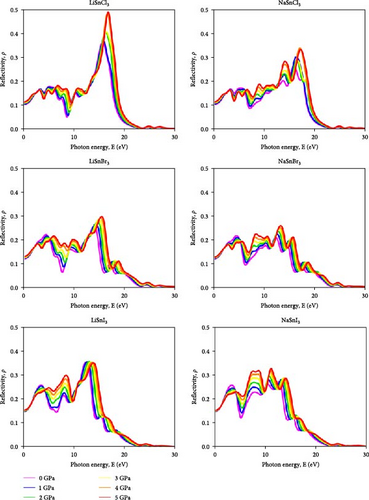
Although it stays in the IR region and grows somewhat for all compounds, the range of the maximum peak is slightly affected by induced pressure. Due to their low ρ values in low-energy areas, both compounds show promise for application in solar cells, even when pressure is present. In addition, these compounds are suggested for application as covering materials to reduce solar heating because of their greater ρ in the high-energy zone [60].
3.4. Mechanical Properties
Table 3 illustrates the elastic constant and Born stability requirement for ASnX3 (A = Na and Li; X = Cl, Br, and I) under various pressures. All chemicals meet the Born stability requirements since their elastic constants are positive up to 3 GPa. When 5 GPa was applied, the 2C44 value went negative for both Cl-based compounds LiSnCl3 and NaSnCl3, meaning they are only stable up to 3 GPa, whereas other halide compounds are mechanically stable up to 5 GPa.
| Pressure | Compounds (B) | |||||
|---|---|---|---|---|---|---|
| LiSnCl3 | LiSnBr3 | LiSnI3 | NaSnCl3 | NaSnBr3 | NaSnI3 | |
| 0 | 40.750 | 17.216 | 42.575 | 25.700 | 18.859 | 15.590 |
| 1 | 20.799 | 21.568 | 14.792 | 26.717 | 23.872 | 19.813 |
| 2 | 27.568 | 25.707 | 21.988 | 30.669 | 26.898 | 23.037 |
| 3 | 31.980 | 28.431 | 26.289 | 34.483 | 31.359 | 26.941 |
| 4 | 35.610 | 30.259 | 30.598 | 38.693 | 35.225 | 31.148 |
| 5 | 39.358 | 33.774 | 32.478 | 41.807 | 38.958 | 35.582 |
Elastic constants computed in this investigation correspond with theoretical results that have been previously established in Table 4. The variables associated with Cauchy pressure matrices (C12–C44) are helpful. A material’s value under Cauchy pressure is used to determine its mechanical characteristics. This could indicate whether the substance is brittle or ductile. Positive values of a matrix reflect the ductility of the material, while negative values point to its brittleness [62]. Table 4 shows that all of the compounds (LiSnCl3, LiSnBr3, LiSnI3, NaSnCl3, NaSnBr3, and NaSnI3) have positive Cauchy pressure values [63], indicating that they all retain their ductility even when hydrostatic pressure is applied.
| Compound | Elastic constants | Pressure (GPa) | |||||
|---|---|---|---|---|---|---|---|
| 0 | 1 | 2 | 3 | 4 | 5 | ||
| LiSnCl3 | C11 | 109.099 | 44.624 | 62.219 | 72.627 | 81.299 | 89.726 |
| C12 | 6.576 | 8.887 | 10.243 | 11.657 | 12.766 | 14.173 | |
| C44 | 2.719 | 2.220 | 1.997 | 1.367 | 0.675 | −0.090 | |
| C12–C44 | 3.857 | 6.667 | 8.246 | 10.290 | 12.091 | 14.263 | |
| LiSnBr3 | C11 | 39.637 | 47.254 | 59.541 | 65.376 | 72.458 | 77.250 |
| C12 | 6.005 | 7.586 | 8.790 | 9.958 | 11.025 | 12.036 | |
| C44 | 2.883 | 2.015 | 1.635 | 1.099 | 0.785 | 0.317 | |
| C12–C44 | 3.122 | 5.268 | 7.155 | 8.859 | 9.869 | 11.719 | |
| LiSnI3 | C11 | 115.510 | 34.676 | 52.621 | 62.753 | 72.699 | 79.379 |
| C12 | 6.108 | 4.850 | 6.672 | 8.057 | 9.548 | 9.028 | |
| C44 | 2.098 | 2.213 | 2.480 | 2.344 | 2.149 | 1.918 | |
| C12–C44 | 4.01 | 2.637 | 4.192 | 5.713 | 7.399 | 7.11 | |
| NaSnCl3 | C11 | 55.240 | 61.286 | 70.686 | 79.725 | 88.635 | 96.571 |
| C12 | 10.931 | 9.432 | 10.660 | 11.861 | 13.723 | 14.425 | |
| C44 | 2.675 | 2.057 | 1.513 | 0.939 | 0.394 | −0.186 | |
| C12–C44 | 8.256 | 7.375 | 9.147 | 10.922 | 13.329 | 14.611 | |
| NaSnBr3 | C11 | 44.679 | 55.692 | 64.259 | 74.013 | 82.622 | 91.268 |
| C12 | 5.949 | 7.961 | 8.218 | 10.032 | 11.526 | 12.803 | |
| C44 | 2.633 | 2.221 | 1.817 | 1.377 | 0.948 | 0.564 | |
| C12–C44 | 3.316 | 5.740 | 6.401 | 8.655 | 10.578 | 12.239 | |
| NaSnI3 | C11 | 37.822 | 48.164 | 57.054 | 66.463 | 67.105 | 85.686 |
| C12 | 4.474 | 5.637 | 6.029 | 7.180 | 8.329 | 10.529 | |
| C44 | 2.654 | 2.507 | 2.445 | 2.363 | 2.297 | 2.206 | |
| C12–C44 | 1.82 | 3.130 | 3.584 | 4.817 | 6.032 | 8.323 | |
Table 5 displays the shear modulus (G) values for all compounds. There seems to be a huge dissimilarity between the shear modulus value of LiSnCl3 and NaSnCl3. At 0 GPa, the shear modulus of LiSnCl3 is 13.256 and 7.297 GPa for NaSnCl3. When the pressure was applied, LiSnCl3 shows a drastic change; at 2 GPa, its shear modulus reduced to 7.380 GPa. After that, further increasing pressure created a minor fluctuation in the value of the shear modulus. But for NaSnCl3, the shear modulus starts increasing gradually with pressure though the changes are not great. Then, the shear modulus value for LiSnBr3 and NaSnBr3 shows similar behavior both increasing with pressure. At 0 GPa, both compounds have a nearby value of shear modulus 6.384 GPa for LiSnBr3 and 6.675 GPa for NaSnBr3, and at 5 GPa, it increased to 6.879 and 8.481 GPa for LiSnBr3 and NaSnBr3, respectively, which indicates NaSnBr3 has higher stiffness than LiSnBr3. LiSnI3 and NaSnBr3 show the same dissimilarity as LiSnCl3 and NaSnCl3. At 0 GPa, the shear modulus of LiSnI3 was 13.275 GPa, and it reduced significantly when pressure was applied. At 2 GPa, it was reduced to 7.267 GPa, and in further increasing the pressure, there was a gentle increase seen in the shear modulus. But for NaSnI3, the shear modulus starts increasing gradually; at 0 GPa, the shear modulus was 6.131 GPa, and it reached 9.946 GPa when 5 GPa was applied.
| Pressure | Compounds (G) | |||||
|---|---|---|---|---|---|---|
| LiSnCl3 | LiSnBr3 | LiSnI3 | NaSnCl3 | NaSnBr3 | NaSnI3 | |
| 0 | 13.256 | 6.384 | 13.275 | 7.297 | 6.675 | 6.131 |
| 1 | 5.949 | 6.596 | 5.325 | 7.431 | 7.183 | 6.942 |
| 2 | 7.380 | 6.872 | 7.267 | 7.676 | 7.600 | 7.751 |
| 3 | 7.613 | 6.764 | 8.021 | 7.837 | 7.927 | 8.507 |
| 4 | 7.611 | 6.821 | 8.673 | 7.936 | 8.169 | 9.264 |
| 5 | 7.453 | 6.879 | 9.152 | 8.004 | 8.481 | 9.946 |
Here, Table 6 displays the Young’s modulus (E) values for all compounds. The Young’s modulus value of LiSnCl3 and NaSnCl3 shows dissimilar behavior which is like bulk modulus and shear modulus. For LiSnCl3, when pressure was applied, the value of Young’s modulus started decreasing drastically and then started increasing slowly, which means induced pressure decreases its ductility significantly. But NaSnCl3’s Young’s modulus starts increasing gradually with pressure. The same phenomena were seen for LiSnI3 and NaSnI3. On the other hand, LiSnBr3 and NaSnBr3 show the same nature for Young’s modulus, which both increase steadily with pressure.
| Pressure | Compounds (E) | |||||
|---|---|---|---|---|---|---|
| LiSnCl3 | LiSnBr3 | LiSnI3 | NaSnCl3 | NaSnBr3 | NaSnI3 | |
| 0 | 35.878 | 17.046 | 36.075 | 19.998 | 17.911 | 16.261 |
| 1 | 16.833 | 17.568 | 14.262 | 20.401 | 19.583 | 18.649 |
| 2 | 20.326 | 18.229 | 19.638 | 21.256 | 20.838 | 20.909 |
| 3 | 21.159 | 18.800 | 21.841 | 21.855 | 21.932 | 23.091 |
| 4 | 21.615 | 19.032 | 23.774 | 22.284 | 22.751 | 24.391 |
| 5 | 21.032 | 19.325 | 25.099 | 22.570 | 23.721 | 27.295 |
Poisson’s ratio (υ) is essential when investigating the malleability and stickiness of a material. Here, Table 7 displays the Poisson’s ratio (υ) values for all compounds. The ductile or brittle characteristics of a compound are determined using the critical value of 0.26 [65]. All the compounds of Table 7 show a common phenomenon. The Poisson ratio of all compounds is above 0.26 which means all compounds are ductile at 0 GPa. When pressure was applied to all of those compounds, the Poisson ratio increased with pressure which indicates that the ductility of the compound increases with pressure. Among all compounds, the Cl- and Br-based compounds show a higher value of Poisson ratio which indicates higher ductility.
| Pressure | Compounds (υ) | |||||
|---|---|---|---|---|---|---|
| LiSnCl3 | LiSnBr3 | LiSnI3 | NaSnCl3 | NaSnBr3 | NaSnI3 | |
| 0 | 0.353 | 0.335 | 0.359 | 0.370 | 0.342 | 0.326 |
| 1 | 0.369 | 0.356 | 0.339 | 0.372 | 0.363 | 3.343 |
| 2 | 0.377 | 0.377 | 0.351 | 0.384 | 0.371 | 0.349 |
| 3 | 0.390 | 0.390 | 0.362 | 0.394 | 0.383 | 0.357 |
| 4 | 0.400 | 0.398 | 0.370 | 0.404 | 0.392 | 0.361 |
| 5 | 0.411 | 0.405 | 0.371 | 0.410 | 0.399 | 0.372 |
The Pugh’s ratio B/G is used to calculate the mode of failure of materials by dividing the bulk modulus (B) by the shear modulus (G). Specifically, Pugh’s ratio B/G, which differentiates between a material’s ductility and brittleness, has a critical value of 1.75 [66]. To the extent that their values are above 1.75, all the compounds in Table 8 are considered ductile. In other words, the ductility of any given compound grows as the pressure increases. The phenomenon is like the Poisson ratio.
| Pressure | Compounds (B/G) | |||||
|---|---|---|---|---|---|---|
| LiSnCl3 | LiSnBr3 | LiSnI3 | NaSnCl3 | NaSnBr3 | NaSnI3 | |
| 0 | 3.074 | 2.697 | 3.207 | 3.522 | 2.825 | 2.543 |
| 1 | 3.496 | 3.270 | 2.778 | 3.595 | 3.324 | 2.854 |
| 2 | 3.736 | 3.741 | 3.026 | 3.995 | 3.539 | 2.972 |
| 3 | 4.201 | 4.203 | 3.278 | 4.400 | 3.956 | 3.167 |
| 4 | 4.678 | 4.436 | 3.428 | 4.876 | 4.312 | 3.391 |
| 5 | 5.281 | 4.910 | 3.549 | 5.224 | 4.594 | 3.577 |
The comparison of mechanical properties of these compounds ASnX3 (A = Li and Na; X = Cl, Br, and I) with other comparable Group-I element-based compounds is illustrated in Table 9. The investigated values of mechanical properties of LiSnX3 (X = Cl, Br, and I) show dissimilar behavior which is like the other works LiGeX3 (X = Cl, Br, and I). The Br-based compound has significantly lower values of Young’s modulus, shear modulus, bulk modulus, Poisson ratio, and Pugh’s ratio compared to Cl-based and I-based halide compounds. But for LiGeX3 (X = Cl, Br, and I), the Br-based compound shows much higher values compared to other halide compounds. As the “A” site atom has changed with bigger size atoms, there is a gradual decrease observed as the halide compound is substituted by bigger atoms. As shown in Table 9, NaSnBr3 has a much lower value of mechanical properties compared to Cl- and I-based halide compounds. Also, these values increased for “A” site Na atom to Fr atom as these atoms are substituted by bigger atoms. Overall, these values indicate the ductility of these compounds which are also similar compared to other compounds.
| Refs. | Compounds | Parameters | |||||
|---|---|---|---|---|---|---|---|
| (G) | (E) | (B) | (υ) | B/G | |||
| This work | Li-based | LiSnCl3 | 13.256 | 35.878 | 40.750 | 0.353 | 3.074 |
| LiSnBr3 | 6.384 | 17.046 | 17.216 | 0.335 | 2.697 | ||
| LiSnI3 | 13.275 | 36.075 | 42.575 | 0.359 | 3.207 | ||
| [35] | Li-based | LiGeCl3 | 13.024 | 33.469 | 23.325 | 0.285 | 1.991 |
| LiGeBr3 | 16.145 | 39.943 | 25.827 | 0.237 | 1.568 | ||
| LiGeI3 | 13.539 | 31.000 | 14.649 | 0.145 | 1.074 | ||
| This work | Na-based | NaSnCl3 | 7.297 | 19.998 | 25.700 | 0.370 | 3.522 |
| NaSnBr3 | 6.675 | 17.911 | 18.859 | 0.342 | 2.825 | ||
| NaSnI3 | 6.131 | 16.261 | 15.590 | 0.326 | 2.543 | ||
| [38] | Rb-based | RbSnCl3 | 9.36 | 24.74 | 23.02 | 0.32 | 2.45 |
| RbSnBr3 | 8.31 | 21.86 | 19.67 | 0.31 | 2.36 | ||
| RbSnI3 | 6.70 | 17.78 | 17.07 | 0.32 | 2.54 | ||
| [63] | Cs-based | CsSnCl3 | 10.20 | 26.61 | 22.70 | 0.3 | 2.22 |
| CsSnBr3 | 8.94 | 23.19 | 19.09 | 0.3 | 2.13 | ||
| CsSnI3 | 7.55 | 16.18 | 6.30 | 0.07 | 0.83 | ||
| [20] | Fr-based | FrSnCl3 | 10.27 | 26.77 | 22.68 | 0.3 | 2.21 |
| FrSnBr3 | 8.75 | 22.78 | 19.18 | 0.3 | 2.19 | ||
| FrSnI3 | 6.55 | 17.08 | 14.350 | 0.3 | 2.21 | ||
3.5. Magnetic Properties
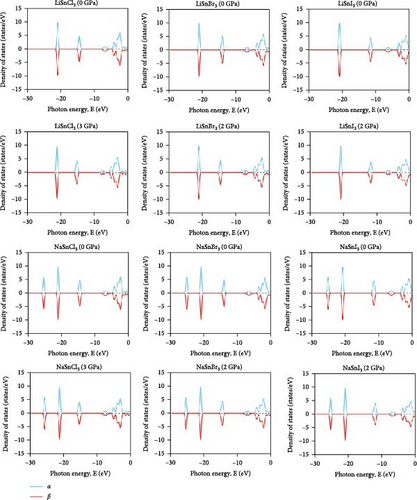
Studying magnetic properties in DFT involves analyzing the electronic structure of materials to understand their magnetic properties. This study unveils the spatial orientation of electron spins within a substance. The crystal lattice demonstrates diamagnetic properties when two spins are aligned in opposite directions, thus canceling out each other’s spin. Upon examining the graph of the band structure in Figure 14, it is evident that the “α” and “β” lines overlap with each other. They lie on the same line, and even after rising hydrostatic pressures, they remain in the same overlaid locations. The electron densities of the ASnX3 (A = Na and Li; X = Cl, Br, and I) combination, where X represents Cl, Br, and I, span a range from −30 to 0 eV, as seen in Figure 15. The “α” and “β” lines correspond to the electron spins, with “α” representing the positive spin and “β” representing the negative spin. The “α” line indicates an upward spin, while the “β” line indicates a downward spin. These two lines exhibit perfect symmetry and are exact reflections of one another. According to the results, the compounds exhibit diamagnetic characteristics when subjected to a magnetic field. In the DOS graphs, the number of electrons that may occupy a given state is shown vertically, while their energy level is shown horizontally. Positive DOS refers to states occupied by electrons, whereas negative DOS refers to states filled by holes. As the pressure varies from 0 to 5 GPa, the energy levels of the compounds ASnX3 (A = Na and Li; X = Cl, Br, and I) show negligible fluctuation in the highest peak, but they stay constant across the α and β states of the material. Therefore, the compounds’ diamagnetic behavior is unaffected by the application of pressure. No matter how much pressure is applied, the material’s magnetic properties will not change.
3.6. Population Analysis
In DFT, population analysis derives a system’s total electron density into parts that come from different types of atoms or molecules. The ASnX3 (A = Na and Li; X = Cl, Br, and I) chemical population study seems to be linked to these results. The distribution changes at pressures from 0 to 5 GPa. Table 10 shows that when the compounds are under strain, their electronic structures may alter. Amounts of electron density that spill between atomic species may be measured by the changing spilling percentages. Rather moderate, ranging from 0.19% to 0.22%, is the change spilling for LiSnBr3 overall pressures. While LiSnI3 may have a range of 0.22%–0.27%, LiSnCl3 can have a range of 0.22%–0.26%. Atomic populations for Sn, Cl, and Li in LiSnCl3 are 1.89, 1.96, and 2.09 at 0 GPa, respectively; however, at 5 GPa, these numbers undergo a little modification to 1.80, 1.96, and 2.11. As the pressure increases, the atomic populations of LiSnBr3 and LiSnI3 change noticeably. The bonding is significantly impacted by variations in the halogens (Cl, Br, and I), but the d populations of Sn are constant in all compounds. Observed shifts in Mulliken populations at 0 GPa point to changes in the electron distribution within the pressurized compounds. These changes might be species-specific or influenced by environmental factors. While halogen atoms (Cl, Br, and I) exhibit varying degrees of population for each compound at 0 GPa, the populations reveal that Sn atoms, particularly in the p and d orbitals, contribute the most. Pressures up to 5 GPa cause a little rearrangement of the populations, with Sn populations remaining mostly unchanged and halogen populations seeing small changes. Hirshfeld charges of these compounds also exhibit variations. For LiSnCl3, the Hirshfeld charge for Sn, Cl, and Li at 0 GPa is 0.88, −0.54, and 0.73, respectively, and at 5 GPa, these values reached 0.85, −0.51, and 0.67. These shifts in charges indicate the redistribution of charges within the compounds due to applied pressure. There are noticeable differences in atomic populations and charge distributions between LiSnX3 (Cl, Br, and I) and NaSnX3 (Cl, Br, and I). These changes in atomic populations and charges highlight the compounds’ response to pressure, indicating potential alterations in their electronic and structural properties under different pressures.
| Compound | Pressure | Change spilling | Species | Muliken atomic populations | Muliken change | Hirshfeld change | ||||
|---|---|---|---|---|---|---|---|---|---|---|
| s | P | d | f | Total | ||||||
| LiSnCl3 | 0 | 0.22% | Sn | 1.89 | 1.23 | 10.00 | 0.00 | 13.12 | 0.88 | 0.30 |
| Cl | 1.96 | 5.58 | 0.00 | 0.00 | 7.54 | −0.54 | −0.26 | |||
| Li | 2.09 | 0.18 | 0.00 | 0.00 | 2.27 | 0.73 | 0.46 | |||
| 5 | 0.26% | Sn | 1.80 | 1.35 | 10.00 | 0.00 | 13.15 | 0.85 | 0.22 | |
| Cl | 1.96 | 5.55 | 0.00 | 0.00 | 7.51 | −0.51 | −0.21 | |||
| Li | 2.11 | 0.21 | 0.00 | 0.00 | 2.33 | 0.67 | 0.38 | |||
| LiSnBr3 | 0 | 0.19% | Sn | 2.11 | 1.45 | 10.00 | 0.00 | 13.55 | 0.45 | 0.25 |
| Br | 1.87 | 5.51 | 0.00 | 0.00 | 7.37 | −0.37 | −0.24 | |||
| Li | 2.10 | 0.22 | 0.00 | 0.00 | 2.32 | 0.68 | 0.45 | |||
| 5 | 0.22% | Sn | 1.99 | 1.63 | 10.00 | 0.00 | 13.62 | 0.38 | 0.16 | |
| Br | 1.84 | 5.48 | 0.00 | 0.00 | 7.32 | −0.32 | −0.18 | |||
| Li | 2.14 | 0.29 | 0.00 | 0.00 | 2.42 | 0.58 | 0.35 | |||
| LiSnI3 | 0 | 0.22% | Sn | 1.91 | 1.70 | 10.00 | 0.00 | 13.61 | 0.39 | 0.17 |
| I | 1.93 | 5.41 | 0.00 | 0.00 | 7.34 | −0.34 | −0.21 | |||
| Li | 2.12 | 0.24 | 0.00 | 0.00 | 2.36 | 0.64 | 0.44 | |||
| 5 | 0.27% | Sn | 2.11 | 1.93 | 10.00 | 0.00 | 14.04 | −0.04 | 0.09 | |
| I | 1.80 | 5.36 | 0.00 | 0.00 | 7.16 | −0.16 | −0.14 | |||
| Li | 2.16 | 0.32 | 0.00 | 0.00 | 2.48 | 0.52 | 0.33 | |||
| NaSnCl3 | 0 | 0.19% | Sn | 1.85 | 1.24 | 10.00 | 0.00 | 13.10 | 0.90 | 0.30 |
| Cl | 1.96 | 5.57 | 0.00 | 0.00 | 7.53 | −0.53 | −0.25 | |||
| Na | 2.10 | 6.20 | 0.00 | 0.00 | 8.30 | 0.70 | 0.44 | |||
| 5 | 0.22% | Sn | 1.75 | 1.37 | 10.00 | 0.00 | 13.12 | 0.88 | 0.22 | |
| Cl | 1.96 | 5.55 | 0.00 | 0.00 | 7.50 | −0.50 | −0.20 | |||
| Na | 2.13 | 6.24 | 0.00 | 0.00 | 8.37 | 0.63 | 0.38 | |||
| NaSnBr3 | 0 | 0.16% | Sn | 2.06 | 1.47 | 10.00 | 0.00 | 13.52 | 0.48 | 0.24 |
| Br | 1.86 | 5.50 | 0.00 | 0.00 | 7.36 | −0.36 | −0.22 | |||
| Na | 2.12 | 6.28 | 0.00 | 0.00 | 8.41 | 0.59 | 0.43 | |||
| 5 | 0.19% | Sn | 1.90 | 1.64 | 10.00 | 0.00 | 13.54 | 0.46 | 0.16 | |
| Br | 1.84 | 5.47 | 0.00 | 0.00 | 7.31 | −0.31 | −0.17 | |||
| Na | 2.15 | 6.37 | 0.00 | 0.00 | 8.52 | 0.48 | 0.36 | |||
| NaSnI3 | 0 | 0.18% | Sn | 1.90 | 1.70 | 10.00 | 0.00 | 13.60 | 0.40 | 0.18 |
| I | 1.91 | 5.42 | 0.00 | 0.00 | 7.33 | −0.33 | −0.20 | |||
| Na | 2.13 | 6.28 | 0.00 | 0.00 | 8.41 | 0.59 | 0.42 | |||
| 5 | 0.24% | Sn | 2.05 | 1.94 | 10.00 | 0.00 | 13.99 | 0.01 | 0.09 | |
| I | 1.79 | 5.36 | 0.00 | 0.00 | 7.16 | −0.16 | −0.14 | |||
| Na | 2.17 | 6.37 | 0.00 | 0.00 | 8.54 | 0.46 | 0.33 | |||
4. Conclusion
This study investigates DFT calculations and explores the response of ASnX3 (A = Na and Li; X = Cl, Br, and I) to various hydrostatic pressures. The research shows a decrease in both cell volume and lattice constant as the hydrostatic pressure is increased from 0 to 5 GPa. For both the LiSnX3 and NaSnX3 (X = Cl, Br, and I), the unit cell volume decreases gradually. The lattice constant also decreases, respectively, from 5.577 Å to 5.288 Å for LiSnCl3, from 5.856 Å to 5.511 Å for LiSnBr3, and from 6.199 Å to 5.809 Å for LiSnI3. The same effect is observed for NaSnX3 (where X = Cl, Br, and I) when pressure is applied to the compounds. At 0 GPa pressure, the LiSnX3 (X = Cl, Br, and I) compounds exhibit different bandgaps: 0.79, 0.59, and 0.282 eV, and the NaSnX3 (X = Cl, Br, and I) compounds show 0.760, 0.504, and 0.296 eV, respectively. As the hydrostatic pressure increases, the bandgap significantly decreases which leads to a transition from a semiconductor to a metallic state. This transition improves the optical characteristics of the compounds, making them applicable materials for solar panels. At ambient pressure, ASnX3 (A = Na and Li; X = Cl, Br, and I) compounds exhibit a ductile nature, as evidenced by their Cauchy pressure, Poisson’s ratio, and Pugh’s ratio. As pressure increases, the compounds become even more ductile, reflecting the influence of pressure on their mechanical properties. Additionally, the anisotropic nature of the compounds further supports their ductile behavior. An extensive analysis of various mechanical parameters provides insights into the potential adaptability of these halide perovskites in practical applications. Also, the mirror-like graphs observed in the DOS for the upward and downward spin of electrons indicate diamagnetic behavior, and this behavior remains pressure-independent as it doesn’t change with the change of pressure. Increasing pressure induces phase transitions in ASnX3 (A = Na and Li; X = Cl, Br, and I) compounds, with I-based compounds shifting from semiconductor to metallic behavior, while Cl-based and Br-based compounds display half-metallic behavior.
Ethical Approval
All procedures performed followed ethical standards.
Conflicts of Interest
The authors declare that they have no competing interests.
Authors’ Contributions
M. D. Ratul Hasan contributed to the methodology, data curation, formal analysis, and writing of the original draft; Imtiaz Ahamed Apon contributed to formal analysis, conceptualization, writing the original draft, and reviewing and editing of the manuscript; Istiak Ahmed Ovi contributed to data curation; and Fatema-Tuz-Zahra helped to supervise and contributed to formal analysis through the whole research.
Acknowledgments
This work was carried out at Computational Materials Science Laboratory, Department of Materials Science and Engineering, Khulna University of Engineering and Technology (KUET), Khulna 9203, Bangladesh.
Open Research
Data Availability
The data that support the findings of this study are available on request from the corresponding author. The data are not publicly available due to privacy or ethical restrictions.


