An Improved Boundary Element Method for Predicting Half-Space Scattered Noise Combined with Permeable Boundaries
Abstract
The boundary element method is widely used in practical engineering problems, especially in the field of acoustics. For flow-induced noise, the main target of acoustic calculations is to solve the wave equation with the flow field information. However, the sound field distribution of noncompact structures in half-space is especially complex because of the strong scattering effect, while the object surface boundary integration often brings a large workload and generates numerical singularities. In this paper, an improved boundary element method for predicting the aeroacoustic noise of noncompact structures is proposed, which can consider the characteristic distribution of sound field induced by complex structures in half-space. The smooth permeable boundary surrounding the object is used as the integration boundary, while the scattering effect of the ground boundary is investigated by combining the mirror Green’s function method, and the numerical prediction of aeroacoustic noise is carried out for the dipole source and NACA0012 airfoil in half-space. Numerical results show that the far-field noise obtained by using the permeable surface is consistent with that obtained by integrating the direct object boundary under the influence of ground boundary scattering. The mirror image Green’s function method is able to finely capture the ground scattering effect, which has a significant effect on the sound field as the frequency increases.
1. Introduction
The contact between fluids and noncompact structures inside the half-space is a significant source of noise pollution. This is particularly evident during the take-off and landing stages of aircraft, the operating phase of high-speed trains, and the power generation process of wind turbines. In these practical engineering problems, the scattering effect caused by the ground may be much greater than that caused by the body surface. Recently, the international community has reached a consensus on the need to restrict noise levels in various areas such as transportation, building construction, traffic arteries, and residential areas. Corresponding legal provisions have been put forward [1, 2]. The hybrid computational aeroacoustic (HCAA) method is a new computational method that has been widely used in the numerical prediction of flow-induced noise due to its high computational efficiency and low complexity in practical engineering fields.
The HCAA methodology solves the flow field and the acoustic field separately, and the flow field calculation partly combines CFD techniques to solve the N-S equation and collect the flow sound sources, and integration methodology [3, 4] is used to calculate noise distribution, which has become the mainstream method for far-field noise calculation. Lighthill’s acoustic theory [5], FW-H equation [6], vortex theory [7], and Kirchhoff theory [8] are commonly used in noise calculations. Among them, the FW-H equation is the most classic and widely used. Research scholars have carried out a series of extended research work based on the FW-H equation. Khalighi et al. [9] proposed an acoustic integral model of the disturbance variables by separating the acoustic variables from the fluid physical variables. Mao et al. [10] studied the far-field noise distribution in combination with the proposed acoustic two-step calculation method. Their method can predict the noise in low Mach number flow but cannot distinguish radiated and scattered noise, especially for noncompact bodies. In contrast, we proposed a unified integral calculation method for the radiation and scattering aeroacoustic noise of noncompact bodies in our previous research [11, 12]. In both near field and far field, this method is able to distinguish between scattered and radiated noise. Meanwhile, permeable boundaries [12, 13] are used to improve the calculation of acoustic noise for complex structures.
Based on the above model, the boundary element method (BEM) [14, 15, 16] is extensively used to calculate the acoustic noise induced by noncompact noise in free space. Several improved methods have been presented, such as fast multipole BEM [17, 18], nearly singular integrals (NSIs) in BEM [19], BEM for scattering problems [20], etc. However, previous research has either focused solely on the problem of sound propagation or has not taken into account the scattering effect of the actual sound source, particularly in half-spaces. Numerical studies have concentrated on capturing the scattering effect induced by the ground boundary for flow-induced noise problems in half-spaces.
When considering the effect of acoustic scattering, most studies focus solely on the noise generated by the structure itself. Lee [21] and Lee et al. [22] developed a numerical method to analyze acoustic scattering in the time domain and its application to rotorcraft noise. Poggi et al. [23] conducted a theoretical–numerical study on noise scattered by moving bodies in combination with the boundary integration method. Testa et al. [13] present two novel permeable-surface integral formulations to calculate the sound scattered by moving bodies. The study by Williams and Hall [24] shows that when the product of the distance r0 from the center of the vortex structure inside the half-space to the space boundary and the wave number k satisfies 2kr0 ≤ 1, the scattering noise generated by the noise reflection from the quadrupole to the space boundary is proportional to (kr0)−3.
Therefore, calculating the scattering effect at the half-space boundary is crucial. Previous research has mainly focused on selecting a Green’s function compatible with the geometry [25, 26]. For instance, in a half-space model, combining Green’s functions that satisfy complex boundary conditions can efficiently capture the scattering effects at the spatial boundary. Calculating numerical integration of aeroacoustic noise can be challenging due to the involvement of first and second-order derivatives of Green’s functions. Exact Green’s functions require significant computational effort, and numerical errors caused by singularities in the solution of Green’s functions and their derivatives [27] can distort noise results for fine meshes near walls, particularly for complex noncompact structures. Therefore, using the BEM directly to calculate noise may cause numerical singularity problems and result in increased numerical errors.
To address the aforementioned issues, this paper proposes an improved BEM to calculate flow-induced noise, taking into account the ground scattering effect, which is different from the previous studies. First, an integral model of the acoustic perturbation variables is established based on the pulsation decomposition of the physical quantities of the flow field. Second, a half-space acoustic noise integral calculation model combined with the permeable surface is developed, which takes into account the scattering effect of the ground boundary using the mirror Green’s function. Theoretical presentation of the singular integral of Green’s function based on boundary element discretization is also included. Third, the noise propagation of a stationary dipole source is calculated and compared with the analytical solution. The NACA0012 airfoil was selected as the numerical research object to study acoustic noise induced by the fluid. The present two-step calculation, based on second-order fluid calculation, was adopted to carry out the noise calculation. The conclusions were finally given.
2. Acoustic Integral Equations for Noncompact Bodies with Permeable Boundaries
When choosing the integral boundary as the surface of the object, S coincides with SW. Otherwise, S is away from SW. The key derivation process of Equation (5) can be found in the Appendix. The noise calculation is performed in two steps: the acoustic pressure in the near field is first calculated when the observer is located at the object surface or permeable boundary, then the far-field noise distribution is studied. The left-hand side (L.H.S.) of Equation (5) represents the pressure fluctuation, and the right-hand side (R.H.S.) includes all of the source terms.
Using the point source as an example, Figure 1 shows the distribution characteristics of half-space airfoil noise combined with a permeable boundary. In actual conditions, the total pressure at observer x can be described by three parts: the radiated noise from y to x, the scattered noise from y to zw then to x, a and the scattered noise form y to the half-space Sb then to x. However, integration calculations for infinitely long ground boundaries often result in a significant workload. This problem can be overcome by using mirror image sources.
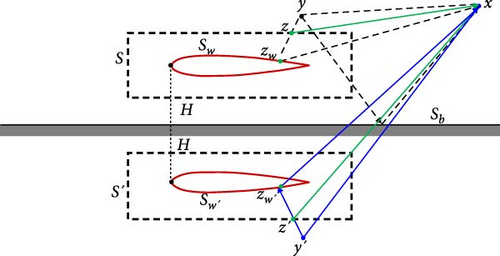
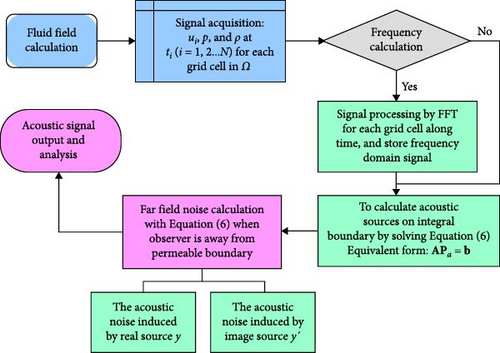
The following section introduces the algorithm step of Equation (7). Numerical simulation for noise calculation is primarily executed using the integral equation and boundary element method described above. The specific steps of the present method are shown in Figure 2. In fluid field calculation, the flow field area and integral boundary are discretized into M grids and L elements, respectively. Fluid variables such as density, pressure, and velocity are stored over time for each grid cell, with each cell considered an acoustic source.
3. The Near Singular Integral on Discrete Boundary Elements in Two-Dimension
The fluid field calculation to obtain sound sources must be performed prior to noise calculations, including pressure, density, and velocity vectors. To calculate this information, a fine mesh is typically used near the noncompact body, which contains a large number of sound sources. However, if the observer z is situated on the surface of the object or permeable boundary, the distance r = |z − y| between the observer z and the sound source y is extremely small. In the volume integral calculation, the magnitude of the second-order derivative for Green’s function is ∼1/|z − y|2, and it is a nearly hypersingular integral problem.
Although the volume integral can be converted to an area integral using the generalized Gauss theorem, it remains a nearly strongly singular integral problem. This type of integral often results in significant numerical errors when conventional Gaussian numerical integration is used. To ensure the accuracy of the aircraft noise prediction, the NSI problem must be solved. The paper draws on the research idea for the 3D NSI problem [29] and proposes a semi-analytic method for NSI kernel function decomposition in free space. This involves decomposing the kernel function into non-nearly singular and nearly singular parts.
The second and third terms can be analytically solved for linear boundary elements. When the observer is located on the body surface, permeable boundary, or in the near field, the volume and surface integral calculation can be carried out by Equation (20), which greatly improves the accuracy.
When k is satisfied with k ≥ 10, the free Green’s function is G(x, y, ω) ≈ gk(x, y).
4. Numerical Simulations
The flow/surface interaction noise generated by a noncompact body is chosen to verify the newly presented method. First, the analytical model of the dipole source is studied to investigate the influence of different permeable boundaries and the difference between free-space noise and half-space noise. Then, flow-induced noise predicting always chosen the wing airfoil and landing gear to study the acoustic scattering effect during the take-off and landing of an aircraft. 2D circular cylinder and NACA0012 airfoil are considered in the following paper; the scattering effect and the validity of permeable boundary are mainly studied and discussed.
4.1. Stationary Dipole Source in Half-Space
The potential amplitude is A = 1 m2/s, the sound speed is c0 = 340 ms−1, and the emission frequency ω is 10π rad/s.
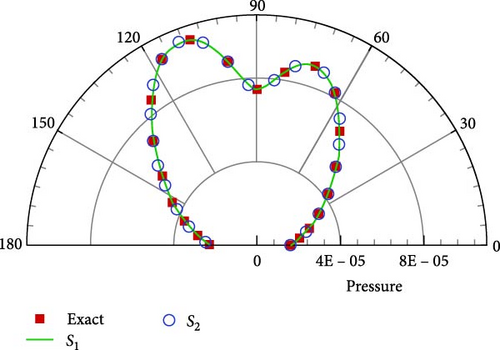
The observation position x is located on a circle in the x–y plane with geometrical distance L from the dipole source. The ground boundary is below the dipole source with the distance H, the imaginary dipole source was located at (y1, y2 − 2H, y3) corresponding to a dipole source placed at (y1, y2, y3). The permeable boundary is chosen as a spherical surface surrounding the dipole source with a different radius, R. In this example, H is equal to 10l. The radius of the permeable boundary S1 and S2 correspond to R1 = 3l and R2 = 6l, respectively, and the root mean square (RMS) pressure at the observer is used here.
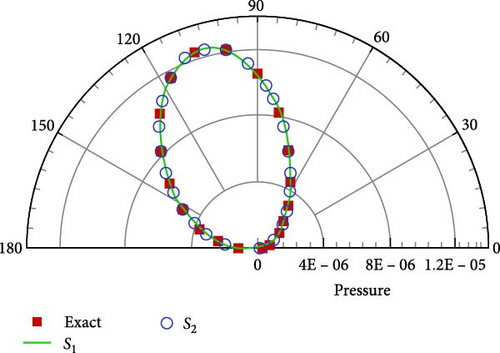
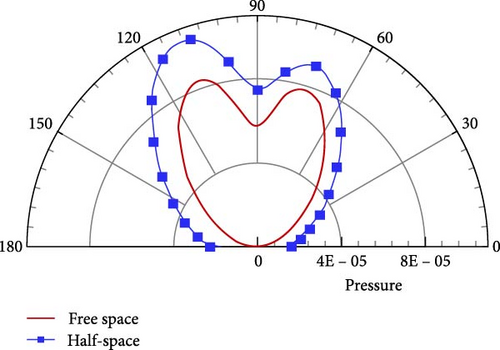
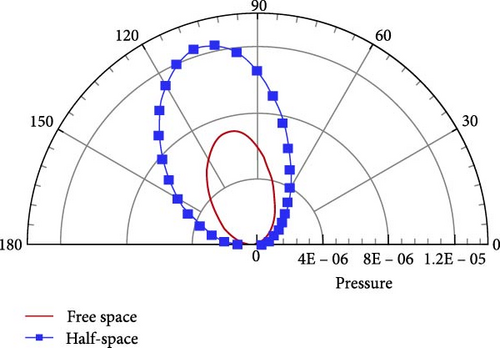
Figure 3 displays the pressure directivity for different permeable boundaries; the numerical results in the near and far fields all agree very well with the analytical solution. Here, l is set to unity. Meanwhile, the noise distribution in free space differs greatly from that in half-space; as shown in Figure 4, the difference between half-space and free space is caused by the ground boundary; it convincingly demonstrates that the scattering effect induced by the ground boundary changes the noise distribution significantly. Based on the above numerical results, it can be concluded that the ground scattering effect is equivalent to an amplifier of acoustic signals, which is the same conclusion as in Crighton’s study [31].
4.2. 2D Circular Cylinder in Half-Space
Vortex shedding from the cylinder at Ma = 0.15 and Re = 100 with cylinder diameter D = 1 m is chosen to investigate the correctness of the present method, and the fluid calculation is executed with ANSYS Fluent 19.0. As shown in Figure 5, the calculation region for the flow field is restricted to the area of (−15D, 35D) × (−15D, 15D), and the flow field area is divided by a block-structured grid with rectangular grid cells. The first layer of the grid near the cylindrical wall has a thickness of about 1 × 10⁻³D to ensure that the dimensionless distance of the grid near the wall is of the order of y+ ≈ 1. There are totally 44,080 grid cells distributed in the flow field area and 240 grid cells on the surface of the cylinder, and the second-order difference method is used to solve the Navier–Stokes equations for the time derivatives and spatial derivatives.
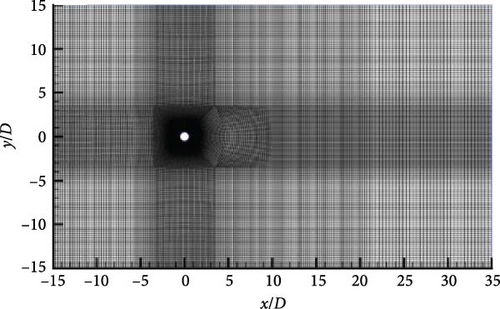
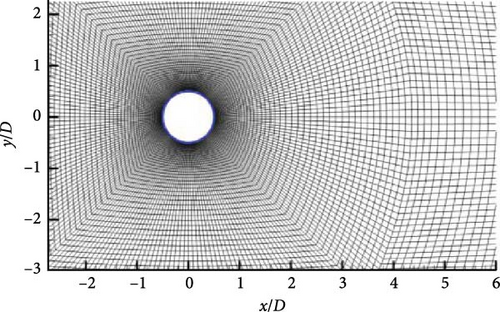
Table 1 shows the 2D results of the URANS model compared with other numerical simulations. It can be seen that the aerodynamic forces of the present calculation are in agreement with other studies, where Cl′ and are the fluctuation of the lift coefficient and the RMS of the drag coefficient, respectively. A comparison of the mean streamwise velocity at three stations in the wake of the cylinder between the present computation and that of Khalighi et al. [9] is shown in Figure 6, which displays that the two computations agree well.
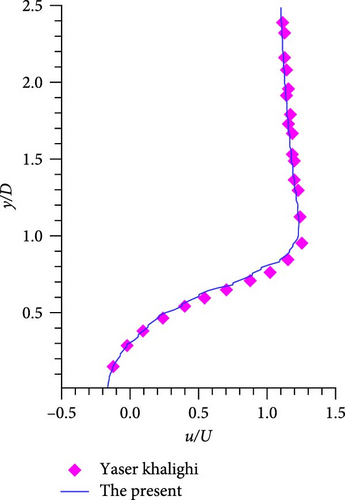
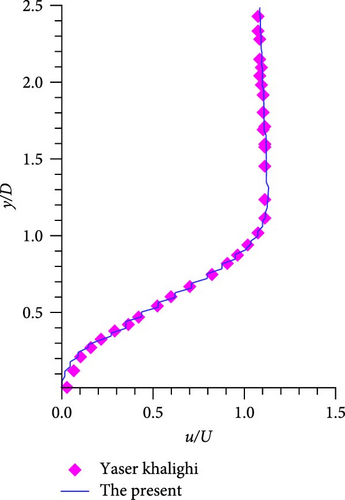
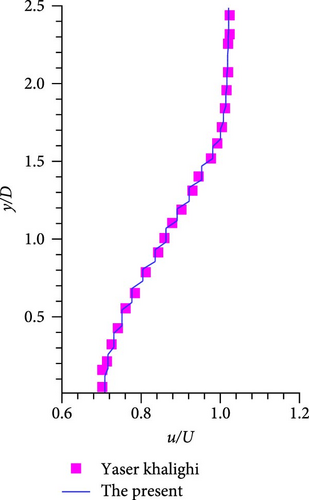
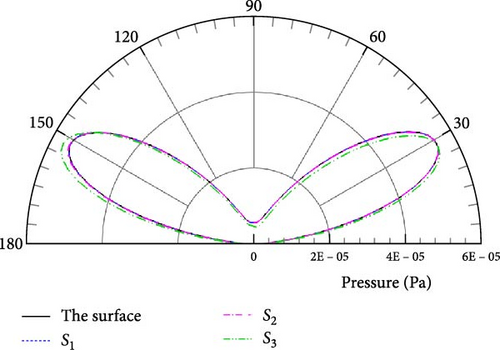
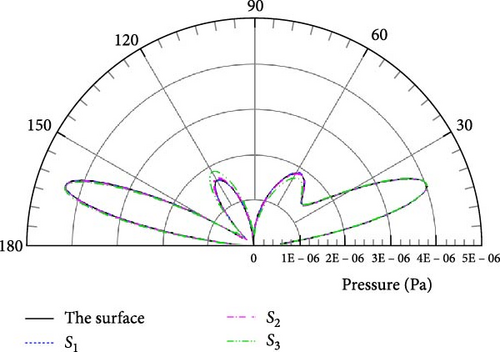
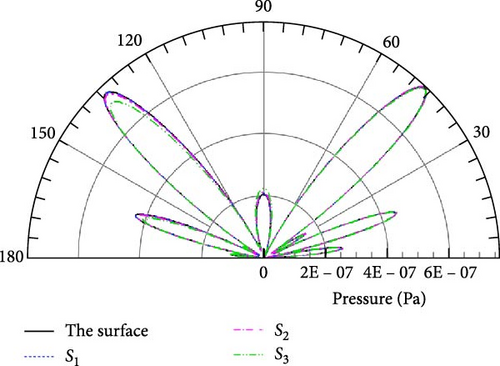
The flow field of the circular cylinder is a periodic flow containing 117 time steps in one cycle, with a time step Δt = 9.80 × 10⁻⁴s and vortex shedding frequency f0 = 8.7 Hz. For a periodic problem, the number of samples in multiples of the whole period is often chosen for frequency domain sound field calculations combined with auto-programing code. A total of 1,404 flow field samples within 12 cycles are continuously stored, and each sample contains information of flow density, pressure, and velocity for discretized grid cells. The ground boundary is located below the x- axis with a distance H = 10D. In order to investigate the accuracy of the method presented in this paper, four integral boundaries are selected, as shown in Figure 7. At first, 180 observation points are uniformly distributed on the circumference of a semicircle centered at the coordinate origin, with a radius of R = 100D. Figure 8 illustrates the pressure directivity for the vortex shedding frequency and its three harmonic frequencies with varying integral boundaries. The computational results for different integral boundaries are in agreement. It is well known that the noise in free space distributes as a dipole along the vertical direction at f = f0 and along the horizontal direction at f = 2f0. The noise distributions in half-space exhibit a petal-like pattern, as shown in Figure 8, and the number of petals increases gradually with frequency. The maximum noise basically occurs at 30°–50° from the horizontal at different frequencies due to the scattering effect of the half-space.


4.3. NACA0012 Airfoil in Half-Space
Acoustic noise during take-off and landing or low-altitude flight often causes a series of environmental noise pollution problems because of the ground scattering effect. From the civil engineering point of view, wind turbine blades also pose a considerable hazard in terms of noise. As one of the most common models, the NACA0012 airfoil is often chosen as the basic model to perform noise studies.
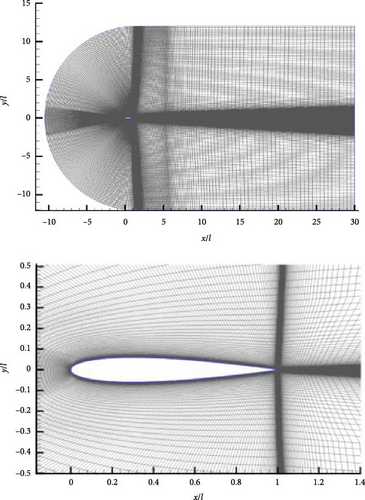
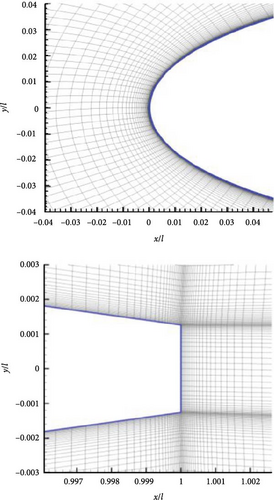
In this section, a 2D NACA0012 airfoil in half-space is chosen to study the noise distribution characteristics. The incoming velocity is U0 = 68.3 m/s, and the Reynolds number is Re = 2.32 × 10⁶, corresponding to the chord length l = 0.495 m. The attack angle of incoming flow is 2.5°, and the environmental temperature is 15°C. As shown in Figure 9, the leading edge of the airfoil is located at (0,0) in the x–y plane coordinate system. A structured meshing approach is used to divide the flow field into rectangular grids. The fluid calculation is executed with ANSYS Fluent19.0, and the computational domain shown in Figure 9(a) is discretized with a total of 84,992 rectangular grid cells, with 336 grid cells uniformly distributed on the airfoil surface. Numerical simulation is executed with discrete eddy simulation turbulent model in combination with second-order difference methods, and the time step is chosen as Δt = 1 × 10⁻⁴s with a single time step iteration limited to 20 iterations.
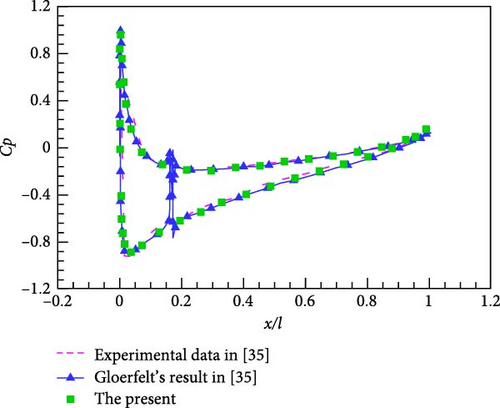
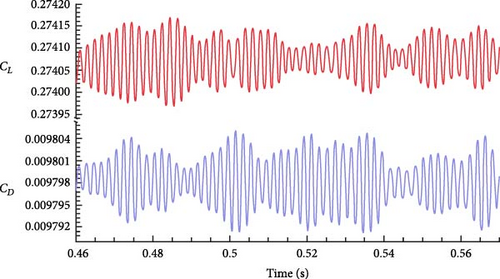
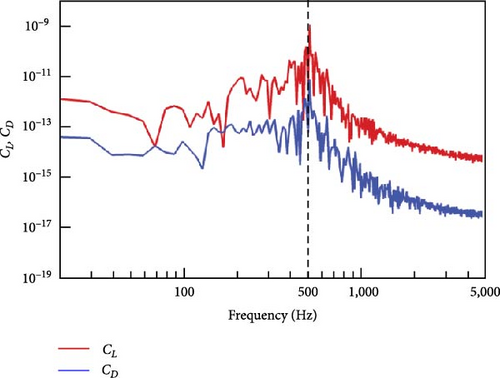
The pressure coefficient around the airfoil is studied first because it determines the lift and drag coefficients. As displayed in Figure 10, the result of the mean pressure coefficient is in good agreement with experimental results and numerical results from an LES turbulent model obtained by Gloerfelt and Garrec [35]. Figure 11(a) shows that the lift coefficient (CL) and drag coefficient (CD) have the same period along with time, which is in agreement with [13]. The variation of power spectral density (PSD) in Figure 11 demonstrates that the magnitude of CL and CD reaches the peak value at f = 515.9 Hz, corresponding to kl = 4.72 and St = 3.76. The variation of the lift coefficient with time and frequency is the same as that of the drag coefficient, and the variation of the lift coefficient is much greater than that of the drag coefficient. This means that the sound pressure in the far field must be dominated by the lift, and the maximum noise should propagate along the vertical direction.
For a plate profile, Howe [26] has proposed an analytical model to study the acoustic noise. The author also studied the noise distribution in half-space combined with imaginary sources. This paper mainly investigates the permeable boundary in half-space to find a simple and efficient improved algorithm.
The following acoustic calculations are executed with Intel Fortran 2015 to prepare the program code according to Equations (7) and (21). There are 4,096 samples collected along the time from t = 0.4544 s to t = 0.864 s with one time step, and then these samples are averaged into four groups as input to solve Equation (5). Here, a group contains 1,024 samples with information on fluid density, pressure, and velocity. Acoustic results are obtained with a two-step calculation for scattered sources on the integral boundary SW and far-field noise, and four sets of data are averaged as the final acoustic results. The ground boundary is located below the x-axis with a distance of H = 20l.
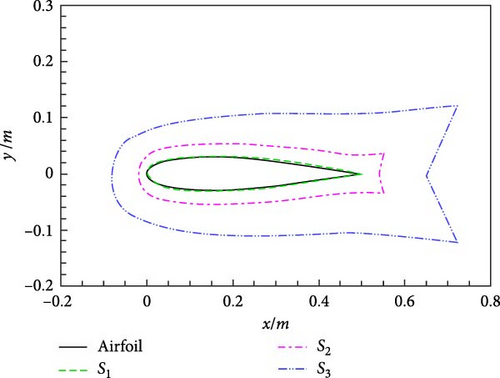
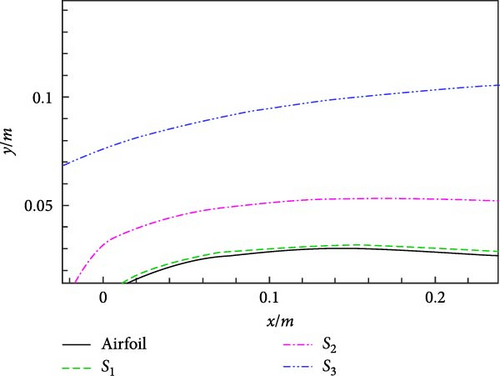
First, the directivity of the sound pressure is investigated with different permeable boundaries. To reduce interpolation calculations, the permeable boundary coincides with the flow field grid line. Here, three permeable boundaries selected as S1, S2, and S3 are selected to carry out the noise calculations in Figure 12. The permeable boundary S1 is closest to the airfoil surface, with the other two at some distance from the airfoil. Among them, the permeable boundary S3 is especially the farthest. In our previous research on free space noise [12], we found that the choice of the permeable boundary has some minor influence on calculated results. As shown in Table 2, the number of the grid cells on and outside the different integral boundaries is compared. According to the permeable boundary study in [12], it can be tentatively extrapolated that there may be numerical errors in the acoustic calculations, especially with the integral boundary S3 due to its distance far away from the airfoil.
| Integral boundary | The grids distributed on the integral boundary | The grids contained in Ω–Ω0 outside the integral boundary |
|---|---|---|
| Wall | 336 | 84,992 |
| S1 | 456 | 73,112 |
| S2 | 496 | 68,352 |
| S3 | 576 | 57,632 |
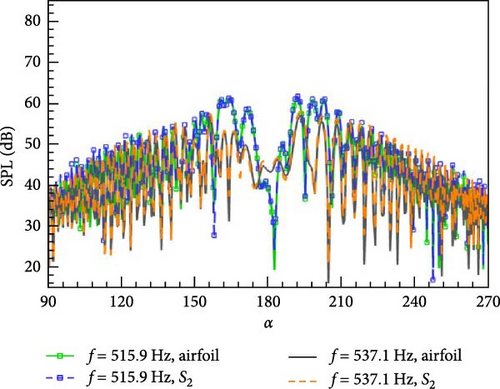
From a hydrodynamic point of view, Figure 11 displays that the lift coefficient CL is greater than the drag coefficient CD with two orders of magnitude and reaches its maximum value at f = 515.9 Hz, indicating that the maximum sound pressure must be along the vertical direction at f = 515.9 Hz due to the determining effect of the lift coefficient CL. According to Howe’s analytical model, the frequency corresponding to the product of wave number and chord length kl = 1, 5, 10, 20 is always chosen as the basic frequency. In this case, the frequency f = 535.1 Hz corresponding to the relationship kl = 5 is the closest to f = 515.9 Hz. Figure 13 shows the spatial distribution of observation points located on a circular arc above the ground with radius R = 50 m, assuming that 360 observation points are uniformly distributed to investigate the far-field propagation characteristics of acoustic waves. The angle α is obtained by calculating with the trigonometric functions, α = arccos (H/R). The observation point located within the range (α, 360°–α) is displayed in Figure 13.
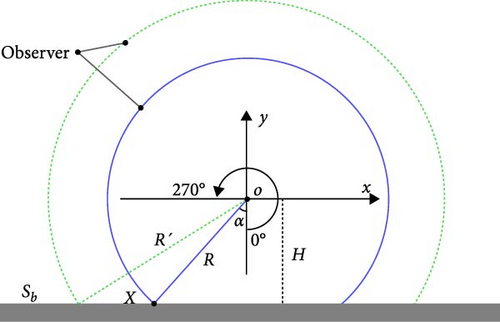
Figure 14 gives the SPL comparison between two frequencies for observer points within (90° and 270°). Here, α is equal to 90°, corresponding to the observation point in the positive direction of the y-axis. It can be found that the peak value at f = 515.9 Hz is larger than that at f = 535.1 Hz, corresponding to the results of the hydrodynamic computing, and the directions of maximum SPL are basically the same within (160°, 200°) along the clockwise direction. The direction of maximum sound pressure is determined by the lift force CL.
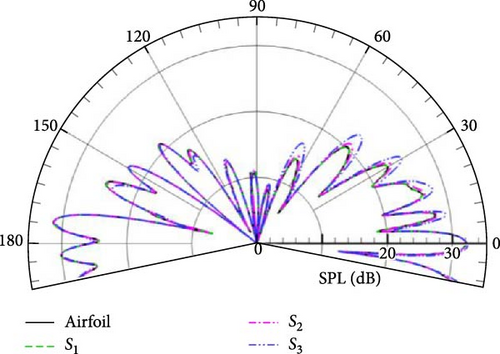
The distribution of the sound field at several special frequencies corresponding to kl = 1, 5, 10, 20 is shown here. Figure 15 displays the SPL directivities at different wavenumbers for observation points located on a circular arc with R = 50 m, and the observation points are located within (78.6°, 281.4°) for α = 78.6°. It shows that the SPL amplitude obtained by four integral boundaries is in good agreement at different wave numbers, except for the integral boundary S3, which is slightly larger or smaller in some directions. Combined with the mesh information given in Table 1, it can be seen that the fluid domain outside the integral boundary contains only 57,632 grid cells, and the contribution of the other 27,360 grid cells to the acoustic field is calculated equivalently by the permeable boundary.
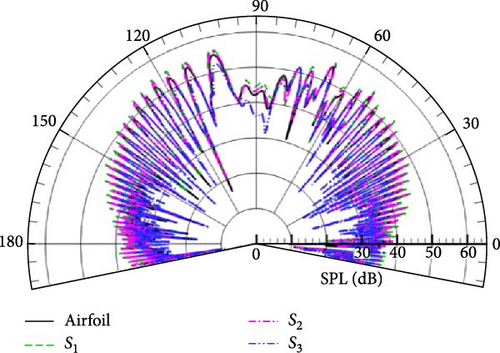
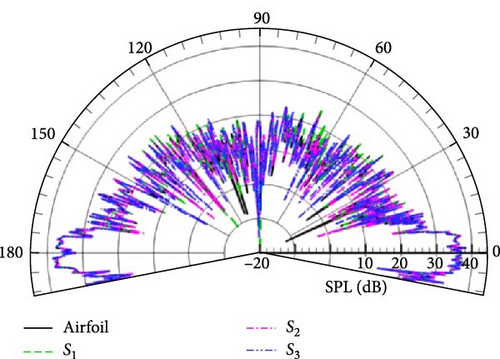
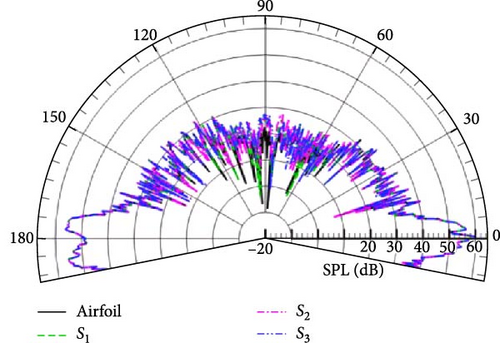
Meanwhile, the SPL directivities at different wavenumbers for observation points located on a circular arc with R = 25 m is also shown in Figure 16, and the observation points are located within (66.7°, 293.3°) for α = 66.7°. From the perspective of flow-generated noise, the forced cutting of the vortex pulsation region by the integral boundary causes the excessive loss of the source signal. This also explains why there exist numerical differences in the sound field simulated with the permeable boundary S3. The good point is that the selection of the integral boundary has no effect on the SPL at the observation point near the ground, which illustrates that the present method is capable of predicting the noise in the near-ground direction and taking into account the scattering effect, which is different from the previous studies. The above study gives us an insight that the region with strong flow field pulsations cannot be completely discarded when selecting the permeable boundary.
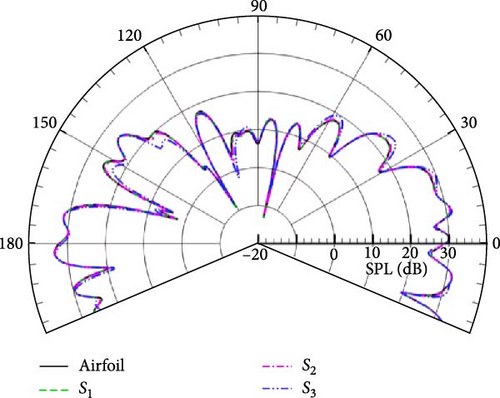
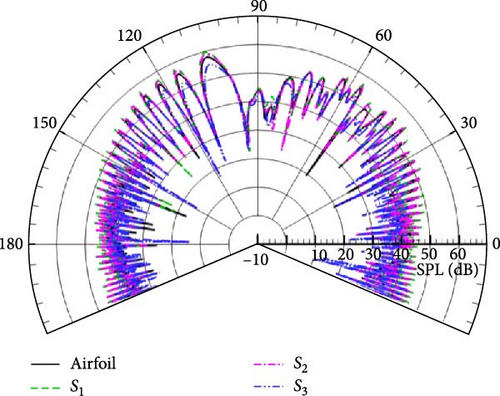
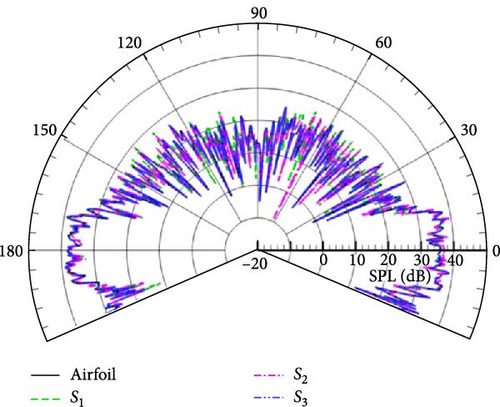
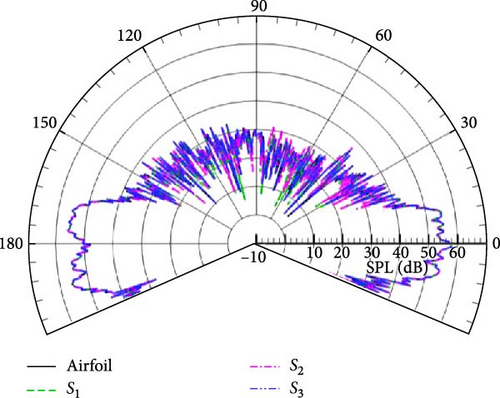
In addition, the obvious difference from free space is that the overall distribution of the SPL shows a petal-like distribution at low frequency, as given in Figure 15(a), and the number of wave lobes increases sharply with increasing wavenumber in Figures 15(a), 15(b), 15(c), and 15(d). The same variation tendency is also shown in Figure 16 compared with Figure 15. Without considering the effect of the integral boundary, it can be seen from Figures 15 and 16 that the closer the observation points are to the ground, the greater the pressure amplitude. From the perspective of energy transmission, the acoustic signal received by the observation points near the ground does not undergo excessive energy attenuation due to long-range propagation, and the sound pressure amplitude is correspondingly greater than that of the remote observation points. In summary, the complexity of the half-space sound field is mainly caused by the ground scattering effect, which is consistent with the results obtained in Section 4.1.
To comprehensively examine the numerical errors caused by the permeable boundary, we use the maximum SPL corresponding to kl = 4.98 in Figures 15 and 16 as a reference. Table 3 presents the SPL obtained by different permeable boundaries and compares them with the results obtained by the airfoil surface. The relative errors are the errors between the calculation results of the permeable boundary and that of the airfoil surface. Numerical results indicate that the SPL and relative errors obtained from various permeable boundaries are acceptable when compared to those obtained from the airfoil surface. Examining the spatial position distribution diagram in Figure 12, it is evident that there is no consistent trend of increasing or decreasing SPL and relative error with spatial changes in the integration boundary. The integration boundary S2 corresponds to the smallest relative error, while the integration boundary S3 corresponds to the largest relative error. The physical phenomenon has two causes. First, representative pulsation sources are lost as the integration boundary moves further from the airfoil surface. Second, the permeable surface cuts the turbulent vortex structure, which also causes numerical errors.
| The integral boundary | R = 50 m, α = 78.6° maximum SPL (dB) | Relative error (%) | R = 25 m, α = 66.7° maximum SPL (dB) | Relative error (%) |
|---|---|---|---|---|
| Wall | 54.9 | 0 | 57.9 | 0 |
| S1 | 56.5 | 2.7 | 59.7 | 3.1 |
| S2 | 56.0 | 2 | 59.1 | 2 |
| S3 | 52.3 | 4.7 | 55.1 | 4.8 |
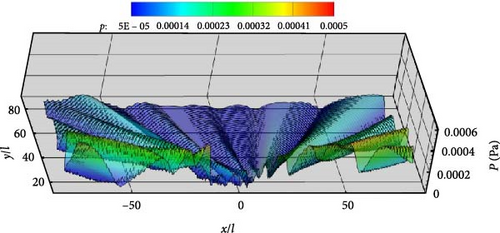
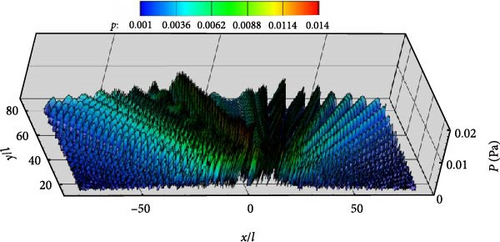
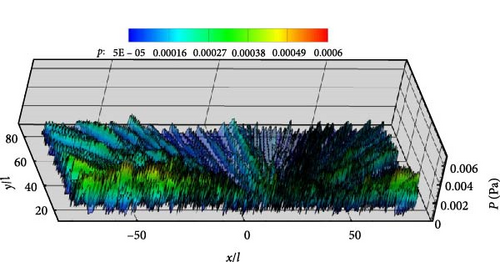
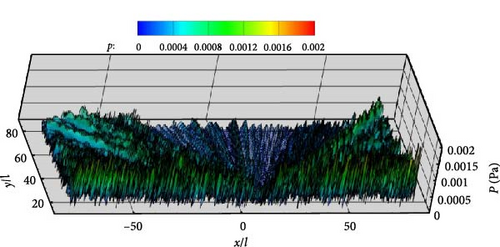
The scattering effect significantly changes the noise propagation mechanism, and what kind of noise spatial distribution is also the focus of the research work to determine the noise propagation characteristics from near to far. Next, the noise distribution is investigated by placing 8,538 observers located in the upper half of the space contained in (−80l, 80l) × (13l, 80l). Combined with SPL directivities shown in Figure 17, the airfoil surface and the permeable boundary S2 are selected to investigate the noise spatial distribution. Pressure contours displayed in Figure 17 show that the results obtained with the airfoil surface agree well with those obtained with the integral boundary S3. The maximum value of pressure amplitude occurs at kl = 4.98 according to Figure 17(b), and its distributed direction and the angle of the incoming flow direction is about 70°–110°. However, at other selected frequencies as shown in Figure 13, it is basically the closer the observation points are to the ground, the greater the pressure value.


Figures 15, 16, and 17 demonstrate that the permeable boundary S2 can be utilized to capture the noise distribution, including ground-induced scattering effects, instead of the airfoil surface. Figure 18 displays the spatial distribution of acoustic noise in detail when the permeable boundary S2 is selected as the integral boundary. The frequencies for kl = 1, 5, 10, and 20 are still being studied. Figure 18 shows that the variation and distribution of acoustic noise are consistent with that in Figure 17. The number of petals in the upper half-space gradually increases as the frequency increases. With the exception of the frequency corresponding to Figure 18(b), the other three images all indicate that the noise near the ground is significantly greater. This trend is consistent with the findings presented in Figures 15 and 16. The unique distribution displayed in Figure 18(b) is due to the fact that the noise caused by flow field pulsations in the vertical direction is greater than that induced by the scattering effect. Aerodynamic noise in half-space is closely related to flow field pulsations and scattering effects, in contrast to aerodynamic noise in free space. The far and near field noise produced by the NACA0012 airfoil, along with the ground scattering effect, can be calculated using permeable boundaries instead of the object surface.
5. Conclusions
In this paper, an improved boundary element method for aerodynamic noise is proposed, which takes into account the half-space scattering effect in combination with the permeable boundary. The acoustic noise of the dipole point source with an exact solution in half-space is studied, and the aerodynamic noise generated by the 2D circular cylinder and NACA0012 airfoil is examined in detail. Based on the numerical studies conducted above, the following conclusions are drawn:
This boundary element method improves upon previous methods by avoiding numerical singularities and using permeable boundaries instead of object surface integrals to calculate acoustic noise in half-space. Noise distributions in half-space differ greatly with that in free space; this is because the scattering effect, which is induced by the ground boundary, changes the noise distribution significantly. Numerical studies indicate that the ground scattering effect amplifies acoustic signals. By calculating the noise of the mirrored source to capture the scattering effect effectively reduces the computational complexity. Different permeable boundaries have little impact on the amplitude of the half-space aerodynamic noise.
The noise produced by the NACA0012 airfoil, both near and far field, including the ground scattering effect, can be calculated using various permeable boundaries instead of the object surface. However, the permeable boundary located further away from the airfoil may cause excessive loss of the source signal due to the forced cutting of the vortex pulsation region. The distribution of half-space aerodynamic noise is affected by both the spatial–temporal distribution of sound sources and boundary scattering effects. At the main frequency f = 515.9 Hz (kl = 1), the flow field pulsation is determined by the lift coefficient CL and is distributed vertically. As a result, the noise distribution reaches its maximum along the incoming flow 160°–200°. At other selected frequencies corresponding to kl = 1, 10, and 20, the scattering effect from the ground is more pronounced and has a significant impact on the sound field distribution, particularly for observer points near the ground.
The acoustic integral model proposed in this paper is applied for both the 2D and the 3D problem. For the 3D sound propagation problem, the surface sources of the flow field on the 3D permeable surface enclosing the object and the volumetric sources of the 3D flow field are required. Meanwhile, the acoustic boundary element integrals are also processed by the 3D free-space Green’s function according to the treatment of Green’s functions in 2D free space. The difficulty of the problem lies in the 3D acoustic calculations involving the source calculations of the actual fluid flow, and acoustic propagation calculations of the workload are larger; about this research work on this aspect is in progress.
Symbol
-
- A:
-
- The amplitude of oscillationx
-
- eij:
-
- Fluid viscous stress tensor
-
- g:
-
- Green’s function in time domain
-
- Ω:
-
- The fluid field
-
- S:
-
- The integral boundary
-
- Ω0:
-
- The fluid field between the rigid surface and the integral surface
-
- Sb:
-
- The ground boundary
-
- C(x):
-
- Solid angle function
-
- n:
-
- Unit normal vector
-
- vn:
-
- The moving velocity of integral boundary (m/s)
-
- x, y:
-
- Observer position, sound source position
-
- t, τ:
-
- The time of receiving wave, the time of sending wave (s)
-
- G:
-
- Green’s function in the frequency domain
-
- Gs, gs:
-
- Scattered Green’s function in half-space
-
- gk:
-
- The series expansion of Green’s function
-
- Γ:
-
- The outer boundary in the far field
-
- R.H.S.:
-
- Right-hand side
-
- Δt:
-
- Time step (s)
-
- Δt∗:
-
- Nondimensional time step
-
- U0:
-
- Velocity of incoming flow (m/s)
-
- Cp:
-
- Pressure coefficient
-
- CL, CD:
-
- Lift coefficient, drag coefficient
-
- df:
-
- Frequency resolution
-
- H:
-
- The distance from the ground boundary to the origin of the coordinates
-
- SPL:
-
- Sound pressure level (dB)
-
- R:
-
- The radius of the circle for observation points
-
- k:
-
- The wave number
-
- l:
-
- The chord length
-
- ω:
-
- Circular frequency (radian/s)
-
- λ:
-
- Wavelength
Subscripts
-
- i, j:
-
- The ith or jth component
-
- h:
-
- Quantity related to fluid flow
-
- 0:
-
- The quantity related to the incoming flow
-
- a:
-
- Quantity related to noise propagation.
Conflicts of Interest
The authors declare that they have no conflicts of interest.
Acknowledgments
This research was supported by the Natural Science Foundation of Ningxia (no 2023AAC03299), supplied by Ningxia People’s Government, and the research project of National Key Laboratory of Science and Technology on Aerodynamic Design and Research (no 614220120030115) supported by Northwestern Polytechnical University.
Appendix
The sound field is enclosed by the boundary ∂Ω, which is consist of two parts: the inner boundary S in the near field and the outer boundary Γ in the far field. The derivation process selects the smooth boundary around the noncompact bodies as the integral boundary S.
Open Research
Data Availability
Numerical data are included in the submitted paper.


