Intelligent Collaborative Optimal Scheduling for Water Intake-Supply Pump Groups in Drinking Water Treatment Plants
Abstract
Up to 80% of the electrical energy is consumed by pump groups in water purification plants. Optimizing the scheduling of water intake-supply pump groups is crucial for saving electrical energy and reducing carbon dioxide emissions while ensuring water supply and security requirements are met. Herein, an intelligent collaborative optimal scheduling method is proposed for the water intake pump groups, clean-water reservoirs, and water supply pump groups. A long short-term memory (LSTM) network is applied to predict the flow of the water supply pump group, and a data-driven approach is used to plan the flow of the water intake pump group and model the working characteristics of working pump configurations. Furthermore, based on the dynamic programming (DP) algorithm, the optimal scheduling scheme of the water intake-supply pump groups as well as the working pump configuration at each moment can be obtained. The proposed approach dynamically updates data on an hourly basis to enhance the precision of collaborative optimal scheduling outcomes. The experimental results of long-term operation showed that pump efficiency was increased by 10.68% and 10.70% of electric energy was effectively saved as compared to the results of previous manual scheduling. This study provides a solution for energy conservation and efficiency enhancement of multiple energy-consuming equipment and carbon emission reduction.
1. Introduction
According to data analysis, the world’s energy consumption in 2050 will increase by about 50% compared with that in 2020 [1]. Population growth, urbanization, energy security policies, and growing production and consumption patterns have greatly affected the demand for sustainable energy [2]. To mitigate the energy crisis and climate change, many countries around the world utilize renewable materials and systems to minimize greenhouse gas emissions [3]. The electrical energy consumption of water purification plants accounts for more than 4% of urban electrical energy consumption [4], and up to 80% of this is consumed by the water intake-supply pump groups [5]. Generally, such pump groups are configured based on their maximum flow and head demand under the most unfavorable conditions. Current working pump configurations are generally based on subjective experience, lacking theoretical guidance and relying on potentially arbitrary scheduling judgments of individual engineers. This means that pumps are not necessarily operating at maximum efficiency [6]. The optimization objectives of intelligent cooperative optimal scheduling of water intake and water supply pumping stations are mainly power consumption and pump switching times [7, 8]. Amongst them, the number of pump switching is usually an easy to be ignored optimization goal. If the time interval between the operation and stop of the pump is too small, it could lead to overheating of the motor unit, water hammer phenomenon in the transmission pipeline, pipe explosion accident, and other problems [9], which would shorten the service life of the pump, motor, and transmission pipeline [10]. Therefore, the pump switch number should also be evaluated during optimization. Moreover, these optimizing objectives should be developed under the constraints of the main pipe pressure and the water levels of clean-water reservoirs [11]. The intelligent collaborative optimal scheduling for the water intake-supply pump groups can be divided into four parts, which are the prediction of water demand flow of the water supply pump group, the planning of water demand flow of the water intake pump group, the analysis of pump combination characteristics, and the dispatching decision optimization.
The prediction of the flows in the water supply pump group is the basis of water demand flow planning of the water intake pump group. Moreover, the flow in a supply pump group is mainly determined by the water consumption of residents. In recent years, both domestic and foreign scholars have applied various algorithms to predict residential water demand. Herrera et al. [12] applied support vector regression (SVR), multivariate adaptive regression spline (MARS), projection pursuit regression (PPR), and random forest (RF) algorithms to the field of urban water demand prediction and compared their results. Although the SVR algorithm has a higher prediction accuracy compared to the other three algorithms, it often lags behind in predicting the actual values for most of the time nodes. Antunes et al. [13] applied the artificial neural network (ANN), SVR, RF, k-nearest neighbor (KNN), and autoregressive integrated moving average (ARIMA) algorithms to the field of short-term water demand prediction and compared their results. They concluded that the prediction accuracy of the ARIMA algorithm was better than that of machine learning algorithms. However, certain nodes with significant errors necessitate real-time monitoring and periodic tracking by researchers, rendering the approach challenging to implement in practical settings. Pesantez et al. [14] explored the RF, ANN, and SVR algorithms to predict residential water demand through lag demand, seasonal changes, weather, and household characteristics. The results demonstrated that RF and ANN exhibited higher prediction accuracy compared to SVR. However, the requirements of these methods are high for the type and scale of the training data, making their practical application challenging. Considering engineering practicalities, the long short-term memory (LSTM) network can be employed to learn the historical scheduling data of water purification plants, which affects the flow of the water supply pump groups. An LSTM network can memorize the periodic characteristics of a time series through its gate nodes, resulting in more accurate predictive results [15]. In addition, LSTM algorithm also shows better performance compared with other algorithms in other fields of prediction problems [16, 17].
The optimal operation of an intake pump station can be achieved through water demand flow planning, which determines the energy-saving benefits of intelligent cooperative operation between the intake and supply pump stations. In recent years, both domestic and foreign scholars have predicted the water demand flow of intake pump stations through flow balance and water level control to reduce the electrical energy consumption of intake pump stations during operation [18, 19]. Through data analysis, Shan [20] found that the variation of the daily water consumption of urban residents was presented as peak and trough periods, but such a simple division was insufficiently accurate. Xiang [21] divided a daily water volume into four periods by adjusting the level of a clean-water reservoir. This improved the accuracy of water demand flow planning for the intake pump station, but it neglected the influence of seasonal changes on daily water demand. Therefore, this paper makes full use of the regulation and storage capacity of a clean-water reservoir. The clean-water reservoir is a water treatment structure in the water supply system to regulate the uniform water supply of the water plant and meet the uneven water supply of users. The adjustment and storage capacity of a clean-water reservoir can provide a buffer for the flow changes of the water intake pump group and water supply pump group. The flow of the intake pump group over a 24-hour period is planned along with the water level of the clean-water reservoir [22]. The working conditions of the intake pump group can be divided into three categories—peak water consumption periods, trough water consumption periods, and ordinary water consumption periods—based on seasonal and diurnal flow changes in the supply pump group. The flow of the intake pump group is designed to be as stable as possible to avoid frequent switching of the pumps and to enhance safety.
After determining the flow of the water intake-supply pump groups, it is crucial to model the working characteristics of the pumps. In an intake or supply pump group, the pump station basically increases the pumping flow to meet the needs of daily users by means of multiple pumps in parallel [23, 24]. The dynamics of working pump group configurations are not equivalent to a linear combination of the dynamics of each working pump due to upgrades and repairs over the years. Thus, working pump configurations exhibit different dynamics, which would change with long-term operation. It is necessary to accurately determine the dynamics of the working pump configurations. For configurations that only contain constant frequency pumps, it is necessary to consider the nonlinear relationship between the main pipe pressure and the water flow/electrical energy consumption. For variable frequency drive (VFD) pump configurations, pump frequency is an additional consideration. The data-driven approach is effective in regularly modeling this nonlinear relationship by using the latest operational data from working pump configurations to manage the impact caused by upgrades and repairs over the years. The dispatching decision optimization is based on the existing water supply pump groups’ demand flow prediction results, intake pump groups’ demand flow planning results, and pump combination working characteristic model, considering multiple optimization objectives, through the decision optimization method to obtain the intelligent collaborative optimal scheduling for the water intake-supply pump groups.
In addition, the scheduling decision optimization problem has also attracted the attention of scholars in various fields, such as active distribution network [25], interconnected microgrids [26], smart cities [27], electric vehicles [28, 29], and ship power systems [30]. In recent years, both domestic and foreign scholars have employed genetic algorithms (GAs) [22, 31], deep reinforcement learning [32], model predictive control [33], artificial fish swarms [34], and other algorithms [35] to solve the optimal scheduling problem of water pumping stations. Li Jishan and Weiping [36] obtained a scheduling scheme for optimal operation by using self-optimization simulation technology and dynamic programming theory combined with detailed computer analysis and found this provided economic benefits. Barán et al. [37] proposed the Pareto evolutionary intensity algorithm, which further reduced power costs, maintenance costs, the maximum power peak, and the variation in the liquid level in the reservoir. The aforementioned methods have achieved good results in optimizing the scheduling of pump stations, but the importance of optimizing the switching times of pumps has generally been ignored. As a result, the application of scheduling plans recommended by such optimization methods may cause additional power loss or even affect the operational safety and service life of pumps. Compared to the above-mentioned methods, the dynamic programming (DP) algorithm is easier to implement in practical engineering [38, 39]. Intelligent collaborative optimal scheduling methods based on the DP algorithm can optimize not only electrical energy consumption but also the pump switch number. Additionally, the DP algorithm can more efficiently identify global optimal solutions and is easily applicable to water purification plants with different engineering environments.
Previous scholars usually focus on the single optimization of the water intake pump groups or water supply pump groups and have not fully considered the interaction of each other and lack of thinking about the overall system. This manuscript fully explores the relationship between the clean-water reservoir and the water intake-supply pump groups and designs the intelligent collaborative optimal scheduling for the water intake-supply pump groups. This manuscript proposes an intelligent collaborative optimal scheduling method for the water intake-supply pump groups and compares the experimental results to actual scheduling results. More specifically, an intelligent collaborative optimal scheduling method that buffers the flow changes of the water intake and supply pump groups using a clean-water reservoir is proposed to minimize electrical energy consumption and the number of pump switches. A predictive model based on an LSTM network is proposed to predict the flow of the water supply pump group, and a method is proposed to plan the flow of the water intake pump group. A DP algorithm is then used to obtain an optimal scheduling plan for the water intake-supply pump groups. Finally, the numerical results of the proposed methods are analyzed and discussed.
2. Methods
The flow in a water supply pump group is first predicted using an LSTM network over a period of 24 hours. The flow in the water intake pump group is then planned for 24 hours along with the water level of a clean-water reservoir based on the flow of the water supply pump group and engineering experience. Secondly, nonlinear models of working pump configurations are established according to historical data. Finally, intelligent collaborative optimal scheduling objectives are established to minimize the electrical energy consumption and the pump switch number using the constraints of the flow in the water intake-supply pump groups, the main pipe pressure, and the water level of the clean-water reservoir. An optimal schedule for the water intake-supply pump groups, which specifies the working configurations of pumps at each time, can be obtained using the DP algorithm.
2.1. Flow Prediction of a Water Supply Pump Group
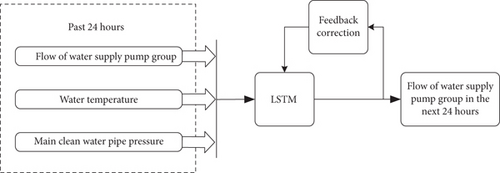
The water temperature and main clean water pipe pressure are important factors affecting the flow in a water supply pump group based on the analysis of historical data. Since an LSTM network can memorize and learn features of long-term data, a predictive model is established to predict the flow in the water supply pump group based on an LSTM network. The input variables include decision variables (the flow in the water supply pump group, the water temperature, and the main clean water pipe pressure in the past 24 hours) and feedback correction. The predicted flow in the supply pump group in the next 24 hours is corrected by the difference between the predicted and actual flow in the supply pump group in the past 24 hours. The output variable is the flow of the supply pump group in the next 24 hours. A schematic diagram of the model is shown in Figure 1.
The LSTM network is composed of an input layer, a hidden layer, and an output layer. The LSTM network is different from an RNN because a forget gate ft, an input gate it, an output gate ot, and a memory cell Ct are added to meet the needs of the time series data. These gates can be opened or closed depending on whether the memory state of the model network (the state of the previous network) in this layer has reached the threshold or not. If it reaches the threshold, it is added to the calculation of the current layer; otherwise, it is ignored. The structure of the LSTM network is shown in Figure A1. xt is the input at step t, ht−1 is the output at step t − 1, and ht is the output at step t [40].
2.1.1. Discarding Information
2.1.2. Storing Information
2.1.3. Outputting Information
2.2. Flow Planning of the Water Intake Pump Group
The flow of the water supply pump group varies seasonally and daily based on analysis of historical data and engineering experience. The morning and the evening are the peak water consumption periods, the night time is the most significant trough, and the rest of the time is considered the ordinary water consumption period. In different seasons, the change time nodes of the flow of the water supply pump group during the peak water consumption period, trough water consumption period, and ordinary water consumption period will also be different. During the trough water consumption period, the flow of the intake pump group is adjusted to produce a high-water level in the clean-water reservoir, in preparation for high water consumption during the peak consumption period. During the peak consumption period, the flow in the intake pump group is adjusted to replenish the clean-water reservoir. During the ordinary consumption period, the flow of the intake pump group is adjusted to meet the flow of the supply pump group.
The water adjustment and storage capacity of the reservoir are fully utilized so that the flow required by the intake pump group can be evenly distributed. In each period of time, the required flow levels at each moment are similar. The required flow does not change obviously when the pump switches. This can fundamentally reduce the pump switch number, which can ensure the safety of the pumps.
2.3. Establishment of a Model for the Nonlinear Relationship between the Characteristics of Working Pump Configurations
For working pump configurations containing VFD pumps in the water intake-supply pump groups, nonlinear models between the frequency of the VFD pumps and the water flow/electrical energy consumption/main pipe pressure of the working pump configurations can be directly obtained using the least squares (LS) method. For configurations that contain only constant frequency pumps, nonlinear models between the water flow and the electrical energy consumption/main pipe pressure of the configurations can also be obtained directly using the LS method. Due to uncertain factors such as wear, maintenance, and equipment upgrades, the aforementioned nonlinear models need to be updated regularly.
- (1)
A set of linearly independent functions φk(x) and an undetermined coefficient ωk are selected in advance
- (2)
The sum of squares of the distance of each point between f(x) (Eq. (10)) and the fitting function yi (i = 1, 2, ⋯, n) is compared
- (3)
The yi with the smallest sum of squares of the distance is selected as the fitted result
2.4. Establishment and Solution of the Intelligent Collaborative Optimal Scheduling Problem
ns(t)(ns(t) ∈ [1, 18]) are the serial numbers of the working pump configurations meeting the flow of the water intake pump group or water supply pump group at the t-th time, and Ms(t) is the number set of working pump configurations meeting the flow of the water intake pump group or water supply pump group at the t-th time.
The Bellman optimality principle lies at the heart of the DP algorithm, which involves a multistep decision-making process. The DP algorithm solves the original problem by combining the solutions of subproblems. There are two approaches: the top-to-bottom method and the bottom-to-top method. Unlike the divide-and-conquer algorithm or a naive recursion algorithm, the top-to-bottom method memorizes the solution of each subproblem, which greatly reduces the number of repetitive subproblems and the time consumption of the solution process. The current approach, however, does not comprehensively explore all potential subproblems in a recursive manner. Meanwhile, the bottom-to-top method can perfectly fill these loopholes. This method generally needs to properly define the scale of the subproblem so that the solution of any subproblem only depends on the solution of a smaller subproblem. Therefore, we can sort the subproblems by scale and solve them in ascending order. When a certain subproblem is solved, the smaller subproblems it depends on are also solved, and the results are saved. Each subproblem only needs to be solved once, and once solved (the first time we encounter it), all its premise subproblems are solved. These two methods have the same asymptotic running time. The difference is that the bottom-to-top method can find the global optimal solution, while the top-to-bottom method may only find the local optimal solution. Obviously, the bottom-to-top method is more appropriate for finding the optimal solution.
A structural diagram of the intelligent collaborative optimal scheduling decision-making process is shown in Figure 2. For step k + 1 of the scheduling process in the next 24 hours (24 steps in total, T = 24), the decision variable is Ws(k + 1), the state input is Ms(k), and the state output is Ms(k + 1). The relationship between the state input Ms(k) and the state output Ms(k + 1) is determined through the decisions made at step k + 1. When the decision is completed in each step, the recursive relationship can be used to convert the law of the entire objective, so that the strategy constituted by all decisions is the optimal solution of the original optimization objective [42].

The decision-making process can be transformed into the selection of a pump scheduling plan for the next 24 hours that minimizes the power consumption after considering the pump switch costs. This ensures minimal power consumption by reducing the number of pump switches. As shown in Figure A2, there are ns(k) choices for Ws(k) at step k and choices for the overall decision-making process.
The electrical energy consumption considering the pump switch costs (kWh) and the working pump configurations of the optimal scheduling plan is calculated using the recursive method. The electrical energy consumption (kWh) of the optimal scheduling plan can be obtained by subtracting the water pump switch cost from . Then, using Eq. (12), the VFD pump frequency of the working pump configuration of the optimal scheduling plan (Hz) can be obtained (if the working pump configuration contains a VFD pump).
3. Results and Discussion
3.1. Water Supply Pump Group Prediction
It can be seen from Figure 3 that the actual peak value of peak water consumption period is 13493 m3/h, of which the predictive peak values based on LSTM, ENN, and RF are 13027 m3/h, 11995 m3/h, and 12905 m3/h. The actual trough value of ordinary water consumption period is 8702 m3/h, of which the predictive peak values based on LSTM, ENN, and RF are 7840 m3/h, 6730 m3/h, and 8024 m3/h. The actual trough value of trough water consumption period is 4762 m3/h, of which the predictive peak values based on LSTM, ENN and RF are 5189 m3/h, 5393 m3/h, and 5432 m3/h. Predictive flows of the water supply pump group based on LSTM are closer than flows based on ENN and RF, and the change trend of predictive results based on LSTM is closer to the actual values than the predictive results based on ENN and RF, indicating that the predictive results based on LSTM are more precise. It can be seen from Figure 4 that the values and peak positions of the predictive results based on LSTM are closer to the actual value not only on weekdays but also on weekends. On Sunday, the actual peak values and the predictive peak values of peak water consumption period based on LSTM are 14109 m3/h and 13676 m3/h, while the predictive peak values based on ENN and RF are only 12845 m3/h and 12485 m3/h. The actual trough value and the predictive trough value of ordinary water consumption period based on LSTM are 8743 m3/h and 8266 m3/h, while the predictive peak values based on ENN and RF are only 7224 m3/h and 7005 m3/h. Since the LSTM algorithm realizes long-term learning and retention of key information through the switch control of the gate in the memory block, the prediction accuracy of special time nodes is improved. Compared with the predictive flow of the water supply pump group based on ENN, the predictive flow of the water supply pump group based on LSTM reduces the lag of prediction results and improves the dynamicity of the prediction under the condition of ensuring high prediction accuracy. The average error between the predictive flow based on LSTM and the actual flow of the water supply pump group is about 6.08%. What is more, the average error observed on weekdays and weekends is 5.90% and 6.52%, respectively. Meanwhile, the average error between the predictive flow based on ENN and the actual flow of the water supply pump group is about 13.51%. And the error vales are 11.61% and 18.25%, respectively, for weekdays and weekends. The average error between the predictive flow based on RF and the actual flow of the water supply pump group is about 7.95%. And the error vales are 7.52% and 9.04%, respectively, for weekdays and weekends. It could be concluded that the error of predictive flow based on LSTM of the water supply pump group is smaller than the actual flow of the water supply pump group for all days.
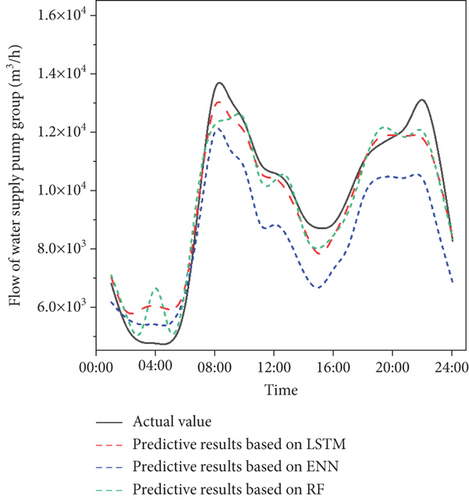
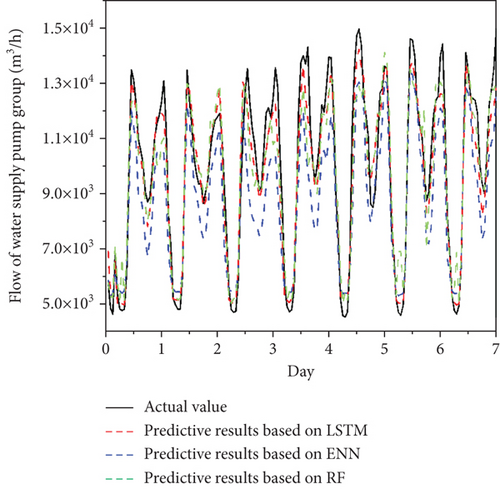
The short-duration memory neural network has the same three layers as the ENN, namely, the input layer, the hidden layer, and the output layer. The weight matrix between these layers and the information from historical moments can be transmitted to the current moment. However, the difference is that when outputting the result for the current moment, the short- and long-term memory neural network also outputs the unit state of the current moment, ensuring that the gradient will not disappear or explode after many time steps. At the same time, it also has three special “gate” structures, namely, the forget gate, the input gate, and the output gate. These structures allow for selective information passage, which can affect the data state at every moment in the neural network model. Each “gate” is controlled by the activation function and will output a value within the interval (0,1) that indicates the extent to which data can be retained and transmitted at the current moment. Therefore, compared with the ENN, the LSTM neural network has better accuracy and stability. Compared with LSTM algorithm, RF algorithm has higher requirements on the type and scale of training data. At the same time, RF algorithm cannot make predictions beyond the range of training set data, which may lead to overfitting when modeling some data with specific noise. Moreover, since the flow rate of the pump at each moment is highly correlated with time, the current state of the moment is related to the historical state of the previous moment to a certain extent. LSTM deep network can well explore and utilize the influence between them.
3.2. Planning for a Clean-Water Reservoir and Water Intake Pump Group
The water level of the clean-water reservoir was planned based on the historical data of changing regulation of water demand of the water supply pump group and the predictive flow of the water supply pump group in the next 24 hours. Figure 5 shows the planned water level of the clean-water reservoir, actual water level of the clean-water reservoir, planned flow of the water intake pump group, and actual flow of the water intake pump group in 24 consecutive hours.
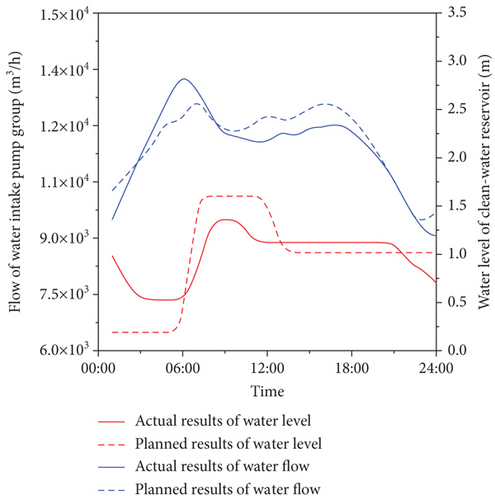
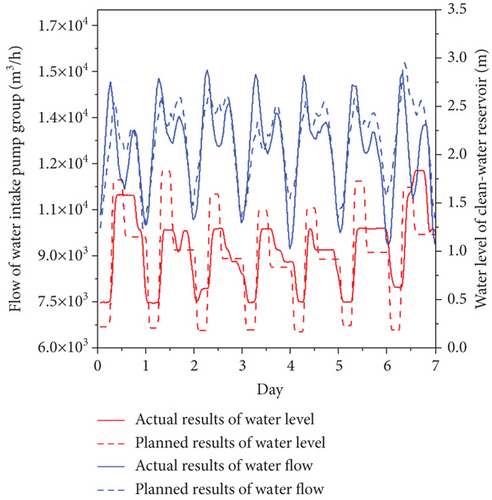
The average planned and actual flow of the water intake pump group are 8721.23 m3/h and 8792.50 m3/h, with an error of 0.81%. The minimum and average planned water level of the clean-water reservoir are 1.35 m and 2.16 m, which is higher than the minimum (1.20 m) and average actual water level (2.10 m) of the clean-water reservoir. Figure 5 displays that the difference between the planned peak and trough is smaller than the difference between the actual peak and trough of the water level of clean-water reservoir. It indicates that the flow of the water intake pump group would stably increase the water level of clean-water reservoir, reduce the pump lift and the main clean water pipe pressure, and then reduce the electric energy consumption of the water supply pump group. Figure 5 also indicates a significant change in the planned flow of water intake pump group around 7:00, with a relatively small deviation from the actual value compared to other times. The planned flow of the water intake pump group is slightly more stable than the actual value, which is mainly manifested in that the number of changes in the planned flow of water intake pump group is less than the actual value. It could reduce the pump switch number and facilitate the acquisition of the subsequent optimal scheduling plan. In combination with Figure 6, it can be seen that the difference between the peak value and the trough value is smaller than the actual value under the premise that the water level of the clean-water reservoir is high at most times, and the planned values of the clean-water reservoir water level is higher than the actual values at weekends. Under the premise of meeting the demand flow of water supply pumping station, the change times of the planned water flow of water intake pumping station can be steadily lower than the actual values, which proves the stability and reliability of the planning method of water intake pumping station demand flow. Under the condition that the water demand of the pumping station and the water level of the clean-water reservoir are met, the planning value of the water demand of the pumping station and the higher water level of the clean-water reservoir can be obtained.
3.3. The Nonlinear Relationship between the Operating Characteristics of Working Pump Configurations
A total of 18 working pump configurations in the water intake pump group were nonlinearly fitted based on the LS method, including 16 working pump configurations containing VFD pumps and two working pump configurations containing only constant frequency pumps. Eighteen working pump configurations in the water supply pump group were also nonlinearly fitted based on the LS method, including 16 working pump configurations containing VFD pumps and two working pump configurations containing only constant frequency pumps. For the working pump configurations containing VFD pumps, , , and represent the goodness of fit between the frequency of the VFD pumps and water flow/electrical energy consumption/main pipe pressure of the working pump configurations, as shown in Table 1. For the working pump configurations containing only constant frequency pumps, and represent the goodness of fit between the main pipe pressure and the water flow/electrical energy consumption of the working pump configurations, which are shown in Table 2.
| Working pump configuration in the water intake pump group | Working pump configuration in the water supply pump group | ||||||
|---|---|---|---|---|---|---|---|
| 1#, 3# | 0.619 | 0.874 | 0.898 | 1#, 3# | 0.906 | 0.851 | 0.688 |
| 2#, 3# | 0.471 | 0.887 | 0.980 | 1#, 6# | 0.696 | 0.662 | 0.770 |
| 3#, 4# | 0.681 | 0.896 | 0.857 | 1#, 2#, 3# | 0.847 | 0.720 | 0.936 |
| 3#, 5# | 0.585 | 0.874 | 0.994 | 1#, 3#, 4# | 0.665 | 0.647 | 0.768 |
| 1#, 6# | 0.544 | 0.877 | 0.865 | 1#, 3#, 5# | 0.656 | 0.647 | 0.734 |
| 2#, 6# | 0.347 | 0.894 | 0.799 | 1#, 2#, 6# | 0.863 | 0.872 | 0.941 |
| 4#, 6# | 0.915 | 0.919 | 0.986 | 1#, 4#, 6# | 0.643 | 0.641 | 0.852 |
| 5#, 6# | 0.756 | 0.879 | 0.863 | 1#, 5#, 6# | 0.722 | 0.710 | 0.909 |
| 1#, 3#, 4# | 0.999 | 0.998 | 0.999 | 1#, 6#, 7# | 0.845 | 0.876 | 0.971 |
| 1#, 3#, 5# | 0.835 | 0.887 | 0.887 | 2#, 4#, 6# | 0.953 | 0.853 | 0.922 |
| 2#, 3#, 5# | 0.721 | 0.868 | 0.942 | 1#, 2#, 3#, 4# | 0.725 | 0.648 | 0.744 |
| 1#, 2#, 6# | 0.633 | 0.933 | 0.879 | 1#, 3#, 4#, 5# | 0.497 | 0.499 | 0.775 |
| 1#, 5#, 6# | 0.796 | 0.887 | 0.938 | 1#, 3#, 4#, 7# | 0.515 | 0.649 | 0.837 |
| 2#, 4#, 6# | 0.787 | 0.868 | 0.939 | 1#, 2#, 4#, 6# | 0.768 | 0.895 | 0.911 |
| 2#, 5#, 6# | 0.620 | 0.888 | 0.720 | 1#, 4#, 5#, 6# | 0.977 | 0.969 | 0.992 |
| 4#, 5#, 6# | 0.973 | 0.967 | 0.991 | 1#, 4#, 6#, 7# | 0.999 | 0.999 | 0.990 |
| Working pump configuration in the water intake pump group | Working pump configuration in the water supply pump group | ||||
|---|---|---|---|---|---|
| 2#, 4# | 0.999 | 0.842 | 1#, 4# | 0.648 | 0.834 |
| 2#, 5# | 0.789 | 0.403 | 1#, 4#, 5# | 0.922 | 0.795 |
3.4. An Optimal Scheduling Plan for the Water Intake-Supply Pump Groups
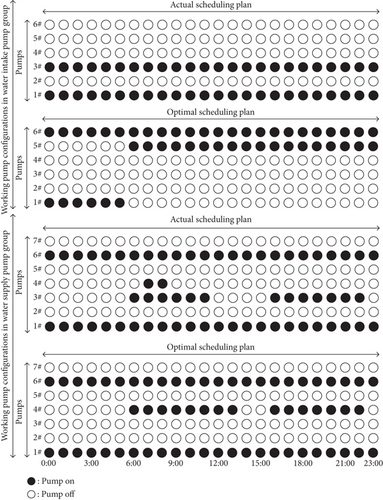
Working pump configurations of actual scheduling plan and optimal scheduling plan in the water intake-supply pump groups in 24 consecutive hours are shown in Figure 7. The main water pipe pressure and VFD pump frequency of actual scheduling plan and optimal scheduling plan in the water intake-supply pump groups in 24 consecutive hours are shown in Figure A3. Specific electric energy consumption and efficiency of actual scheduling plan and optimal scheduling plan in the water intake-supply pump groups in 24 consecutive hours are shown in Figure 8.
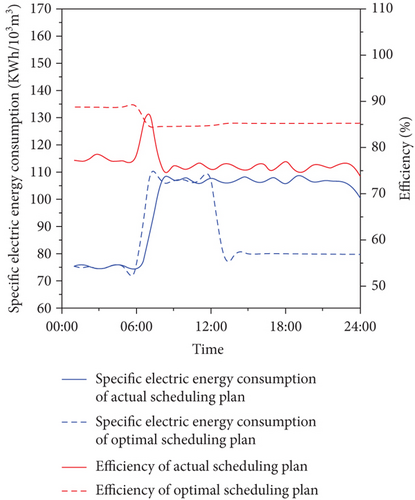
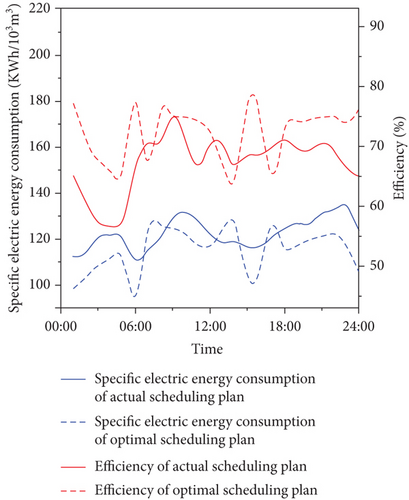
The specific electric energy consumption and efficiency of actual scheduling plan and optimal scheduling plan in the water intake-supply pump groups in 7 consecutive days are shown in Table 3. The operation comparisons of actual scheduling plan and optimal scheduling plan in the water intake-supply pump groups for 7 consecutive days are shown in Table A2.
| Day | Specific electric energy consumption (kWh/103 m3) | Average efficiency (%) | ||
|---|---|---|---|---|
| Actual | Optimal | Actual | Optimal | |
| Day 1 | 106.56 | 97.80 | 72.24 | 88.61 |
| Day 2 | 105.21 | 99.58 | 72.54 | 87.57 |
| Day 3 | 110.20 | 100.41 | 72.03 | 86.10 |
| Day 4 | 116.47 | 102.30 | 72.87 | 84.36 |
| Day 5 | 128.14 | 104.19 | 71.50 | 90.84 |
| Day 6 | 111.79 | 101.87 | 73.18 | 89.83 |
| Day 7 | 112.32 | 100.60 | 73.59 | 86.38 |
The premise to be explained is that the optimal scheduling plan of the water intake-supply pump group meets the following three constraints: the water level of the clean-water reservoir changes within the safe water level, the pressure difference of the main pipe is less than the safe pressure difference, and the VFD pump operates within the high efficiency interval. It can be seen from Table A2 that the pump switch number of the optimal scheduling plan is less than the actual scheduling plan, especially in the water supply pump group. Compared with the actual scheduling plan, which switched 44 times in total, the optimal scheduling plan only switched 26 times. The optimal scheduling plan solved the problem of VFD pumps working out of high-efficiency zone. The VFD pumps of optimal scheduling plan all worked in the range of high-efficiency zone while the numbers of the VFD pumps of actual scheduling plan working out of high-efficiency zone in the water intake pump group and water supply pump group were 34 and 30. The difference was attributed to the intelligent collaborative optimal scheduling method that utilized the frequency modulation effect of the variable frequency pump and replaced switching the pump by adjusting the frequency of the variable frequency pump as much as possible, which could not only prolong the life of the pump but also reduce electrical energy consumption. The specific electrical energy consumption of the optimal scheduling plan and actual scheduling plan in the water intake-supply pump groups during 7 consecutive days is 100.96 and 113.06 kWh/103 m3 (Table 3), respectively. The electrical energy decreased by 10.70%. The average efficiency of the optimal scheduling plan in the water intake-supply pump groups over seven consecutive days was 80.12%, while that of the actual scheduling plan was 72.39%, and the average efficiency was increased by 10.68%. The above results proved that the optimal scheduling plan obtained from the intelligent collaborative optimal scheduling method in the water intake-supply pump groups was more energy-saving and more stable and relied on a smaller number of pump switches.
4. Conclusion
The intelligent collaborative optimal scheduling method was proposed in this study. LSTM was used to predict the flow of the water supply pump group in the next 24 hours, and the flow of the water intake pump group in the next 24 hours was planned according to the water level of the clear reservoir. The DP algorithm was used to obtain the optimal scheduling plan of the water intake-supply pump group in the next 24 hours. Experimental results showed that the intelligent collaborative optimal scheduling plan reduced the pump switch number by 11 times while decreasing electric energy consumption by 10.70% and increasing efficiency by 10.68% compared to the actual scheduling plan. This method made full use of the VFD pumps under the premise of ensuring the flow of the water intake-supply pump groups and the safe change of the main pipe pressure. The unused working pump configurations can be excavated in the future under the premise of ensuring production safety.
This proposed optimization is aimed at real-time data acquisition of water purification plants to show the optimal scheduling scheme. In the next step, an automatic closed-loop control system can be designed to carry out real-time scheduling control of water intake and water supply pumping stations, and more pump combinations can be studied in the future. Finally, due to the actual production process, it will also involve the operation of the pumping station fault and other problems, which need to carry out fault diagnosis and fault maintenance; the future can consider these special factors and design the pumping station fault diagnosis optimization scheduling system.
Abbreviations
-
- RF:
-
- Random forest
-
- ANN:
-
- Artificial neutral network
-
- MLR:
-
- Multiple linear regression
-
- GA:
-
- Genetic algorithm
-
- SVR:
-
- Support vector regression
-
- MARS:
-
- Multivariate adaptive regression splines
-
- PPR:
-
- Projection pursuit regression
-
- KNN:
-
- k-nearest neighbor
-
- PSO:
-
- Particle swarm optimization
-
- LSTM:
-
- Long short-term memory
-
- ENN:
-
- Elman neural network
-
- RNN:
-
- Recurrent neural network
-
- LS:
-
- Least squares
-
- VFD:
-
- Variable frequency drive.
Conflicts of Interest
The authors declare that they have no known competing financial interests or personal relationships that could have appeared to influence the work reported in this paper.
Authors’ Contributions
Dongsheng Wang contributed to the conceptualization and methodology. Peng Zhang participated in the supervision and visualization and wrote, reviewed, and edited the manuscript. Haixiang Ma contributed to the methodology and wrote, reviewed, and edited the manuscript. Zhixuan Li contributed to the methodology and wrote, reviewed, and edited the manuscript. Suqian Xu was responsible for the software and reviewed the manuscript. Chaoqun Tan wrote, reviewed, and edited the manuscript.
Acknowledgments
This work was supported by the National Natural Science Foundation of China (Grant Nos. 52170001 and 52070041).
Open Research
Data Availability
Data is available upon reasonable request from the corresponding author.


