Multiobjective and Coordinated Reconfiguration and Allocation of Photovoltaic Energy Resources in Distribution Networks Using Improved Clouded Leopard Optimization Algorithm
Abstract
In this paper, a multiobjective framework for simultaneous reconfiguration and allocation of photovoltaic (PV) energy resources in radial distribution networks is performed for minimizing the power losses, lowering network loading factor, and reducing cost of energy resources as well as increasing the voltage stability index. A novel algorithm called the improved clouded leopard algorithm is used to find the set of optimum decision factors in the combined execution of restructuring and also PV resource distribution. The clouded leopard optimization (CLO) algorithm, which is widely used, takes its cues from the sleeping and foraging habits of the animal, and the improved CLO (ICLO) is formed using adaptive inertia weight to overcome premature convergence. In five cases of base distribution network and different contribution of reconfiguration and PV allocation, single- and multiobjective approach has been applied on 33- and 69-bus distribution networks. According to the findings, the best case includes simultaneous reconfiguration and PV allocation in the radial networks based on the multiobjective approach unlike the single-objective method which obtained the highest network performance with the best compromise between different goals. Also, in the best lowest losses, the decrease in the network loading and cost of energy resources and the better voltage profile and stability are obtained satisfying the constraints. The losses, network loading, voltage profile, and voltage stability are improved by 60.40%, 37.89%, 6.17%, and 27.5% for 33-bus network and also enhanced by 71.77%, 41.23%, 4.76%, and 20.48% for 69-bus network, respectively. Also, the results showed that network reconfiguration only has the weakest performance among other cases based on reconfiguration or photovoltaic sources. Moreover, the superior capability of the ICLO in addressing the aim of the study is proved in comparison with the traditional CLO and well-known particle swarm optimization (PSO) and manta ray foraging optimization (MRFO) to obtain the better objective value and statistical criteria to solve the best case.
1. Introduction
As a result of the radial configuration and high resistance-to-reactance ratio, distribution networks become more susceptible to severe power losses [1]. In conjunction with nonrenewable energy sources, renewable energies are utilized to supplement primary energy requirements and, in particular, to maximize energy efficiency [2]. The energy generated by renewable energy systems has experienced a notable surge in recent years, primarily driven by technological advancements and the heightened global population awareness [3]. The incorporation of renewable energy sources (RES) into the preexisting infrastructure enhances the distribution network’s overall performance. It consists of the economic benefits of energy cost savings as well as the technical benefits of minimizing power losses as well as the voltage condition improvement [4]. In addition, the topology of a reconfigurable network can be altered by actuating and deactivating power line switches. The reconfiguration of the distribution network is noteworthy due to its potential to enhance power grid performance through a modification of the network topology [5]. Consequently, determining the optimal placement and size of renewable resources within the distribution network is crucial for capitalizing on the benefits of reconfiguring the network and utilizing renewable energy resources. Conversely, the optimal network configuration, including the opening and closing status of the network devices, should be determined [6]. Furthermore, the concurrent utilization of network reconfiguration and renewable energy sources in the operation of distribution networks, aiming to maximize the benefits of these approaches, has been formulated as an optimization problem. This framework necessitates the application of optimization algorithms to ascertain the optimal installation locations and capacities of energy sources, along with determining the optimal opening and closing status of network switches [6, 7]. A variety of algorithms are implemented to ensure that distribution networks function optimally. In order to solve the problem using optimization methods, the objective function and problem constraints must be specified [7]. The capabilities of the optimization methods vary depending on the structure that is presented, and each method possesses a distinct capability in achieving the optimal solution [8]. It is important to acknowledge that optimization methods may fail to produce the optimal solution when the problem’s complexity and various objective functions are taken into account. In such cases, alternative strategies are required to enhance their performance [7, 8]. The reset issue can be resolved by employing various objective functions, including but not limited to power losses, voltage variation, voltage stability index, load imbalance, line current unbalance, dependability, and network security [8, 9]. Because there are many network switches, selecting the best switches to access has turned into an optimization issue, necessitating the use of the optimization technique [10, 11]. Due to their pure and cost-free energy, DG sources built on solar energy sources have received a lot of positive attention recently [12, 13]. The distribution grid is immediately linked to renewable photovoltaic energy systems that are tied to the grid, and these systems send their output electricity into the grid to secure and reliable performance [14, 15]. Therefore, they have an impact on network metrics and variables like the voltage, losses, and dependability, just like other producing units and electrical network components [16, 17]. Therefore, in order to benefit from the advantages of photovoltaic energy sources, locating and determining their optimal capacity in the distribution network is very important because the inappropriate selection of the location and capacity of this type of energy sources in the network can weaken the characteristics of the network compared to the previous state. Therefore, it is feasible to mix the methods of reconfiguring and allocating solar energy resources in the distribution networks and profit from each method’s benefits for the functioning of the distribution network. In this way, while determining the optimal configuration of the network, the best installation location and the optimal capacity of photovoltaic energy sources in the network are determined at the same time so that the best value of the objective function is obtained by satisfying the operating constraints and the constraints related to maintaining the radial state of the network and photovoltaic energy sources. However, a technique of optimization with the desired ability to produce the worldwide answer is required to arrive at the optimum solution. Numerous studies have been done recently on the use of restructuring as well as the best dispersal of distributed generation units and green energy sources in peripheral distribution networks. A tangent golden flower fertilization algorithm is used in [18] to reconfigure the distribution network to reduce power losses by choosing the best locations for the DGs and determining the best network reconfiguration. The optimal location and capacity selection of renewable resources, taking into account the maximum allowable capacity constraint, is described in [19]. The objective is to reduce losses and enhance the voltage profile of distribution grids. Particle swarm optimization with the weighted coefficient method is utilized for this purpose. A stochastic-metaheuristic model is implemented in [20] to allocate renewable resources in a distribution network in accordance with multiple criteria, including minimizing power losses, improving voltage profile and stability, and enhancing network reliability while accounting for resource production and demand uncertainty. The reconfiguration of an imbalanced distribution network to reduce losses and voltage instability is proposed in [21] using an enhanced transient search optimization method. In [22], distribution network restructuring is carried out using the jellyfish search method to improve network user dependability metrics. The parallel slime mold method is used in [23] to show a change framework for a peripheral distribution network combined with DGs in order to reduce active loss, increase voltage stability index, and balance load. The authors of [24] suggested stochastic scheduling for a hybrid system consisting of a photovoltaic array, wind turbines, and a battery storage system integrated into the distribution network. The objective was to reduce energy losses, optimize the voltage profile, and decrease system cost. Additionally, the reliability of the system was enhanced through the implementation of the energy-not-provided index, which accounted for uncertainties in energy source generation and network demand via the unscented transformation. A simultaneous two-problem allocation with multiple objectives is suggested in Ref. [25]. This allocation pertains to an unbalanced distribution network and a hybrid distributed generation system consisting of wind turbines, battery storage, and solar panels. The proposed approach is aimed at reducing overall losses and enhancing power quality. To reduce power losses, [26] applies a simulated ecosystem optimization for network restructuring and DG location. To reduce power loss, a novel paradigm for network reconfiguration (NR) is introduced in [27]. It uses an improved binary cuckoo search method. The restructuring of distribution networks to reduce power loss while taking into account issue restrictions is solved in [28] using an acceleration PSO. To reduce power outages, a chaos search group method is used in [29] to simultaneously reconfigure the distribution network and allocate DGs. In order to reduce the processing load placed on the optimization methods while maintaining control over the discontinuous allocation variables, a mathematical procedure for network restructuring based on the positioning of the soft open point is described in [30]. In [31], a multiobjective mixed integer linear programming model is used to create the restructuring of distribution networks, and this model specifically takes into account the effect of automatic changes on the length of interruptions. In [32], the restructuring of distribution networks is carried out using a flexible multicriteria method via an enhanced coronavirus herd immunity optimizer algorithm to reduce power loss and increase power quality. The best network design for reducing the decreased power losses while considering the load balance index is determined by applying a golden flower fertilization method [33]. Using a mixed water cycle algorithm, a soft open point technique is described in [34] with and without system changes to reduce power losses, improve the voltage profile, and reduce the number of soft open points linked to the network. A moth-flame optimization method is used in [35] to create multicriteria restructuring of distribution networks combined with energy resources in order to reduce power loss and improve dependability.
The literature evaluation has revealed that in coordinated and simultaneous methods of reconfiguration and optimal allocation of PV energy resources, several objectives, including minimizing power losses and voltage deviations, as well as improving voltage stability, have been repeatedly defined as a multiobjective function. However, it can be seen that a comprehensive multiobjective function that has various objectives such as minimizing power losses, improving network voltage characteristics and stability, minimizing investment costs, preserving and replacing energy resources, and especially improving the network loading factor is not well addressed. On the other hand, the review of the current literature shows that metaheuristic techniques have played a major role in solving efficiency problems in the energy delivery network. The complex and nonlinear nature of the subject, practical limitations, and the existence of discrete and continuous variables create major problems in the combined and simultaneous method of reconfiguration and distribution of PV energy sources in the electricity delivery network. In addition to this additional difficulty, the high processing cost of the concurrent approach necessitates the use of a robust method with high closure capability and fast access to the ideal global response. A metaheuristic approach may be good at solving some optimization problems but may not be good at many other problems based on the no free lunch (NFL) theorem [36]. The common issue of reorganization and distribution of solar energy resources in environmental distribution networks requires the development of a new metaheuristic method.
- (i)
Integration of the multiobjective strategy in the distribution network reconfiguration and photovoltaic energy resource allocation in the networks
- (ii)
Formulation of an objective function as minimization of power losses, improvement of network voltage profile and stability, minimization of investment costs, maintenance and replacement of energy sources, and especially the improvement of the network load factor in the presence of the complex and nonlinear nature of the problem, operating constraints and existence discrete and continuous variables
- (iii)
Using the improved clouded leopard optimization (ICLO) algorithm to determine the optimal network structure as well as the optimal installation location and size of photovoltaic energy sources and application of the nonlinear inertia weight reduction technique to improve the CLO [37] convergence capability
- (iv)
Stablishing the superiority of the ICLO in solving the problem over the traditional CLO, PSO, and MRFO approaches
In this paper, the problem formulation that includes objective function, constraints, and fuzzy multiobjective solution method is presented in Section 2. The proposed improved optimizer and its implementation to solve the simultaneous reconfiguration and photovoltaic resource allocation in distribution networks are formulated in Section 3. The simulation results in different cases of reconfiguration and photovoltaic allocation are presented in Section 4, and the findings are concluded in Section 5.
2. Formulation of the Problem
2.1. Objective Function
In this study, the problem of multiobjective and coordinated allocation of photovoltaic energy resources in radial distribution networks is formulated to minimize power losses, improve the voltage stability index, and improve the network load factor, in addition to reducing the cost of photovoltaic energy resources. The broad goal function is described in the sections that follow.
2.1.1. Power Losses
Rij is the resistance of the kth line that connects bus i and j, Iij is the current of the kth line, Pij and Qij are the active and reactive power that flow flow through kth line, Vi is the voltage of the ith bus, and Nbranches is the number of network lines.
2.1.2. Voltage Stability
2.1.3. Network Loading
2.1.4. Cost of PV Energy Resources
2.2. Constraints
- (i)
The voltage limits
- (ii)
The current flow limit
- (iii)
PV power limit
- (iv)
Network radiality constraint
During the reconfiguration process, the radial state of the network must be observed. The details of these are described in Ref. [1].
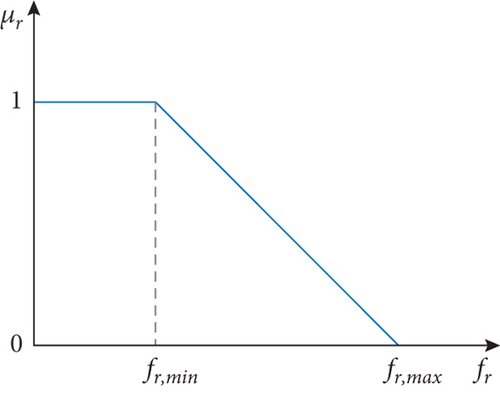
2.3. Fuzzy Multiobjective Solution Method
3. Proposed Optimization Method
3.1. Introduction of CLO Algorithm
The clouded leopard is a cat of average stature; and, it is neither large nor tiny. Clouded leopards are reclusive, timid felines. In the observations, two natural behaviors of clouded leopards have been documented as being more important than the rest [26]. Throughout the day, these animals are found relaxing on the trees. Their primary activity occurs when they descend from the trees at night to forage on the ground. These two prominent behaviors exhibited by clouded leopards served as the primary source of motivation for the clouded leopard optimization (CLO) modeling [26].
3.1.1. Initialization of the CLO Positions
It introduces the populace with the highest health value. The location of the members of the population in the search space is changed, and new fitness values are computed, revising the best population member in each run. The CLO algorithm’s population located in the search area has been updated using mathematical modeling of two clouded leopard actions.
3.1.2. Exploration Phase
3.1.3. Exploitation Phase
The first run of the CLO algorithm is finished by changing the positions of all cloud leopards based on the first and second stages. The CLO algorithm is then run a second time, with each cycle changing the CLO population in equations (21)–(24) until all iterations have been run. The best potential solution saved during the algorithm cycle is selected as the best solution following CLO’s complete implementation. In Pseudocode 1, the CLO pseudocode is displayed.
-
Pseudocode 1: Pseudocode of the CLO algorithm.
-
Start CLO.
-
1. Input: The information of the problem.
-
2. Adjust the iterations number (T) and the algorithm population number (NL).
-
3. Initiate the clouded leopards position using Eqs. (15)-(16) and generation of the objective vector using Eq. (17)
-
4. For t = 1 : T
-
5. For m = 1 : NL
-
6. Phase 1: Exploration
-
7. Consider the target prey position randomly for mth leopard.
-
8. Compute the new position of the mth leopard using Eq. (21)
-
9. Update the mth leopard considering Eq. (22).
-
10. Phase 2: Exploitation
-
11. Compute the new position of the mth leopard considering Eq. (23).
-
12. Update the mth clouded leopard using (24).
-
13. end for
-
14. Print the best solution.
-
15. end for
-
16. Output: The best variable set achieved via CLO
-
End CLO.
3.2. The ICLO
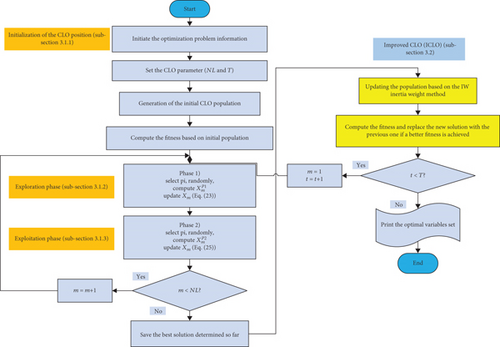
Therefore, the proposed optimization algorithm solves the photovoltaic allocation problem by minimizing the objective function and considering the constraints and determines the optimal variables. According to the presentation of the CLO formulation and its improvement strategy, its flowchart is presented in Figure 2.
3.3. Implementation of the ICLO
The flowchart of ICLO in solving the multiobjective and coordinated reconfiguration and allocation of PV energy resources in the distribution network is shown in Figure 3. Also, the steps of implementing the ICLO to solve the problem are presented as follows:
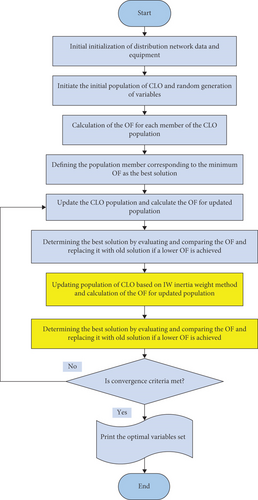
Step 1. Initialization of data for the delivery network and devices. In this stage, the optimization algorithm is updated with power data, network line information, the number of connected lines, solar resource minimal and maximum capacities, and cost data.
Step 2. Initializing the CLO population and creating factors at random. Using trial and error and the writers’ expertise, the algorithm’s maximal repetition and population number are established in this stage. Additionally, each group of factors is decided at random based on the algorithm’s population size, including the equipment’s capability and the equipment’s limitations.
Step 3. Determine the goal function for each CLO community participant. Each collection of factors associated with objective function value is determined.
Step 4. Designating the population member that corresponds to the goal function’s lowest value as the ideal answer. It is decided which individual achieves the greatest goal function.
Step 5. Using CLO to update the algorithm population. The population of the program is changed in this phase to produce new variables.
Step 6. Determine the goal function for the CLO’s revised population from Step 5.
Step 7. Assessing and contrasting the goal function in steps 4 through 6 and then changing the answer to find the best one. The number acquired in Step 4 is changed if the value in Step 6 is higher.
Step 8. The IW inertia weight method-based CLO population update. The population of the program is changed in this phase to produce new variables.
Step 9. Determine the goal function using the revised population from Step 8.
Step 10. Choose the best answer by assessing and contrasting the goal function in Steps 7 and 9 and then changing the answer. If the value acquired in Step 6 is superior to the value of the goal function in Step 9, it is substituted.
Step 11. Have the convergence conditions—achieving the goal function’s lowest value and running the algorithm through its most iterations—been met? Move 5 is the next move to take if the answer is affirmative.
Choosing the factors that best match the objective function as the overall optimum answer, publishing the findings.
Step 12. Stop.
4. Simulation Results
In this section, the simulation results of multiobjective and coordinated reconfiguration and allocation of photovoltaic (PV) energy resource are presented in radial distribution networks to minimize power losses, improve the voltage stability index, enhance the network loading factor, and minimize the cost of energy resource using the ICLO. On bus networks that adhere to IEEE standards 33 and 69, the suggested approach is used. The efficacy of ICLO has been compared with standard CLO, PSO, and MRFO techniques. Each program is said to have a population of 70, a maximum iteration of 300, and a maximum of 25 separate runs. The problem formulation is performed utilizing the MATLAB 2020b program. The proposed methodology includes different cases of application of reconfiguration, and photovoltaic energy resources are presented as follows:
Case 1. Without reconfiguration and photovoltaic energy resource
Case 2. Reconfiguration only
Case 3. Allocation of photovoltaic energy resource
Case 4. Allocation of photovoltaic energy resources after reconfiguration
Case 5. Reconfiguration after the allocation of photovoltaic energy resources
Case 6. Coordinated reconfiguration and allocation of photovoltaic energy resources
4.1. Results of the 33-Bus Test System
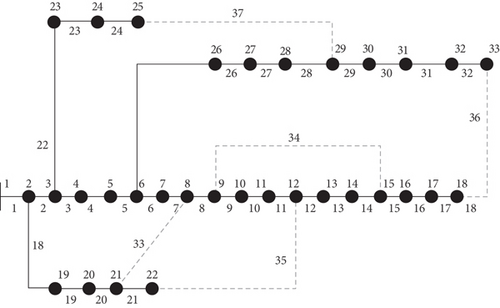
The outcomes of applying the suggested approach to the 33-bus distribution system are shown in this part. Figure 4 displays the 33-bus system’s single-line schematic. This system’s line information is taken from [40]. The overall operating capacity on this network is 3.72 MW and 2.3 MVAr; and it comprises of the 37 lines, including 32 sectionalizing switches and 5 tie switches, on the 33-bus network [40]. The maximum number of PV DG system locations is considered 3 nodes, with each PV system assumed to have a capacity of 2 MW. As a result, the ICLO chooses the best installation location and capacity for PV resources within the distribution network. It also chooses the best situation of the tie lines. Finally, by determining the optimal variables of the problem, the value of different objectives including power losses, minimum VSI, minimum bus voltage of the network, network loading value, and the total cost of photovoltaic energy resources has been determined. According to [1], the investment cost for a PV source per MW in this research is considered $318,000.
4.1.1. Results of Single-Objective Optimization
- (i)
Case 2 (reconfiguration only): introducing reconfiguration reduces power losses to 139.55 kW, but the trade-off is a slight increase in LF to 19.77%. This emphasizes the delicate balance required when optimizing for specific objectives
- (ii)
Case 3 (allocation of PV energy resources): focusing on PV allocation reduces losses further to 73.71 kW, showcasing the potential of renewable energy integration. However, the challenge is apparent in terms of LF, which increases to 8.88%
- (iii)
Case 4 (allocation of PV energy resources after reconfiguration): integrating reconfiguration and PV allocation results in a balance, with power losses at 61.54 kW and LF at 7.97%. This demonstrates the synergy between these strategies
- (iv)
Case 5 (reconfiguration after PV allocation): when reconfiguration is performed after PV allocation, the system aims for VSI maximization. This leads to increased losses (228.91 kW) and a higher LF (18.74%). This highlights the need for a coordinated approach
- (v)
Case 6 (coordinated reconfiguration and PV allocation): the most comprehensive scenario involves simultaneous reconfiguration and PV allocation. This achieves the lowest losses at 54.20 kW and a reasonable LF of 6.88%, but at the cost of a higher VSI (1.0076). The trade-offs between these objectives are evident, emphasizing the need for a holistic and coordinated optimization approach
| Scenarios | Function | Optimal configuration | Size and location of DG (MW) | Minimum voltage (p.u.) | Minimum VSI (p.u.) | Losses (kW) | LF (%) | DG cost (M$) |
|---|---|---|---|---|---|---|---|---|
| Base case | — | 33, 34, 35, 36, 37 | — | 0.9131 | 0.6960 | 202.68 | 19.61 | — |
| Reconfiguration | Losses | 32, 14, 9, 37, 7 | — | 0.9378 | 0.7751 | 139.55 | 19.77 | — |
| Voltage stability | 14, 7, 9, 27, 32 | — | 0.9398 | 0.7816 | 143.3 | 18.78 | — | |
| Loading | 32, 20, 28, 13, 11 | — | 0.9294 | 0.7470 | 184.74 | 15.4 | — | |
| DG allocation | Losses | 33, 34, 35, 36, 37 |
|
0.9606 | 0.8526 | 73.71 | 6.39 | 1.91 |
| Voltage stability | 33, 34, 35, 36, 37 |
|
0.9945 | 0.9806 | 202.28 | 23.82 | 3.67 | |
| Loading | 33, 34, 35, 36, 37 |
|
0.9583 | 0.8443 | 75.80 | 8.88 | 1.73 | |
| DG allocation after reconfiguration | Losses | 32, 14, 9, 37, 7 |
|
0.911 | 0.9765 | 61.54 | 7.97 | 2.14 |
| Voltage stability | 14, 7, 9, 27, 32 |
|
0.9968 | 0.9976 | 228.91 | 18.74 | 3.84 | |
| Loading | 32, 20, 28, 13, 11 |
|
0.9732 | 0.8988 | 61.85 | 6.52 | 2.25 | |
| Reconfiguration after DG allocation | Losses | 7, 14, 8, 36, 28 |
|
0.9736 | 0.8986 | 57.76 | 8.44 | 1.91 |
| Voltage stability | 13, 22, 31, 19, 8 |
|
0.9999 | 1.0001 | 318.39 | 27.7 | 3.83 | |
| Loading | 36, 23, 21, 11, 20 |
|
0.9477 | 0.8075 | 112.39 | 7.48 | 1.73 | |
| Simultaneous reconfiguration and WT allocation | Losses | 30, 28, 6, 11, 14 |
|
0.9698 | 0.8859 | 54.2 | 6.88 | 1.8 |
| Voltage stability | 9, 17, 21, 4, 18 |
|
1 | 1.0076 | 286.92 | 20.44 | 4.2 | |
| Loading | 5, 13, 6, 16, 10 |
|
0.9752 | 0.9049 | 62.87 | 5.1 | 2.26 | |
In summary, the table underscores the complexity of optimizing a distribution system with multiple objectives. The chosen strategy significantly impacts various performance indices, and a trade-off analysis is essential for making informed decisions in designing an efficient and resilient distribution system.
4.1.2. Multiobjective Optimization Results
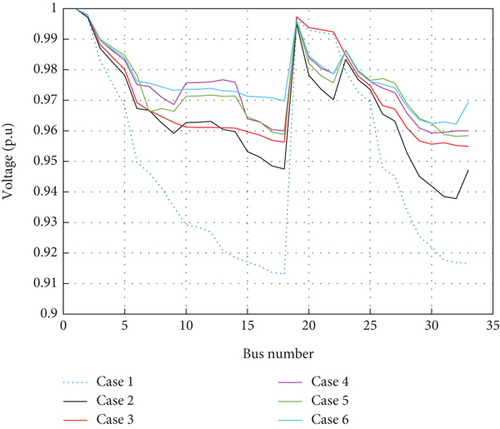
Table 2 presents the summary of the simulating results of the multiobjective modeling using the ICLO. Numerous instances of network efficiency improvement have been carried out utilizing fuzzy methods and multiobjective optimization. The ICLO is used for all improvements in various situations, and the four-goal functions of power loss mitigation, voltage stability improvement, load factor improvement, and PV cost reduction are taken into account. Table 2 lists the outcomes of the IEEE 33-bus network improvements. According to the multiobjective problem solution, the working point of the network is always in optimum conditions, and all wanted objective functions have appropriate conditions, as can be seen in Table 2. As can be seen, Case 2’s change alone is unable to narrow the gap between the network’s working point and ideal conditions, but in other instances where photovoltaic energy sources are present, the network’s operating conditions are ideal. Except for Case 2, every scenario has losses under 100 kW, a lowest VSI of over 0.83 p.u., and a lowest minimum voltage of over 0.95 p.u. Also, the results showed increasing network loading in Case 2 (reconfiguration only). Therefore, according to Case 6 (simultaneous reconfiguration and DG placement), the network’s working point has improved as a result of multiobjective problem-solving, and the network’s efficiency has improved overall by more increasing the voltage minimum and stability and more reducing the power losses and also DG cost. The minimal voltage value, minimum VSI value, power loss, LF, and cost of PV resources are each 0.9695 p.u., 0.8843 p.u., 80.27 kW, 12.18%, and 0.755 M$ in Case 6, respectively. As a result, the optimization algorithm in Case 6 has obtained the highest performance of the 33-bus distribution network by concurrently using the restructuring and allotment of photovoltaic energy resources.
| Case | Definition | Optimal configuration | Location and size of DG (MW) | Minimum voltage | Minimum VSI | Power loss | LF | DG cost (M$) |
|---|---|---|---|---|---|---|---|---|
| 1 | Base case | 33, 34, 35, 36, 37 | — | 0.9131 | 0.6960 | 202.68 | 19.61 | — |
| 2 | Reconfiguration | 32, 14, 9, 37, 7 | — | 0.9378 | 0.7751 | 139.55 | 19.77 | — |
| 3 | DG placement | 33, 34, 35, 36, 37 |
|
0.9549 | 0.8325 | 97.08 | 9.49 | 0.914 |
| 4 | DG placement after reconfiguration | 32, 14, 9, 37, 7 |
|
0.95600 | 0.8542 | 82.2 | 11.55 | 0.764 |
| 5 | Reconfiguration after DG placement | 6, 9, 14, 30, 37 |
|
0.9584 | 0.8487 | 81.82 | 12.15 | 0.764 |
| 6 | Simultaneous reconfiguration and DG placement | 7, 9, 14, 30, 37 |
|
0.9695 | 0.8843 | 80.27 | 12.18 | 0.755 |
It can be seen in Table 2 that, in general, the various objectives in all cases have been improved compared to Case 1 (the base case of the network without reconfiguration or photovoltaic sources). Also, the amount of these improvements for Case 6, which is the simultaneous use of reconfiguration and photovoltaic sources, has been better in the set of all objectives. On the other hand, the value of minimum voltage and minimum VSI has been obtained more. However, the total objectives should be considered. Of course, the proposed methodology has improved voltage conditions and also other objectives, i.e., reducing power losses and reducing network loading.
The network voltage profile in different cases are shown in Figure 5. As it is known, different cases have led to the improvement of the voltage profile of the 33-bus distribution network. As can be seen, based on the voltage profile curve and also the numerical results of Table 2, Case 6 has a higher minimum voltage value (0.9695 p.u.) than the rest of the cases. This means that Case 6 has further improved the voltage profile of 33-bus network.
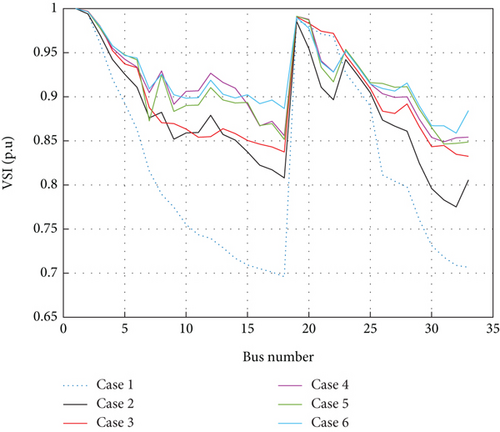
The changes of the VSI for different cases are depicted in Figure 6. As it is clear, the voltage stability index is enhanced for different cases compared to the base 33-bus network. According to Figure 6, it can be seen that Case 6 has obtained a higher value of the minimum VSI (0.8843 p.u.) compared to other cases by simultaneously using the rearrangement and allocation of photovoltaic resources.
4.1.3. ICLO Comparison (33-Bus Network)
The effectiveness of the ICLO in handling Case 6 has been contrasted with traditional CLO, PSO, and MRFO techniques in this part. Figure 7 depicts the convergence of various algorithms and demonstrates the ICLO’s supremacy in reaching a reduced objective function value with a higher convergence speed in fewer convergence iterations. Contrarily, it is evident from the conventional CLO method’s convergence process that enhancing its performance in the form of the ICLO has resulted in the fast accomplishment of the optimum solution and avoided the enhanced algorithm’s early convergence. Therefore, based on the weight of the adaptive inertia, the discovery power of the traditional CLO has increased, and thus it is not trapped in the local optimum like other algorithms and has been able to achieve a lower objective function value, which has resulted in achieving better objectives compared to other algorithms.
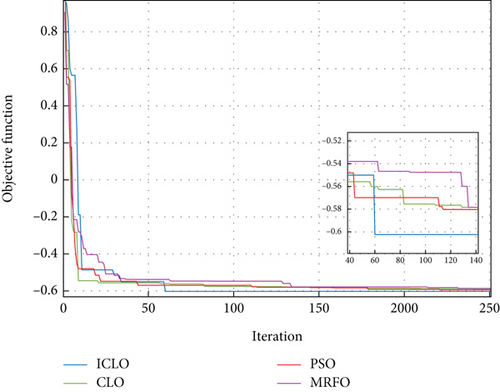
Table 3 provides the exact outcomes of various methods used to solve Case 6. As shown in Table 3, the ICLO achieved the lowest power losses and the greatest VSI and LF values in comparison to other techniques, and it also obtained a superior solution value with a reduced objective function. As shown in Table 4 of the findings, the ICLO is better at achieving statistical analysis metrics than other approaches and is better able to boost the efficiency of the 33-bus network.
| Item/method | ICLO | CLO | PSO | MRFO |
|---|---|---|---|---|
| Optimal configuration | 7, 9, 14, 30, 37 | 7, 9, 13, 32, 37 | 6, 9, 14, 30, 37 | 7, 9, 13, 17, 28 |
| Location (bus) and size of DG (MW) |
|
|
|
|
| Minimum VSI (p.u.) | 0.8843 | 0.8576 | 0.8643 | 0.8441 |
| Power loss (kW) | 80.27 | 82.67 | 81.88 | 82.97 |
| LF (%) | 12.18 | 11.62 | 11.57 | 11.28 |
| DG cost (M$) | 0.755 | 0.773 | 0.767 | 0.781 |
| OF | -0.6024 | -0.5921 | -0.5960 | -0.5906 |
| Algorithm/index | Best ($) | Worst ($) | Mean ($) | Std ($) |
|---|---|---|---|---|
| ICLO | -0.6024 | -0.5731 | -0.5892 | -0.0474 |
| CLO | -0.5921 | -0.5207 | -0.5675 | -0.0785 |
| PSO | -0.5960 | -0.5631 | -0.5822 | -0.0503 |
| MRFO | -0.5906 | -0.5439 | -0.5746 | -0.0617 |
4.2. Results of the 69-Bus Test System
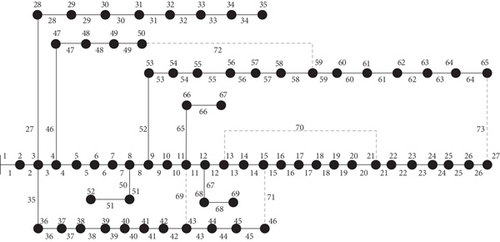
The findings of the suggested approach for the 69-bus dispersal system are given in this part. Figure 8 depicts the 69-bus system’s single-line schematic. This system’s line information is taken from [41]. This network’s overall operating capacity is 3.802 MW and 2.696 MVAr. There are 73 lines total in the 69-base network, including 68 sectionalizing switches and 5 connection lines [41]. Three photovoltaic generators with a combined peak output of 3 MW have been erected for this research. As a result, the ICLO chooses the best position, capacity, and power factor for photovoltaic resources within the distribution network in addition to the best amount of connection lines. The values of each power loss goal, the VSI index, the load factor, the revenue from the selling of resource power, and the cost of resources have all been computed by effectively finding the decision factors. Based on Ref. [1], the funding cost for a photovoltaic source per MW in this research is $318,000.
4.2.1. Results of Multiobjective Optimization
Table 5 lists the outcomes of the various instances using a multiobjective strategy and the ICLO. According to the simulation results in the initial condition, 224.72 kW, 0.6844 p.u., and 20.23%, respectively, are the values for power loss, minimal VSI, and LF. According to the multiobjective problem solution, the working point of the network is always in ideal conditions, and all wanted objective functions are always in appropriate conditions, as shown by the findings of Table 5. As can be seen, network restructuring by itself is unable to operate at a place that is even remotely near ideal circumstances, but in other situations, PV implementation enhances network performance. The lowest VSI is greater than 0.81 p.u., the lowest minimum voltage is greater than 0.95 p.u., and the losses are all less than 81 kW, except the change alone. Therefore, it can be said that the network working aspect has been enhanced by a multiobjective method solution. Case 5 displays the greatest network performance when compared to the other instances, with the lowest voltage, VSI, power loss, LF, and cost of PV resources being equivalent to 0.9525 p.u., 0.8246 p.u., 63.43 kW, 11.89%, and 0.705 M$, respectively. As a result, the optimization program in Case 5 has obtained the highest performance of the 69-bus distribution network through a synchronous and integrated strategy based on restructuring and PV allotment.
| Case | Definition | Optimal configuration | Location and size of DG (MW) | Power loss (kW) | Minimum VSI (p.u.) | Minimum voltage (p.u.) | LF (%) | DG cost (M$) |
|---|---|---|---|---|---|---|---|---|
| 1 | Base case | 69, 70, 71, 72, 73 | — | 224.72 | 0.6844 | 0.9092 | 20.23 | — |
| 2 | Reconfiguration | 10, 19, 14, 44, 51 | — | 107.46 | 0.7855 | 0.9414 | 17.08 | — |
| 3 | DG placement | 69, 70, 71, 72, 73 |
|
81.99 | 0.9054 | 0.9752 | 8.766 | 2.37 |
| 4 | DG placement after reconfiguration | 10, 19, 14, 44, 51 |
|
64.48 | 0.8167 | 0.9506 | 10.71 | 0.667 |
| 5 | Reconfiguration after DG placement | 14, 15, 21, 43, 62 |
|
60.77 | 0.8144 | 0.9500 | 6.80 | 2.37 |
| 6 | Simultaneous reconfiguration and DG placement | 10, 14, 18, 45, 53 |
|
63.43 | 0.8246 | 0.9525 | 11.89 | 0.705 |
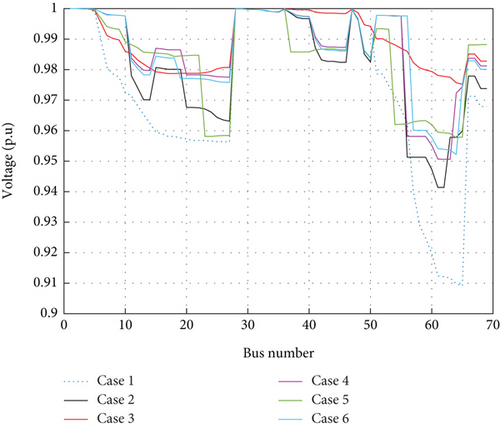
The voltage profile of the 33-bus network in different cases are plotted in Figure 9. According to Figure 9, the voltage profile of the network is improved in different cases in comparison with the base network.
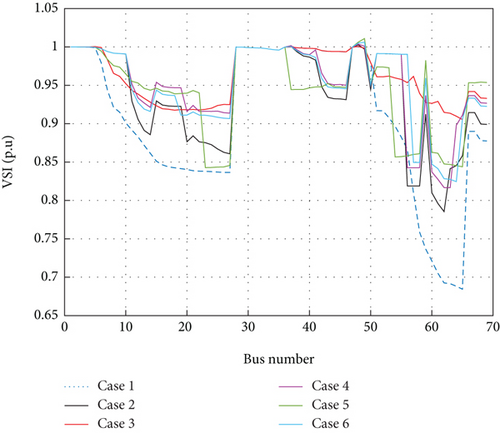
The variations of the VSI for different cases are depicted in Figure 10. As shown as in Figure 10, the voltage stability index is improved for different cases compared to the base 33-bus network.
4.2.2. ICLO Comparison (69-Bus Network)
In this section, the performance of ICLO to solve Case 5 for the 69-bus network has been verified with the CLO, PSO, and MRFO algorithms. The convergence curve of different algorithms is shown in Figure 11, which clears the better convergence performance of the ICLO in achieving a lower objective function with higher convergence speed. Based on the convergence process of the conventional CLO, it is clear that enhancing its capability in the form of the ICLO has prevented the premature convergence of the improved algorithm.

The results obtained from different algorithms in solving Case 5 for the 69-bus network are presented in Table 6. As given in Table 6, the ICLO, compared to other methods, obtained a lower objective function and reached the lowest losses and the highest minimum VSI and LS values. Also, the ICLO achieved better statistical analysis indices, according to Table 7, compared to other methods.
| Item/method | ICLO | CLO | PSO | MRFO |
|---|---|---|---|---|
| Optimal configuration | 10, 14, 18, 45, 53 | 10, 14, 19, 46, 53 | 10, 14, 19, 22, 44 | 10, 13, 20, 47, 73 |
| Location (bus) and size of DG (MW) |
|
|
|
|
| Minimum VSI (p.u.) | 0.8246 | 0.8119 | 0.8024 | 0.7942 |
| Power loss (kW) | 63.43 | 66.28 | 67.98 | 73.03 |
| LF (%) | 11.89 | 11.50 | 11.38 | 11.19 |
| DG cost (M$) | 0.705 | 0.679 | 0.671 | 0.687 |
| OF | -0.6496 | -0.6442 | -0.6483 | -0.6397 |
| Algorithm/index | Best ($) | Worst ($) | Mean ($) | Std ($) |
|---|---|---|---|---|
| ICLO | -0.6496 | -0.6343 | -0.6437 | -0.0339 |
| CLO | -0.6442 | -0.6215 | -0.6394 | -0.0617 |
| PSO | -0.6483 | -0.6326 | -0.6411 | -0.0372 |
| MRFO | -0.6397 | -0.6204 | -0.6355 | -0.0643 |
5. Conclusion
- (i)
The results demonstrated that single-objective optimization did not result in a balance between various objectives and, in some cases, actually diminished some objectives
- (ii)
Based on ICLO-based multiobjective strategy, by making compromises between all objectives, the network performance is more improved compared to single-objective optimization. Also, all the targets have been significantly improved compared to their values in the basic state of the network
- (iii)
Case 6 including the reconfiguration and allocation of photovoltaic resources in the network has the best performance, and the weakest performance is the case of only network reconfiguration
- (iv)
In comparison to the other cases, Case 6 involves the reconfiguration and allocation of PV in distribution networks to achieve the best solution, the least amount of power loss, the greatest possible minimal VSI, and the least amount of LF
- (v)
In Case 6, losses and LF dropped for the 33-bus network by 60.40% and 37.89% and for the 69-bus network by 71.77% and 41.23%
- (vi)
In comparison to the basic distribution network, the minimum VSI for the 33-bus and 69-bus networks rose by 27.05% and 20.49%, respectively
- (vii)
The superiority of the ICLO is proved to solve the Case 6 to obtain the better objective function value (lowest value) as well as better statistical criteria in comparison with the traditional CLO, PSO, and MRFO algorithms
- (viii)
To achieve better objectives value, the ICLO’s dominance over traditional CLO, PSO, and MRFO techniques in handling Case 6 was demonstrated
The lack of access to real data and the costs of developing photovoltaic energy sources is one of the limitations of the research. For the future work, integrated multiobjective reorganization with photovoltaic/wind/battery energy microgrid optimization in distribution networks with the aim of improving the reliability and power efficiency indicators of the network is proposed.
Conflicts of Interest
The authors declare no conflicts of interest.
Authors’ Contributions
The authors confirm the final authorship for this manuscript. All the authors have equally contributed to this manuscript.
Acknowledgments
The authors extend their appreciation to the Deputyship for Research and Innovation, Ministry of Education in Saudi Arabia, for funding this research work through project number 223202.
Open Research
Data Availability
Data are available on request.


