Performance of Genotype by Environmental Interaction and Stability of Faba Bean (Vicia faba L.) Genotypes in Vertisol Areas of Amhara Region, Ethiopia
Abstract
Faba beans are leguminous plants that have gained recognition for their significant contributions to sustainable agriculture and climate change mitigation. The experiment was conducted to assess the effect of genotype × environment interaction (GEI) on seed weight stability of faba bean genotypes using 12 genotypes in randomized complete block design with three replications tested at Enewari, Bichena, and Jamma in 2016, 2017, and 2018. The objective of the study is to determine the performance and stability of faba bean genotypes for large seed sizes and comparable seed yield under vertisol areas. The AMMI analyses revealed significant (p < 0.01) differences between genotype and environmental effects as well as genotype-by-environment interaction concerning seed yield and seed weight. This indicates the genotypes differently responded to the changes in the test environment or the test environment differentially discriminated the genotypes or both. The analysis of variance for AMMI showed that environment, genotype, and GEI contributed 37%, 26.7%, and 30.4% for seed weight, respectively. The principal components (IPCA 1) and (IPCA 2) explained 54.46% and 20.5% of the interaction, respectively. G4 was identified for their best seed weight with an advantage of 19.9% and 28.1% over the best standard check Hachalu and Dide’a with comparable seed yield. Based on AMMI and ASV stability parameters among the evaluated faba bean genotypes, G4 (EH01078-4-3) was the most stable and widely adapted over the studied environments in terms of seed weight and relatively stable and comparable seed yield. Therefore, the identified genotypes G4 (Shewa) were released as new varieties for vertisol areas of the Amhara region and areas with similar agroecology in the country.
1. Introduction
Faba bean (Vicia faba L.) is a highly significant cool-season food legume worldwide. It is widely cultivated in Ethiopia, particularly in various soil types, such as Cambisol, Nitosol, and Vertisol. Ethiopia holds the position of being Africa’s leading producer of faba bean and the second largest globally, second only to China [1]. According to 2019 report by the Central Statistical Agency (CSA), faba bean cultivation covers approximately 0.5 million hectares of land in Ethiopia, with an annual national production of 1.0 million tons and a productivity rate of 2.1 tons per hectare. Ethiopia is one of the world’s largest exporters of faba beans (19%) next to China (30%) [2]. It contributes a lot to sustainable agriculture and climate change mitigation, by nitrogen fixation process improves soil health and increases carbon sequestration in the soil, have lower greenhouse gas emissions due to less nitrogen fertilizer required, which is a significant source of nitrous oxide, a potent greenhouse gas [3, 4] and also contribute to biodiversity conservation by promoting crop rotation and diversification in agricultural systems (break pest and disease cycles), contribute to food security by diversifying diets, improving nutrition as poor man meat [5, 6, 7].
Despite its extensive land coverage and crucial role in ensuring food security, providing income to farmers, and contributing to the country’s foreign currency earnings [8, 9], faba bean productivity falls significantly short of its potential, which exceeds 5 tons per hectare [10]. The important thing that provides a comprehensive overview of the main factors contributing to the low productivity of faba bean production. These factors include lack of stability, diseases, pest infestations, waterlogging, and adverse weather conditions [11, 12]. Addressing these constraints is crucial for improving faba bean yield and maximizing its potential as a vital crop for food security and economic development in Ethiopia. Researchers have employed a direct selection method since 2002 to address the challenges posed by waterlogging in the highland vertisol of Ethiopia, which significantly affects faba bean production. This approach involves screening different genotypes under waterlogged conditions to identify varieties that exhibit tolerance to waterlogging stress [13].
One of the challenges in assessing faba bean yield and quality is the differential response of genotypes to variable environmental conditions [14]. Environmental fluctuations can have a significant impact on the yield, making it unstable. To address this issue, it is important to use widely adaptable genotypes that can perform well across a range of environments. Evaluating genotype adaptability and stability in different environments requires multienvironment trials (METs) [15, 16].
METs allow breeders and agronomists to study genotype × environment interactions (GEI) and identify the best-performing genotypes in different environments [17]. By conducting experiments in METs, researchers can better understand and analyze how climate change affects genotype responses in different environments. This information is crucial for identifying stable and widely adapted genotypes that can be recommended for production in target environments.
Given the large fluctuations in climatic factors from year to year, yield stability of faba bean under different climatic and soil conditions is an important parameter for sustainable farming systems [18]. By focusing on stable genotypes and understanding their performance across various environments, farmers can enhance their resilience to climate change and improve faba bean production over the long-term [19].
In summary, addressing the factors contributing to low productivity in faba bean production requires an understanding of genotype adaptability and stability, analyzing genotype × environment interactions, and conducting METs [20]. Thus, stable and widely adapted genotypes can be identified and recommended for production, thereby contributing to sustainable farming systems and food security. The genotype × environment (G × E) interaction is of major importance for breeders, given that phenotypic responses to changes in the environment are different among genotypes [21]. Different authors [22] reported high G × E interaction effects in faba bean genotypes grown in Ethiopia. Strong G × E interactions for quantitative traits such as seed yield can severely limit the selection gain of superior genotypes for improved cultivar development [14]. For cultivars selected for a large group of environments, evaluating the stability of performance and the range of adaptation has become increasingly important.
Various analytical methods have been used to explore GEI and to identify superior genotypes with wide or specific adaptations to different environments. The additive main effects and multiplicative interaction (AMMI) and genotype main effects are the most frequently used models for statistical analyses of METs [23]. Another approach called AMMI stability value (ASV), which is based on the first and second interaction principal component axis (IPCA) scores of the AMMI model for each genotype, has also been developed. ASV measures the distance from the genotype coordinate point to the origin in a two-dimensional scatter diagram of IPCA2 against IPCA1 scores. Genotypes with the lowest ASV values were identified by their shortest projection from the biplot origin and were considered the most stable.
The main objectives of faba bean breeding in Ethiopia are to improve productivity by developing and encouraging improved cultivars with high and stable yields and resistance to major biotic and abiotic stresses [13]. Recently, there has been a significant focus on the development of faba bean varieties with larger seeds to enhance their economic characteristics. This has garnered increased interest, particularly because large-seeded faba beans are important for the export quality. However, the improvement in seed weight may be limited owing to the negative impact on grain yield caused by selective breeding. Therefore, to improve seed weight through selection, a compromise for seed yield must be made or the breeder must set minimum standards for one trait while selecting another. Another option is to follow separate breeding programs for seed size and seed yield, rather than trying to achieve a large seed size combined with high grain yield in a single genotype [24]. Large-sized faba bean seeds, varieties are preferred by consumers in the local market and fetch premium prices in the international market which have seed weight of >800 g in 1,000 seeds [9]. Hence, the objective of this study was to determine the performance and stability of faba bean genotypes for large seed size and stress tolerance (waterlogging) with comparable seed yield in vertisol areas of the Amhara region.
2. Materials and Methods
The experiment was conducted under rainfed conditions for three consecutive years during the main cropping season in Amhara Regional State, Ethiopia. All the study locations and the district as a whole experience a uni-modal rainfall pattern. The dominant soil type in both the experimental locations and the district is Vertisol. The description and physiochemical of the study area are presented in Table 1. This area is known for its potential in faba bean production. The production system in the study area is a mixed-crop livestock agricultural system, in which smallholder farmers practice crop and livestock production.
| Location | Altitude (masl) | Rainfall (mm) | Mean temperature (°C) | Soil type | Global position | |||||
|---|---|---|---|---|---|---|---|---|---|---|
| Max (°C) | Min (°C) | Latitude | Longitude | |||||||
| Enewari | 2,680 | 1,219.3 | 20.6 | 9.62 | Vertisol | 9°52′ N | 38°12′N | |||
| Bichena | 2,600 | 1,126.4 | 23.5 | 10.7 | Vertisol | 10°27′ N | 38°12′N | |||
| Jamma | 2,630 | 988.3 | 20.7 | 9.6 | Vertisol | 10°27′N | 39°15′ N | |||
| Locations | Physical property | Chemical properties | ||||||||
| Clay (%) | Silt (%) | Sand (%) | Texture class | Soil PH | SOM (%) | TN | avP mg/kg | avS mg/kg | CEC (Cmol/kg) | |
| Enewari | 18 | 76 | 6 | Clay | 6.8 | 1.56 | 0.087 | 6.95 | 5.62 | 40.0 |
| Jamma | 20 | 75 | 5 | Clay | 6.5 | 1.46 | 0.085 | 6.79 | 5.02 | 39..6 |
| Bichena | 19 | 74 | 7 | Clay | 6.03 | 1.55 | 0.083 | 6.35 | 5.25 | 39.7 |
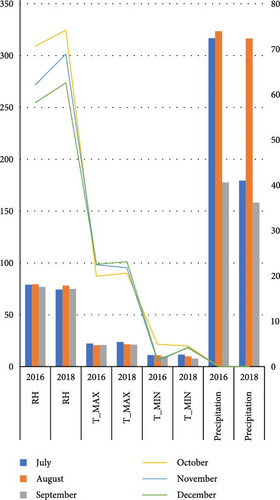
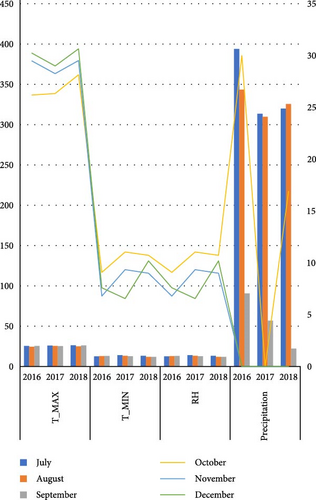
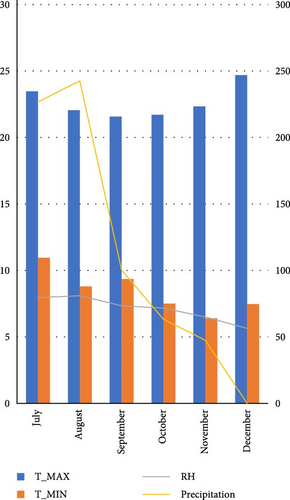
Nine faba bean genotypes which were promoted from 46 genotype preliminary variety trials to regional variety trials including two standard checks (Hachalu and Dide’a) and local (Table 2) were tested using randomized complete block design with three locations at Enewari (2016–2018) for 3 years, Jamma (2016–2017) for 2 years, and Bichena (2018) for 1 year. Each location by year combination was considered as one environment, that is, a total of six environments. A description of the test site is provided in Table 1 and also the differences in temperatures and the rainfall of the growing season are indicated in Figure 1. The trial was conducted using broad bed furrow (BBF) from the last week of June to first week of July in a randomized complete block design with three replications. Sowing was performed using the hand drilling method with 40 seeds per row and 160 seeds per plot. The plot size was 4 m x 2. 4 m with four rows for each entry. The spacing was 1.5, 0.4, and 0.1 m between replication, plots, and plant, respectively. Fertilizer application was 121 kg/ha NPS at planting. Hand weeding was performed three times: at 2 weeks after emergence, before flowering, and after flowering. Agronomic data were collected on a plot- and plant-based basis. Some of the data were taken from the plant base (10 plants for recording plant height and number of pods per plant), number of seeds per pod and 100 seeds weight (g), and seed yield in kilogram per hectare (from the central two rows).
| Genotype | Genotype code | Remarks |
|---|---|---|
| EH01036-2-4 | G1 | Advanced breeding line |
| EH01036-2-3 | G2 | Advanced breeding line |
| EKLs/CSR02010-4-2 | G3 | Advanced breeding line |
| EH01078-4-3 | G4 | Advanced breeding line |
| EH01078-4-1 | G5 | Advanced breeding line |
| EH01036-2-2 | G6 | Advanced breeding line |
| EH01036-2-1 | G7 | Advanced breeding line |
| EH00098-2-2 | G8 | Advanced breeding line |
| KCSR 0101 | G9 | Advanced breeding line |
| Hachalu | G10 | Released variety |
| Dide’a | G11 | Released variety |
| Local | G12 | Local used farmer variety |
3. Statistical Data Analysis
4. Results and Discussion
4.1. Performance of Genotype
Statistical analysis of 100-seed weight and seed yield revealed significant variations among the different genotypes tested in each respective environment, as shown in Table 3. Bartlett’s test confirmed that the error variance for seed weight and seed yield was homogeneous across all six environments, allowing for pooled analysis and a combined analysis of variance. The average performance of the 12 faba bean genotypes across the six locations (environments) demonstrated significant variations among genotypes, locations, and management practices for both seed yield and seed weight, as presented in Table 4. Previous reports have also shown the presence of significant effects of the G × E interaction on grain yield in faba bean in different sets of environments in Ethiopia [28, 29, 30]. The mean seed yield of genotypes across the environment (year × location) ranged from 3.2 to 4.2 t/ha. Among all genotypes, EH 01078-4-1 yielded the lowest yield (Table 5). The highest grain yield was obtained by genotype Hachalu, EH01036-2-4, followed by EH01078-4-3, but the difference was not statistically nonsignificant between them. Results for 100 seed weights are shown in Table 4. Across all sites, there were highly significant differences among genotypes in 100 seed weights (g). On the other hand, across all sites, the result obtained showed highly significant differences among genotypes with respect to number of pods per plant. Similar results were obtained by Sharifi [31] who found highly significant differences between faba bean genotypes in 100 seed weights. Thousand-seed weight was a characteristic that was affected by the environment and genotype equally. It is well-known that 100 seed weights is highly heritable, as it is controlled by an additive gene action. The seed weights of the genotypes ranged from 35 to 80.2. Genotype EH01078-4-3 achieved the highest seed weight, followed by EH01036-2-3 and EHO1036-2-4. EH01078-4-3 exhibited a seed weight advantage of 19.9% and 28.1% over the standard check Hachalu and Dide’a, respectively, a statistically significant difference. The number of pods per plant for these genotypes ranged from 12.2 to 17.1, indicating variability in pod production. Similarly, plant height ranged from 82.6 to 87.9 cm among these genotypes. The number of pods per plant of the genotypes ranged from 12.2 to 17.1, whereas plant height ranged from 82.6 to 87.9 cm.
| Genotype | Enewari | Bichena | Jama | Overall mean | |||
|---|---|---|---|---|---|---|---|
| 2016 | 2017 | 2018 | 2018 | 2016 | 2018 | ||
| EH01036-2-4 | 3.5ab | 4.3abc | 3.1 | 5.1abc | 4.7a | 3.9ab | 4.1 |
| EH01036-2-3 | 2.4c | 4.3abc | 2.8 | 4.9bcd | 4.6a | 2.6de | 3.6 |
| EKLs/CSR02010-4-2 | 3.5ab | 3.8bcde | 3.4 | 4.5cde | 3.9abc | 3.6abc | 3.8 |
| EH01078-4-3 | 3.5ab | 4.0bcd | 3.5 | 5.5ab | 4.2ab | 2.8de | 3.9 |
| EH01078-4-1 | 3.2ab | 3.5cde | 3.4 | 3.2f | 3.2cd | 2.5e | 3.2 |
| EH01036-2-2 | 3.4ab | 4.0bcd | 3.3 | 5.2abc | 3.7bcd | 2.8de | 3.7 |
| EH01036-2-1 | 3.3ab | 4.2abc | 3.4 | 5.2abc | 3.0d | 3.7abc | 3.8 |
| EH00098-2-2 | 2.8bc | 4.4ab | 2.9 | 3.9ef | 3.1cd | 3.3bcd | 3.4 |
| KCSR0101 | 3.6a | 3.4de | 3.1 | 4.0def | 4.3ab | 3.0cde | 3.6 |
| Hachalu | 3.2ab | 5.0a | 3.3 | 5.9a | 3.7bcd | 3.8ab | 4.2 |
| Local | 3.0abc | 3.0e | 2.9 | 5.7ab | 3.9abc | 4.1a | 3.8 |
| Dide’a | 3.3ab | 4.4ab | 3.3 | 5.6ab | 4.1ab | 3.2bcde | 4.0 |
| Mean | 3.2 | 4.0 | 3.2 | 4.9 | 3.9 | 3.3 | 3.8 |
| CV | 12.2 | 10.8 | 11.1 | 11.2 | 11.7 | 12.1 | — |
- a–f: The superscripts indicate the level of significance in mean difference comparison according to Duncan’s multiple range test at the 5% level.
| Genotype | Enewari | Jamma | Bichena | Overall means | |||
|---|---|---|---|---|---|---|---|
| 2016 | 2017 | 2018 | 2016 | 2018 | 2018 | ||
| EH01036-2-4 | 77.2a | 89.9a | 61.4e | 78.0a | 75.0cd | 94.5c | 79.3 |
| EH01036-2-3 | 53.1eg | 74.4b | 86.3a | 59.5ef | 85.0ab | 119.0a | 79.5 |
| EKLs/CSR02010-4-2 | 60.4cdef | 54.2c | 65.0de | 54.7f | 61.7e | 82.2de | 63.0 |
| EH01078-4-3 | 77.9a | 76.7b | 74.3b | 74.0ab | 83.3ab | 95.1c | 80.2 |
| EH01078-4-1 | 66.0bc | 88.5a | 75.4b | 73.0abc | 70.0d | 104.0b | 79.5 |
| EH01036-2-2 | 55.1defg | 72.6b | 46.7f | 66.0cde | 71.7d | 80.5de | 65.4 |
| EH01036-2-1 | 67.0bc | 86.7a | 70.0bcd | 71.2abcd | 80.6bc | 87.3d | 77.1 |
| EH00098-2-2 | 71.8ab | 72.2b | 66.0cde | 64.4de | 50.0f | 62.2f | 64.4 |
| KCSR0101 | 67.5bc | 76.3b | 72.3bc | 70.1bcd | 88.3a | 101.3bc | 79.3 |
| Hachalu | 62.2cd | 74.1b | 60.3e | 54.3f | 68.3d | 82.5de | 66.9 |
| Dide’a | 60.5cde | 70.6b | 62.9de | 36.2g | 68.9d | 76.5e | 62.6 |
| Local | 23.0h | 27.2d | 25.7g | 61.9e | 43.3g | 33.2g | 35.7 |
| Mean | 61.8 | 71.9 | 63.9 | 63.6 | 70.5 | 84.9 | 69.4 |
| CV | 6.6 | 6.8 | 6.3 | 6.3 | 5.2 | 4.8 | — |
- a–h: The superscripts indicate the level of significance in mean difference comparison according to Duncan’s multiple range test at the 5% level.
| Genotypes | PH (cm) | NPPP | NSPP | HSW (g) | SY (t/ha) |
|---|---|---|---|---|---|
| EH01036-2-4 | 86.7 | 15.0bc | 2.8abc | 79.3a | 4.1ab |
| EH01036-2-3 | 84.8 | 12.2c | 3.0a | 79.5a | 3.6def |
| EKLs/CSR02010-4-2 | 85.4 | 16.1bc | 2.5d | 63.0c | 3.8cde |
| EH01078-4-3 | 82.6 | 12.3c | 2.8abc | 80.2a | 3.9abcd |
| EH01078-4-1 | 85.4 | 14.6bc | 2.7cd | 79.5a | 3.2g |
| EH01036-2-2 | 83.0 | 17.1b | 3.0a | 65.4bc | 3.7cde |
| EH01036-2-1 | 85.6 | 13.6bc | 2.9ab | 77.1a | 3.8bcde |
| EH00098-2-2 | 86.7 | 16.2bc | 2.7bcd | 64.4bc | 3.4fg |
| KCSR0101 | 83.1 | 14.9bc | 2.7bcd | 79.3a | 3.6ef |
| Hachalu | 87.9 | 13.7bc | 2.9abc | 66.9b | 4.2a |
| Dide’a | 86.3 | 15.7bc | 2.9abc | 62.6c | 4.0abc |
| Mean | 85 | 15.5 | 2.8 | 69.4 | 3.8 |
| CV (%) | 6.5 | 33.2 | 12.2 | 6.0 | 11.3 |
- PH, plant height (cm); PPP, number of pod/plant; SPP, number of seed(s)/pod; HSW, 100 seed weights (g); and SY, seed yield (tons per hectare). a–g: The superscripts indicate the level of significance in mean difference comparison according to Duncan′s multiple range test at the 5% level.
The analysis of variance conducted using AMMI revealed that there were significant differences among the genotypes, environments, and genotype-by-environment interactions in terms of seed weight and seed yield for the 12 different varieties evaluated across the six environments. The results showed that out of the total variation observed in seed weight, 26.7% was attributed to genotypes, 37.0% to the environment, and 30.4% to the genotype by environment interaction (Table 6). The highest percentage of variation contributed by the environment indicated that the test environment exhibited considerable variability and had a substantial impact on the performance of the faba bean genotypes in terms of seed weight and yield. On the other hand, the contribution of GEI is relatively higher than that of genotypes, which indicates that a particular genotype may not exhibit the same phenotypic performance under different environmental conditions or that different genotypes may respond differently to a specific environment. Therefore, the identification of stable genotypes should be considered for the commercial production of faba beans across different faba bean growing areas in the Amhara region.
| Source | df | SS | MS | Explained (%) |
|---|---|---|---|---|
| Genotypes | 10 | 10,917 | 1,091.7 ∗∗ | 26.7 |
| Environments | 5 | 15,084 | 3,016.8 ∗∗ | 37.0 |
| Interactions | 50 | 12,418 | 248.4 ∗∗ | 30.4 |
| IPCA 1 | 14 | 6,763 | 483.1 ∗∗ | 54.5 |
| IPCA 2 | 12 | 2,547 | 212.2 ∗∗ | 20.5 |
| Residuals | 24 | 3,108 | 129.5 | — |
| Total | 197 | 40,822 | 207.2 | — |
- ∗∗Indicate significance at 0.01%; df, degree of freedom; SS, sum square; and MS, mean sum square
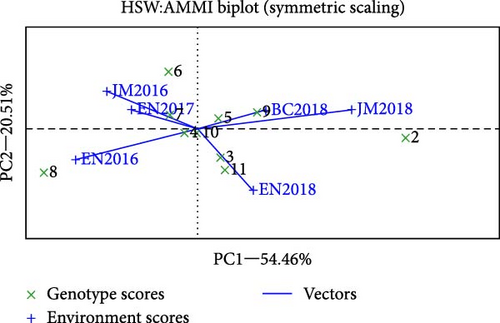
The AMMI analysis of seed weight revealed that the first two principal component axes (IPCA1 and IPCA2) were significant at p < 0.01, which attained 54.5% and 20.5% interaction sum square and 75% of total variation in seed weight (Table 6). According to Kempton [32], in the AMMI model, the first two interactions principal component axis were the best predictive model that explained the interaction sum of squares. The findings of the study supported [29, 33] who reported highly significant (p < 0.01) differences in genotype, environment, and their interaction for seed yield and seed weight in faba bean genotypes evaluated in multiple locations in Ethiopia. In the AMMI biplot, if the genotype had a zero or nearly zero IPCA 1 score, then they were stable across their testing sites. If the genotype is far from zero, it is highly responsive and does not perform consistently across the environment. G4 (EH01078-4-3) was the most stable and had the highest seed weight among the genotypes tested genotype (Figure 3). In contrast, G2, G8, and G6 were the most unstable genotypes in the environment.
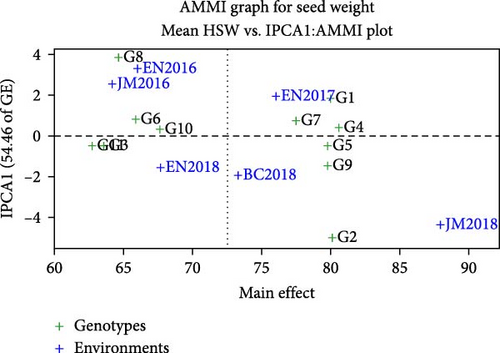
The AMMI analysis provided a biplot (Figure 2) of the main effect and the first principal component (IPCA1) of both genotype and environment. The differences among genotypes in terms of direction and magnitude along the x-axis (seed weight) and y-axis (IPCA1) are important, as in the biplot display, the genotype or environment that appears almost on the perpendicular line of the graph had similar mean seed weight, and those that fall on the horizontal line had similar interactions [34]. Thus, the relative variability due to the environment was greater than that due to the genotypic differences. Genotypes or environments on the right side of the midpoint of perpendicular line had a higher seed weight than the left side. G4, G1, G2, G5, G7, and G9 had high seed weights, whereas G8, G10, G11, and G6 had low seed weights. Environments including BC2018, EN2017, and to some extent JM2018 were on the right side, which seems favorable environments the result supported by Gonzalez and Martinez [17]. EN2018, JM2016, and EN2016 were generally less favorable environment.
Table 7 presents the AMMI stability value (ASV) and ranking with IPCA1 and IPCA1 scores for each faba bean variety. In ASV method, a variety with a large seed size (100 seed weights) and the lowest ASV score was the most stable. Accordingly, variety EH01078-4-3 had a higher mean seed weight (above the grand mean) with a lower ASV value and was considered the most stable across all environments, followed by EH 01078-4-1 also supported by [35]. In contrast, EHO1036-2-4, EH01036-2-3, KCSR 0101, and EH01036-2-1 were unstable varieties because they exhibited the largest ASV ranks. Although these genotypes have a higher mean seed weight than the grand mean, they are suited to specific environments. This result was similar to that of the AMMI biplot. However, the remaining varieties, regardless of ASV rank, were considered unsuitable for any environment because they had an underaverage seed weight.
| Variety | HSW (g) | Rank | IPCA1 | IPCA2 | ASV | Rank |
|---|---|---|---|---|---|---|
| EH01036-2-4 | 79.3 | 3 | 1.838 | 1.975 | 2.51 | 7 |
| EH01036-2-3 | 79.5 | 2 | −5.018 | −0.437 | 57.82 | 10 |
| EKLs/CSR02010-4-2 | 63.0 | 9 | −0.490 | −1.697 | 0.51 | 2 |
| EH01078-4-3 | 80.2 | 1 | 0.330 | −0.281 | 0.51 | 2 |
| EH01078-4-1 | 79.5 | 2 | −0.429 | 0.569 | 0.54 | 3 |
| EH01036-2-2 | 65.4 | 6 | 0.807 | 3.096 | 0.83 | 5 |
| EH01036-2-1 | 77.1 | 4 | 0.752 | 0.761 | 1.06 | 6 |
| EH00098-2-2 | 64.4 | 7 | 3.863 | −2.432 | 7.25 | 9 |
| KCSR0101 | 79.3 | 3 | −1.375 | 0.836 | 2.65 | 8 |
| Hachalu | 66.9 | 5 | 0.260 | −0.162 | 0.49 | 1 |
| Dide’a | 62.6 | 8 | −0.537 | −2.227 | 0.55 | 4 |
| Mean | 72.5 | — | — | — | — |
4.2. Genotype Ranking: Best and Ideal Genotype Assessment
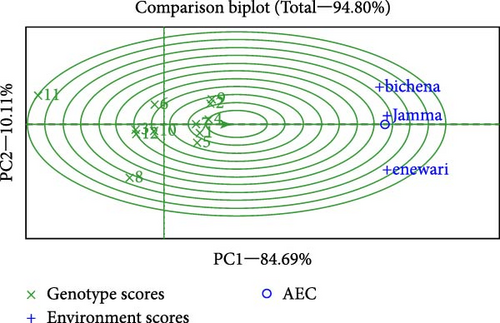
Through the genotype ranking biplot (Figure 4), we could detect an ideal genotype in contrast to the other genotypes evaluated. The genotypes G4 and G1 could be noted as the best-leading genotypes due to their proximity to the arrowhead in the circle for seed weight, which is regarded as the best genotype due to proximity to concentric circles [36]. Typically, an ideal genotype is always placed in the innermost circle and is relatively closer to the head of the arrow at the center of the circular ring. The genotype located in the inner circle is highly desirable compared with the genotypes of the outer circle [37]. For effective selection, an ideal genotype should have both high mean and stable properties. Figure 4 shows the mean vs. stability of the GGE biplot, and its function is exactly similar to that of the AMMI 1 biplot. The AEC ordinate approximates the contribution of varieties to GE interaction, which is a measure of their stability or instability. As previously mentioned, the AMM stability values showed similar results, indicating that both G4 and G1 were relatively stable compared to the other varieties.
4.3. Genotypic Classification Based on Agronomic Performance
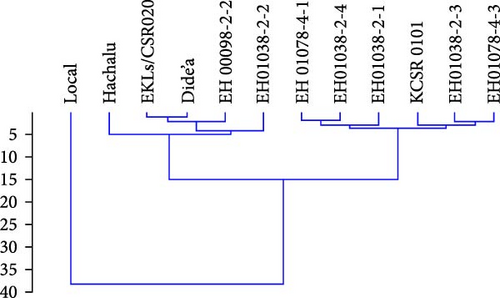
Cluster analysis can be used for identification of genotype with similar pattern of environmental interaction. Fox and Rosielle [38] suggested using reference cultivar to which the GXE pattern of new breed line are compared. It is the possible method of identifying new breeding line with stability pattern similar to cultivar well accepted by grower [39]. Yield traits, 100 seed weights, number of pods per plant and number of seeds per pods, and plant height were used to categorize the assessed genotypes into different groups based on their performance. The genotypes were clustered utilizing hierarchical clustering into three groups according to the agronomic performance (Figure 5). Group 1 consisted of two genotypes with the greatest 100 seed weights values and also seed yield. Group 2 comprised genotypes that recorded intermediate with low 100 seed weights and seed yield. Group 3 included one genotype with the lowest yield characters and 100 seed weights. Four groups were recognized by applying hierarchical clustering. G4 (EH01078-4-3), G5 (EH01078-4-1), G7 (EH01036-2-1), and G9 (KCSR0101) were grouped in one cluster and relatively stable genotype from cluster 2 and cluster 3.
PCA was used to separate the individual contribution of each trait to the total phenotypic variation noticed among faba bean genotypes. Figure 6 appears to be a principal component analysis (PCA) plot that visualizes the relationships between different agronomic performance traits and genotypes. The direction and length of these vectors indicate the relative contribution and correlation of each trait to the overall variation captured by the principal components. From the first and second dimensions, we could see that virtually all the traits appeared discriminating and contributed maximally toward the total variability present in the evaluated faba bean genotype. For example, the HSW vector points toward the right side of the plot, suggesting that this trait is positively correlated with Component 1. The clustering of certain genotypes near the HSW vector implies those genotypes have higher 100 seed weights. Similarly, the PH vector points toward the top, indicating plant height is more associated with Component 2. The positioning of genotypes relative to this vector suggests their plant height characteristics.
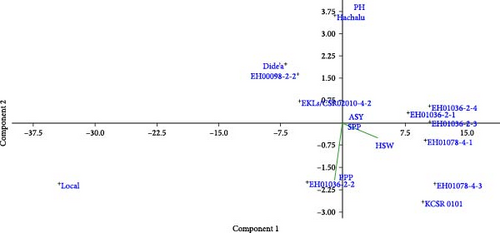
Overall, this PCA plot allows you to visually examine how the different genotypes perform across the key agronomic traits being measured. The clustering patterns and vector alignments provide insights into the underlying relationships between the genotypes and their phenotypic characteristics.
5. Conclusion
The combined analysis of variance reveals that the factors of genotype, environment, and genotype-by-environment interaction exhibit a remarkably high level of significance. This suggests the presence of extensive variation among the genotypes, environments, and their interactions. Seed yield has been the primary trait of interest and a prime objective in faba bean breeding programs for many decades. However, seed size has recently received considerable attention. This is also happening at the international and national levels in response to the current move to meet the export market demand for seed quality, particularly for the development of large seeds that fetch high prices in the world market. Based on AMMI and ASV stability parameters among the evaluated faba bean genotypes. In ASV variety EH01078-4-3 had a higher mean seed weight with a lower ASV value which is considered as the most stable across all environments, followed by EH 01078-4-1. In contrast, EHO1036-2-4, EH01036-2-3, KCSR 0101, and EH01036-2-1 were unstable varieties which have a largest ASV ranks. In addition, in the AMMI analysis G4 (EH01078-4-3) was the most stable followed by G10 and G5. So G4 was widely adapted over the studied environments in terms of seed weight and relatively stable and comparable seed yield. Therefore, it was selected as large-seeded genotype, which had 19.9% seed size advantage over the standard check Hachalu and 28.1% from Dide’a with comparable seed yield. As a result, it is released as a new variety of faba bean named Shewa for the study of vertisol (water logged) areas and similar agroecology in the country.
Conflicts of Interest
The authors declare that they have no conflicts of interest.
Authors’ Contributions
Emebet Takele conceived and designed the experiment, including the selection of experimental treatments, plot layout, and conducting the fieldwork, overseeing the implementation of the experiment, and monitoring the data collection process, analysis, and interpretation of the data and played a major role in writing the manuscript. Nigussie Kefelegn collaborated in the conception and design of the experiment, providing valuable insights and expertise in actively participated in the data collection process, including analyzing and interpreting the data. Daniel Admasu contributed to the experiment’s conceptualization and design, particularly in specific aspect. Simegnew Anley, Worku Zikarge, Jemal Esmaiel, and Awol Mohammed were involved in during plot layout and conducting the fieldwork, data collection phase, and writing up and reviewing the manuscript. All authors review and approved the final manuscript.
Acknowledgments
We would like to thank the Amhara Regional Agricultural Research Institute for granting financial support and the Holeta Agricultural Research Center for supplying seeds. We also extend our gratitude to the Pulse and Oil crop research team for their efforts. This work was supported by the Amhara Regional Agricultural Research Institute.
Open Research
Data Availability
Data will be made available upon reasonable request.


