On the Use of Taguchi Method in the Analysis of the Dynamic Response of Variable Bearing Design under Impact Load
Abstract
Optimizing the bearing design is an essential step to maintain safe operation and extend the bearing life. Taguchi method is one of the powerful methods in this direction, which can be used to assess the geometrical design parameters under shaft deviation. Shaft deviation is unavoidable in the industrial applications of journal bearing. It results from installation and manufacturing errors, bearing deformation, asymmetric loading, and many other sources. This work investigates the use of three bearing profiles with a wide range of geometrical characteristics to minimize the deviation negative effects. These designs modified the inner bearing surface in a linear, parabolic, or cubic shape. A general 3D deviation representation is considered in the analysis where the deviations in the horizontal and vertical directions are taken into consideration. The analysis is performed for a finite-length journal bearing using the Taguchi method to determine the optimal design characteristics. This analysis is achieved in terms of the rotor critical speed and the film thickness of the lubricant. Furthermore, the system response to an impact load is analyzed. The finite difference method is used in the analysis to solve the governing equations of the hydrodynamic problem, and the 4th-order Range Kutta solution is considered to solve the motion equations of the rotor under the impact load. Results show that using the suggested designs enhances the system’s critical speed, elevates the thickness of the lubricant layer, and extends the safe operation limits under impact load. The parabolic profile gives the most effective outcome where the shaft trajectory under impact excitation is very close to the ideal journal-bearing case. The suggested design reduces the maximum pressure by 17.07%, increases the minimum film thickness by 175.04%, and increases the critical speed by 23.42%.
1. Introduction
Journal bearing is the most common type of hydrodynamic bearing, which is commonly found in equipment and high-speed rotating machineries [1]. In this bearing type, the shaft rotates inside the bearing within a clearance in the order of tens of microns. The axis of the shaft should be paralleled to the bearing longitudinal axis. However, this ideal case is hardly to be achieved in the practical usages. This axis is often subjected to a deviation from a standard designed direction that should be parallel to the axis of the bearings, which is usually called misalignment. It has clear negative influences on the system performance as the deviation takes place within this relatively limited clearance range. Misalignment may result due to installation errors, asymmetric loading, deformation under high levels of load, and manufacturing errors [2, 3, 4]. The presence of misalignment causes uneven distribution of the film thickness along the bearing width, which also results in asymmetric pressure distribution. In such a case, the position of the resulting load point deviates from the bearing mid-plane, in addition to the significant reduction in the film thickness and the increase in the pressure levels [5, 6]. The importance of the misalignment consequences on the general rotor-bearing performance has drawn great attention from researchers for decades. Jang and Khonsari [7] studied the misalignment causes where they investigated their consequences on the bearing performance. Pigott [8] remarkably explained that a misalignment level of only 0.0002 rad decreased the bearing load carrying capacity by 40%. Sun and Changlin [9] and Sun et al. [10] also explained that the misalignment reduced the bearing capacity for load support and reduced the lubricant layer thickness at the bearing edges. The severe level of misalignment reduces significantly the gap between the shaft and the bearing, which may result in metal-to-metal contact that leads to a breakdown of the system [11, 12]. The shaft deviation has also been reported to be one of the most important issues influencing the performance of rotating machinery in terms of friction and wear levels [13, 14, 15].
The misalignment impacts on the shape and levels of pressure, and film thickness is not the same on the critical speed of the rotor bearing system. Misalignment increases the critical speed of the system, which represents a positive effect on the stability of the system [16]. This increase in the critical speed comes at the price of a severe reduction in the minimum film thickness and a significant rise in the pressure values [17, 18]. The reduction in the lubricant layer thickness means, a decrease in the bearing load capacity for the same designed minimum film thickness value. Therefore, a critical balance is required in designing journal bearings between the designed value of the load and the stability limits. One of the methods in this direction is to reduce the misalignment effects by changing the shape of the bearing to increase the clearance at certain locations between the surfaces. Nacy [19] presented an experimental investigation of a chamfered bearing to decrease the lubricant leakage. Bouyer and Fillon [20] used predesigned defects to decrease the misalignment effect in their numerical solution to this problem and reported a 60% increase in the minimum lubricant thickness. Strzelecki [21] changed the whole bearing profile to reduce the misalignment effect. It is also found by [22, 23] that the amplitude of vibration and the stability limit can be improved if a bearing with variable geometry is used. The effect of changing the bearing profiles was also investigated by [24, 25] to minimize the effects of misalignment on the performance of the journal bearing but without considering the system’s stability. On the other hand, the misalignment effect, without considering the change in the bearing profile, has been studied extensively over the last decades [26, 27, 28, 29, 30, 31]. The importance of the stability limits of the rotor-bearing systems comes from the modern applications that operate with high speed and certainly cause stability problems.
Changing the bearing profile is based on some parameters such as the shape of modification (order of the curve), modification height, and the location of the start of modification. The characteristics of the resulting bearing depend on the value of each parameter; therefore, using a traditional method in evaluating the effect of the parameter will not necessarily give the best combination of these parameters. Taguchi method represents one of the efficient statistical methods in this context [32]. Genichi Taguchi proposed this method with the main purpose of reducing the required number of tests in an optimization process. This method was used by Yücel and Saruhan [33] to determine the possible minimum amplitude of vibration of a rotor-bearing system, where it was found to be very efficient in reducing the possibility of operation at the critical speed of the system. Chien et al. [34] adopted the same analysis to optimize the parameters related to the grooving of the bearings. Sharma et al. [35] identified the optimal speed values of the journal in their experimental study based on this method. The performance of journal bearing with the use of asymmetrical herringbone grooves was also investigated using this method by Chen et al. [36]. It is also used as an optimization method by Bhasker et al. [37] to identify the optimal parameters of pressure distribution assessment.
Despite the extensive works presented in the field of enhancing the performance of journal bearing, the shaft deviation problem still causes severe negative effects on this performance. Therefore, the current study presents a novel method to optimize the design of the bearing using three forms of profile based on the Taguchi method. Each form has three levels that are considered to produce the orthogonal array that is used in the optimization procedure. The finite difference method is used in the numerical solution of this problem. The effectiveness of the optimized design is examined based on the combined effect of maximum pressure, minimum film thickness, and the critical speed of the rotor-bearing system. Furthermore, the dynamic response to an impact excitation is also investigated for the optimized design, where the solution of the motion equations is achieved by adopting the 4th-order Range–Kutta analysis.
2. Governing Equations
It is worth mentioning that, in the steady state case (the squeeze term vanishes).
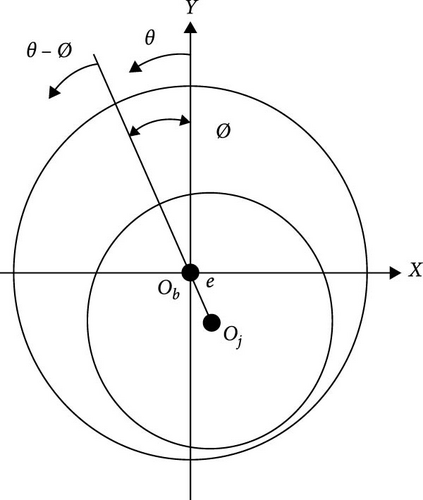
The Reynolds boundary conditions are used in solving this hydrodynamic problem, which are given by Hamrock [40], p = 0 at θ = 0, = 0 at θ = θcav, where θcav is the cavitation angle, and it can be determined in the current research by an iterative solution [40, 41]. Equations (1) and (2) can be given in a dimensionless form considering the following parameters,
where L is bearing length and R is radius.
3. Dynamic Solution
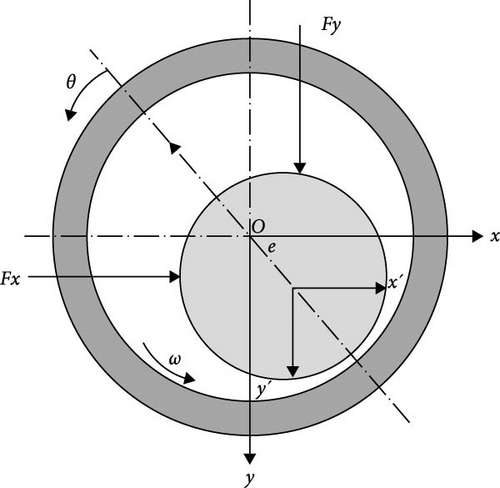
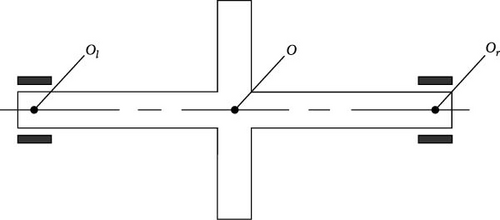
The linearized bearing forces will be written later in terms of the stiffness and damping coefficients in order to determine the critical speed of the rotor bearing system. This can be achieved by solving the equations of motion of the rotor-bearing system [29]. These equations of the rotor bearing system that are shown in Figure 2 are given by Shi et al. [45].
4. Deviation Representation
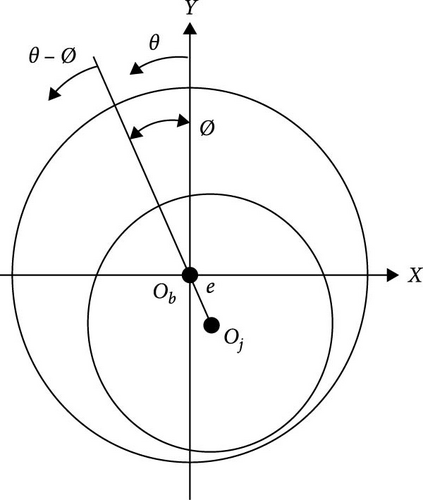
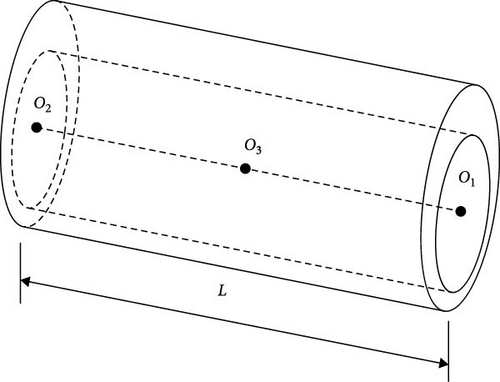
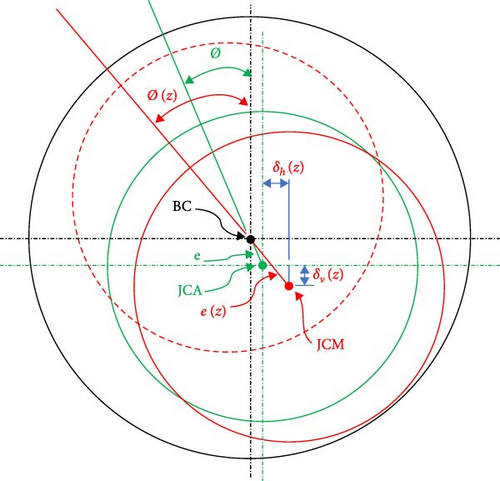
Equation (36) is used to incorporate the misalignment effect in the calculation of the gap at any given θ, Z position that is given by Equation (4). This process can be performed by calculating the eccentricity ratio (e(z)/c) and the attitude angle that is related to the misalignment parameters, as illustrated by Equation (36).
5. Baring Modification
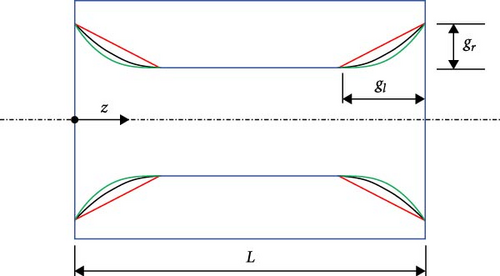
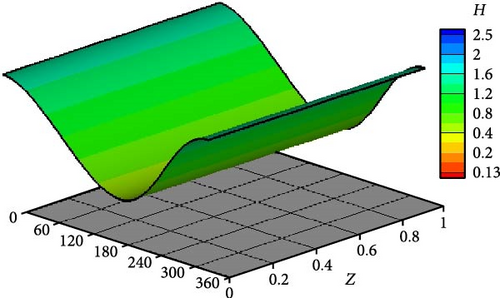
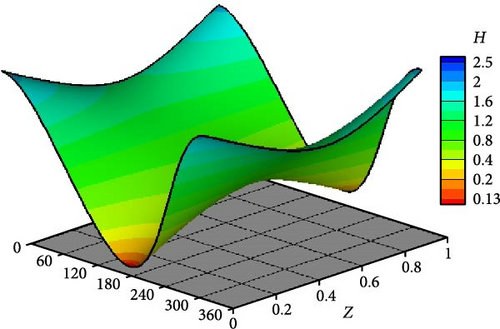
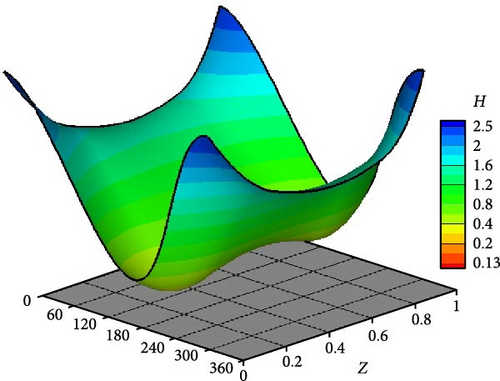
The decrease in the resulting gap due to misalignment can be overcome to an acceptable level by varying the shape of the bush. Figure 4 shows three different designs of the bearing. Figure 4(a) shows a modified bearing, and Figure 4(b) illustrates the three bearing profiles used in the current work, which are linear, parabolic, and cubic profiles. The effect of using these profiles will be investigated in detail in terms of reducing the misalignment negative effects on the maximum pressure, minimum film thickness, and the critical speed of the rotor bearing system.

Figure 5 shows a bearing section (exaggerated scale), which illustrates the modifications. The three designs are shown together for the purpose of illustration. The design parameters are gr and gl, representing the modification amount in the radial direction and the length of modification, respectively.
- (1)
Linear profile (n = 1).
- (2)
Parabolic profile (n = 2).
- (3)
Cubic profile (n = 3).
Scaling the design parameters to the clearance (T = gr/C) and to the length of the bearing (Γ = gl/L) provides a clear understanding of the required design changes in terms of the main system parameters. The resulting gap regarding the deviation effect, in addition to the bearing modification effect, is obtained through the coupling of Equations (4), (35), (36), (39), (40), and (41).
5.1. Numerical Solution
The load convergence criterion is based on the fact that the limit of the load resulting from the integration of a converged pressure solution is ±10−5 of the applied load. If the integrated load is out of these limits, the eccentricity ratio in the film thickness equation is changed and the whole solution is repeated in order to have a new pressure field.
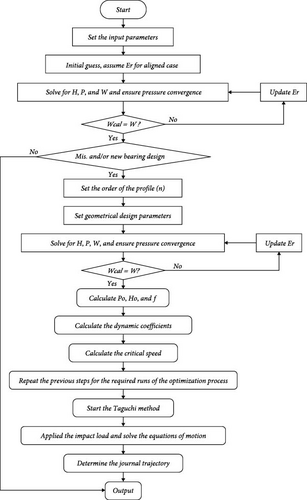
Based on the pressure and film thickness values available at this step, the dynamic coefficients of the journal bearing can now be calculated using a numerical integration method. After that, the critical speed of the rotor-bearing system is calculated. All the data required to perform the Taguchi analysis become available at this step. The Taguchi analysis is performed for three levels to each variable, as will be explained later in Section 5.2. The optimal outcome of the Taguchi method in terms of the bearing design variables will be examined under impact load. This examination is performed to find the journal’s trajectory under such type of excitation and identify the influence of the bearing shape form on the dynamic response of the rotor. Figure 6 illustrates the steps of the solution.
5.2. Results and Discussions
The analysis in the current work is performed for a journal bearing with L/D = 1.5. It is well known that a numerical solution is required in such cases where the pressure gradient in both directions is considered. The first step in this solution is to ensure the independence of the results on the number of nodes used in the discretization of the governing equations. Therefore, a series of tests is performed using different node numbers in the radial (N) and longitudinal (M) sides of the solution space. Using a total number (N × M) of 65,341 is found sufficient enough where any increase in the total number of nodes above 65,341 has a trivial effect on the critical speed, maximum pressure, and minimum film thickness.
All the results are presented in their dimensionless in order to have a general sight of the results in terms of the suggested bearing profile parameters. As the work’s purpose is to identify the effectiveness of the suggested design on the main bearing characteristics under 3D misalignment, it is important to have a clear picture of the misalignment effect at first on these characteristics. Table 1 shows this effect on the dimensionless maximum pressure (Pmax), dimensionless minimum film thickness (Hmin), and dimensionless critical speed (CS). This table compares these values for the ideal aligned case and the misalignment case. It is clear how the misalignment affects these values where Pmax increased by 57.6%, Hmin decreased by 78.3%, and the critical speed increased by 45.6%. It is important to notice that the enhancement of the critical speed value comes at the cost of the negative impact on the designed value of the minimum film thickness and the corresponding maximum pressure value. However, it will be shown in the next sections that optimizing the bearing shape design provides a significant compromise between the enhancement of the CS and minimizing the negative effects on Pmax and Hmin.
| Parameters | Aligned | 3D misalignment | % Change |
|---|---|---|---|
| Pmax | 0.486397 | 0.766778 | 57.64439 |
| Hmin | 0.5 | 0.108381 | −78.3238 |
| CS | 2.452341 | 3.570661 | 45.60214 |
The suggested bearing design is performed on the basis of changing the form of modification (n = 1, n = 2, and n = 3) and the position of the start of modification in the longitudinal direction (Γ) and the modification height (T) in the radial direction. Investigating the effect of each parameter from this wide range of variables on the bearing characteristics is not a practical solution way. Therefore, the Taguchi method is used to have the optimal combination of these parameters, which results in the best possible effect on the bearing performance under 3D misalignment. A nine orthogonal array is adopted in this work for the solution of the Taguchi method, as three levels for each parameter are considered. Using this type of orthogonal array requires results of nine runs. Table 2 shows these results where Pmax, Hmin, and CS are shown for each run. Each run corresponds to a given combination of n, T, and Γ, and all the considered combinations will be explained later.
| Run no. | Pmax | Hmin | CS |
|---|---|---|---|
| 1 | 0.69088 | 0.15826 | 3.29752 |
| 2 | 0.66579 | 0.29579 | 2.99805 |
| 3 | 1.17909 | 0.19953 | 4.19292 |
| 4 | 0.62048 | 0.28692 | 3.14793 |
| 5 | 0.64802 | 0.34191 | 3.00646 |
| 6 | 0.6839 | 0.15321 | 3.3018 |
| 7 | 0.61391 | 0.28599 | 3.1446 |
| 8 | 0.70415 | 0.15187 | 3.35332 |
| 9 | 0.66519 | 0.26614 | 3.03415 |
In order to perform the Taguchi analysis, it is required to normalize the results of the nine runs, as shown in Table 3. The normalization of the results ensures a maximum value of one for each parameter range. This is an essential analysis step to have the weighted sum model for each run, which is given by Fishburn [49].
| Run no. | Pmax (−) | Hmin (−) | CS (−) | WSM |
|---|---|---|---|---|
| 1 | 0.888591 | 0.46287 | 0.78645 | 0.650195 |
| 2 | 0.922078 | 0.865111 | 0.715027 | 0.841831 |
| 3 | 0.520664 | 0.583575 | 1 | 0.671953 |
| 4 | 0.989411 | 0.839168 | 0.750773 | 0.854630 |
| 5 | 0.947363 | 1 | 0.717033 | 0.916099 |
| 6 | 0.89766 | 0.4481 | 0.78747 | 0.645333 |
| 7 | 1 | 0.836448 | 0.749979 | 0.855719 |
| 8 | 0.871845 | 0.444181 | 0.799758 | 0.639991 |
| 9 | 0.922909 | 0.778392 | 0.723637 | 0.800832 |
The relative value of wj for each factor has an effect on the overall bearing performance, which has to be chosen in accordance with its importance. The value of minimum film thickness under any circumstances is the most important issue in the safe operation of the rotor-bearing system, giving a 50% relative weight. Each of the other two characteristics (Pmax and CS) is given a relative weight of 25%. The choice of these relative weight values is performed based on a long experience (more than 15 years) in the field of roto-bearing performance enhancement.
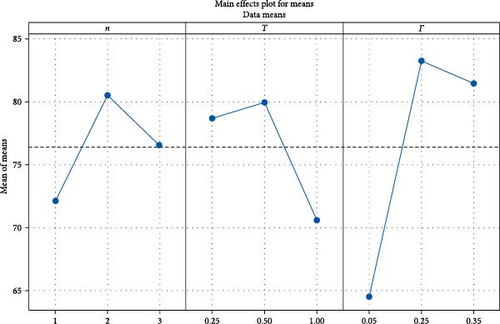
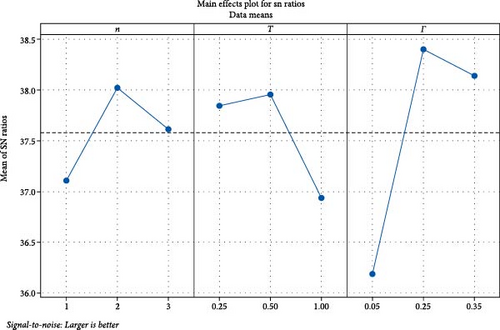
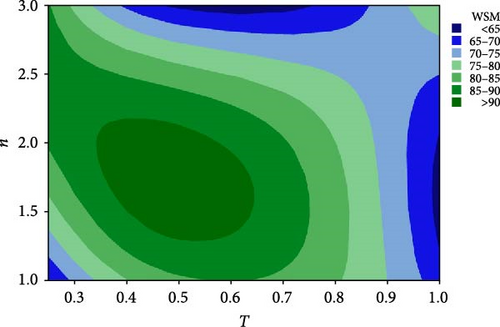
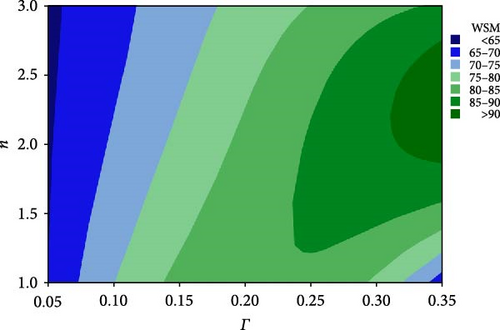
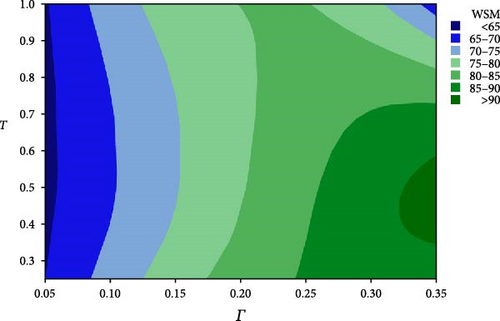
Table 4 shows the values of the designed parameters for the Taguchi orthogonal array and the WSM values for the whole nine runes. The values shown in this table illustrate that the maximum WSM is 91.6099%, which corresponds to run number 5. The bearing design parameters for this run are n = 2 (parabolic profile), T = 0.5, and Γ = 0.35. On the other hand, the worst value of WSM is 63.9991, which corresponds to run number 8. The design parameters of this run are n = 3, T = 0.5, and Γ = 0.05. However, optimizing this whole orthogonal array using the Taguchi method results in the mean effect plots for means and signal-to-noise ratio that are shown in Figures 7 and 8, respectively. The results in these two figures illustrate that the optimal design combination is within the selected ranges of the variables but is out of the selected runs. The optimal values are n = 2, T = 0.5, and Γ = 0.25, where the only difference takes place in φ value. More details about the optimal combination of the design parameters are shown in Figures 9, 10, and 11. These figures show the contour plots of WSM versus (n, T), WSM versus (n, Γ), and WSM versus (T, Γ). It can be seen in these figures that different design combinations affect the WSM values.
| No. of run | Data of the Taguchi analysis (L/D = 1.5) | |||
|---|---|---|---|---|
| Parameters | WSM (%) | |||
| n | T | Γ | ||
| 1 | 1 (1) | 1 (0.25) | 1 (0.05) | 65.0195 |
| 2 | 1 (1) | 2 (0.5) | 2 (0.25) | 84.1831 |
| 3 | 1 (1) | 3 (1.0) | 3 (0.35) | 67.1953 |
| 4 | 2 (2) | 1 (0.25) | 2 (0.25) | 85.4630 |
| 5 | 2 (2) | 2 (0.5) | 3 (0.35) | 91.6099 |
| 6 | 2 (2) | 3 (1.0) | 1 (0.05) | 64.5333 |
| 7 | 3 (3) | 1 (0.25) | 3 (0.35) | 85.5719 |
| 8 | 3 (3) | 2 (0.5) | 1 (0.05) | 63.9991 |
| 9 | 3 (3) | 3 (1.0) | 2 (0.25) | 80.0832 |
The optimal combination of the design parameters (n = 2, T = 0.5, and Γ = 0.25) is used to investigate its effect on the considered bearing characteristics in the current work. Table 5 shows the results of the optimized design of the bearing profile. It can be seen that adopting such a profile results in a significant enhancement in the bearing performance in terms of Pmax, Hmin, and CS. The maximum pressure was reduced by 17.1%, and Hmin was increased by 175.0% in comparison with the corresponding values under the 3D misalignment operating conditions. The critical speed is reduced in comparison with the misalignment case, but it is still above the designed value of the ideal case by 23.4%, which represents an improvement in the dynamic characteristic as well. It can be concluded that using the optimal design parameters enhances the general bearing performance under severe levels of 3D misalignment that causes a sharp drop in the levels of the film thickness.
| Parameters | Aligned | Misaligned | Modified | % Change |
|---|---|---|---|---|
| Pmax | 0.486397 | 0.766778 | 0.635914 | −17.07 |
| Hmin | 0.5 | 0.108381 | 0.298093 | +175.04 |
| CS | 2.452341 | 3.570661 | 3.026695 | +23.42 |
- Note. The change in the critical speed is calculated compared to the aligned case.
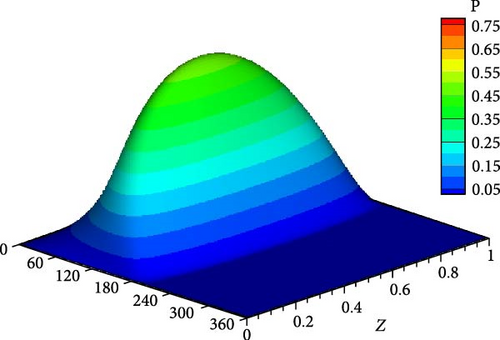
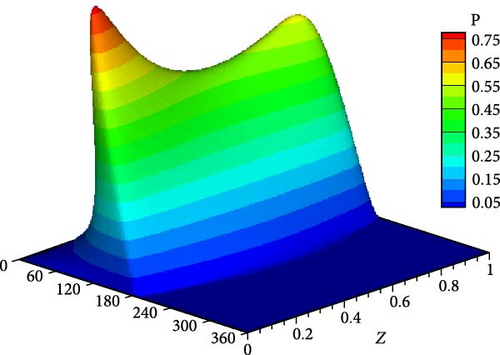
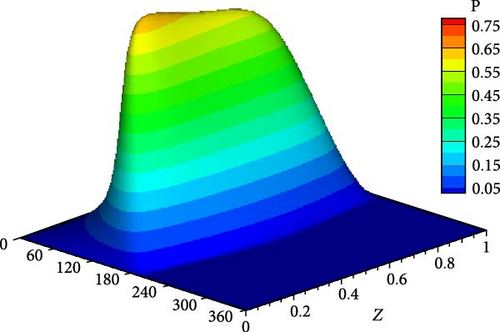
Figures 12 and 13 show the impact of the suggested design on Pmax and Hmin, respectively, compared with the aligned and misaligned results. It is clear that the 3D deviation results in pressure spikes associated with the reduction of the lubricant thickness at the bush edges in comparison with the uniform distribution (for pressure and film thickness) in the ideal aligned situation. Using the optimized bearing geometry reduces the pressure spike values, elevates the lubricant thickness at the most negative effect area of the misalignment, and reduces the distribution asymmetricity.
The optimal design is further investigated under the effect of impact load to examine its consequences on the journal trajectory. Figure 14 shows the trajectories at a speed about half the ideal case critical speed when n = 1, 2, and 3. It can be seen that all the trajectories operate in stable conditions without growing up amplitudes. However, when n = 1 (linear profile), the trajectory is relatively far from the corresponding ideal case trajectory. Figure 15 shows the trajectory of the journal center for the ideal case at a speed equal to the critical speed. The journal continues to run over a constant path and never returns to the equilibrium location. Figure 16 compares the trajectories for three profiles with the ideal case shown in Figure 15, i.e., at the aligned case’s critical speed. All shaft trajectories of the variable shape bearings return to equilibrium positions after periods of time. However, the trajectories are not very clear in this figure as the lines are very close to each other; therefore, the results are presented in terms of the variation of eccentricity ratio with time, as shown in Figure 16. The eccentricity ratio curve of the classical design (shown in black) continues to oscillate with time. On the other hand, the eccentricity ratio for all modified cases returns to the steady state positions. The case of n = 1 gives the highest eccentricity ratio, meaning the lowest value of the minimum film thickness. The cases of n = 2 and 3 give very close behaviors to each other. Figure 17 shows the variation of eccentricity ratio with time under impact load at a rotational speed equal to CS of classical design. The result presented in the previous figures emphasizes the effectiveness of the modification even under dynamic load in addition to the previously mentioned advantages in terms of Pmax, Hmin, and CS.
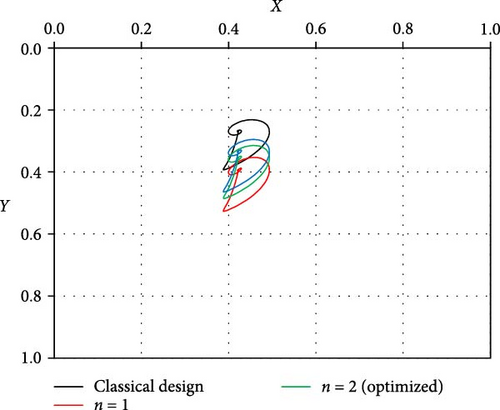
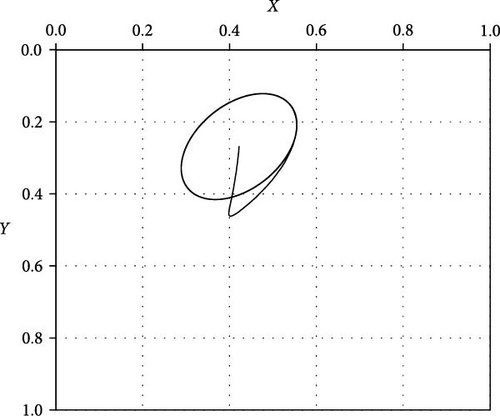
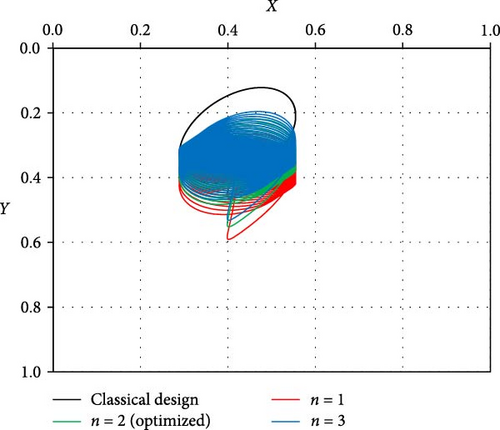
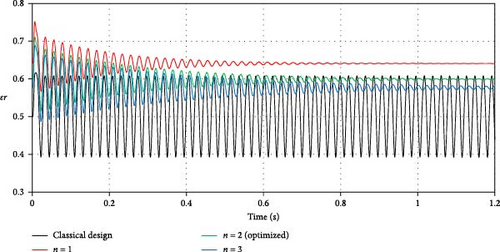
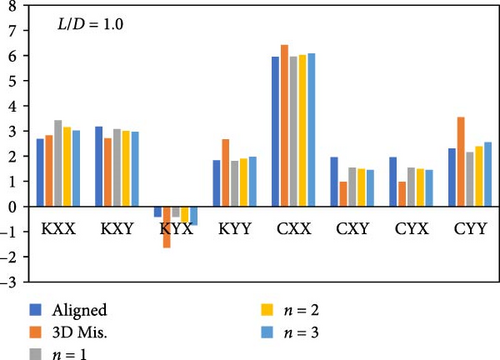
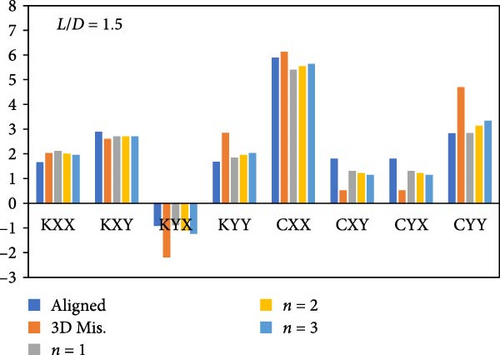
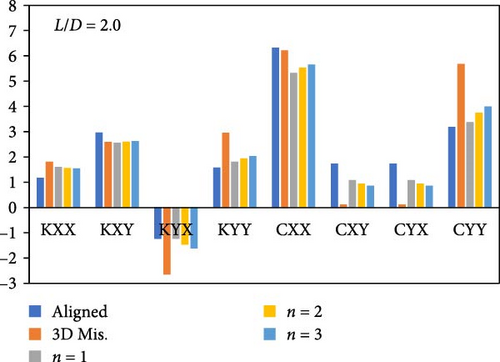
Figure 18 illustrates the effect of the form of modification on the stiffness and damping coefficients. Figure 18(a) shows the results when L/D = 1.0, while Figures 18(b) and 18(c) illustrate the corresponding results when L/D = 1.5 and 2.0, respectively. These figures compare the eight dynamic coefficients for the modified bearing profile (n = 1, 2, and 3) with the corresponding ideal (aligned) and misaligned cases. The misalignment level, as well as the load, are the same in the three cases to study the modification effect precisely. It can be seen that the bearing modifications in the three cases change the coefficient values to become closer to the corresponding values of the aligned case.
The originality of the results presented in this work is mainly related to the study of the effect of bearing geometry modification using three different profiles and its consequences on the dynamic response of the rotor-bearing system of the modified bearing under impact load.
6. Conclusions
The current study presents a novel optimization solution for bearing design using the Taguchi method under 3D deviation effects. The solution is performed using the finite difference method for a finite-length journal bearing. Three forms of the bearing profile are used, with three levels for each form. The outcomes of the Taguchi solution show that an optimal combination of using a second-order profile with Γ = 0.25 and T = 0.5 results in the best results in terms of the critical speed of the rotor bearing system, minimum film thickness, and maximum pressure values. This design combination is examined under the effect of an impact excitation where the motion equations are solved based on the method of Range-Kutta. The dynamic response shows that the optimized design is stable over a wider range of speeds, which means a further important advantage of the optimized design is obtained in addition to the reduction in Hmin and Pmax. It can be concluded that using the Taguchi method in optimizing the bearing profile represents a powerful tool in order to identify the optimal profile parameters. These obtained parameters improve the bearing performance in terms of the film thickness, pressure distribution, and critical speed of the system. The solution method presented in this study can be extended in a future work to examine the effect of using different forms of surface texture of the bearing on the system performance under impact as well as unbalanced loads.
Conflicts of Interest
The authors declare no conflicts of interest.
Authors’ Contributions
Hazim U. Jamali and M. N. Mohammed are the co-authors.
Open Research
Data Availability
The data used to support the findings of this study are available from the corresponding author upon request.


