Process Integration of Hydrogen Production Using Steam Gasification and Water-Gas Shift Reactions: A Case of Response Surface Method and Machine Learning Techniques
Abstract
An equilibrium-based steady-state simulator model that predicts and optimizes hydrogen production from steam gasification of biomass is developed using ASPEN Plus software and artificial intelligence techniques. Corn cob’s chemical composition was characterized to ensure the biomass used as a gasifier and with potential for production of hydrogen. Artificial intelligence is used to examine the effects of the significant input variables on response variables, such as hydrogen mole fraction and hydrogen energy content. Optimizing the steam-gasification process using response surface methodology (RSM) considering a variety of biomass-steam ratios was carried out to achieve the best results. Hydrogen yield and the impact of main operating parameters were considered. A maximum hydrogen concentration is found in the gasifier and water-gas shift (WGS) reactor at the highest steam-to-biomass (S/B) ratio and the lowest WGS reaction temperature, while the gasification temperature has an optimum value. ANFIS was used to predict hydrogen of mole fraction, 0.5045 with the input parameters of S/B ratio of 2.449 and reactor pressure and temperature of 1 bar and 848°C, respectively. With the steam-gasification model operating at temperature (850°C), pressure (1 bar), and S/B ratio of 2.0, an ASPEN simulator achieved a maximum of 0.5862 mole fraction of hydrogen, while RSM gave an increase of 19.0% optimum hydrogen produced over the ANFIS prediction with the input parameters of S/B ratio of 1.053 and reactor pressure and temperature of 1 bar and 850°C, respectively. Varying the gasifier temperature and S/B ratio have, on the other hand, a crucial effect on the gasification process with artificial intelligence as a unique tool for process evaluation, prediction, and optimization to increase a significant impact on the products especially hydrogen.
1. Introduction
Human development has been challenged by the depletion of energy resources, impacts on the environment, and insecurities around national energy security due to increased energy demand and consumption [1]. Biomass is one of the renewable energy sources that does not involve the emission of greenhouse gases, unlike fossil fuels with many pollutants [2, 3]. Renewable energy is an alternative energy generation that has gained traction for some time, as its sources have a greater presence in the modern world energy market. Human civilization and technological advancement are leading to an increase in global energy demand. The world’s energy security has been threatened by rapidly diminishing fossil fuel reserves [4]. Thus, in response to these problems, continuous efforts have been made to explore clean, renewable alternatives for sustainable development to transition the world from overdependence on fossil fuels gradually [5]. However, alternative energy sources such as hydrogen production, bioethanol, and biogas [6] are proving to be safe and effective means to an extent, addressing the issues mentioned earlier. Global energy consumption was 18.1% fueled by renewable energy sources in 2017, with biomass contributing 12.1% [7], which establishes it as a potentially viable and more advantageous energy source when compared to fossil fuels. It is widely acknowledged that hydrogen serves as an attractive energy source to replace conventional fossil fuels from an economic standpoint as well as from an environmental perspective. Biomass is among the most readily available and abundant renewable energy resources because of its carbon neutrality [8]. In a recent study by Park et al. [9], the authors propose a corn biomass to syngas chemical looping system for a range of downstream applications, with focus on liquid fuel production. The study reported a variable syngas quality with an H2/CO ratio of approximately 2, and a syngas purity greater than 70% was achieved. A comprehensive comparative study using multicriteria decision analysis was conducted on the gasification of waste polymetric foam at multiobjective optimum conditions using response surface methodology [10]. Another study by Hasanzadeh et al. [11]models and optimizes the performance of the gasification of a rice husk and low-density polyethylene waste composite, and the authors reported an energy efficiency of 77.6%. A high degree of accuracy can be achieved using the ASPEN Plus software model for different gasifiers (air gasification or steam gasification) this simulator could predict high syngas compositions from different biomasses. In a study that assessed the potential for lignocellulosic biomass to be converted to butanol using chemical looping gasification, Li et al. [12] established an ASPEN Plus model, which shows an efficiency of 45.33%. A partial gasification model using ASPEN Plus was developed by Zhang et al. [13]. At the same time, different thermodynamic analyses were performed, such as exergy, energy, and economic analyses. The gasification process that was reported with key input parameters yielded cold gas and energy efficiency of 46.08 and 67.08%, respectively, and a net heat efficiency of 44.25% at a carbon conversion ratio of 0.7. In another study that used the ASPEN Plus model for biomass gasifier, Pala et al. [14] demonstrated that a shift reaction could be used to tune the syngas composition successively and achieved a molar ratio of about 2.15 for H2 and CO. A 35 kVA downdraft biomass gasifier was modeled using ASPEN Plus simulated by Keche et al. [15], and babul wood was found to produce more H2 in the syngas than other biomass used as feedstocks. In a model that predicts the result with less error than experimental results in temperatures between 700 and 900°C, Pauls et al. [16] used air and steam as gasifying agents.
The response surface methodology (RSM) is widely used for optimizing new and existing systems [17]. The one factor at a design approach is not cost and time effective. Response surface methodology (RSM) is one of the most applicable designs of experimental methods [18]. RSM helps to present a regression model to predict the response variable based on the considered input parameters [19, 20]. In addition to RSM, genetic algorithms (GA) can be used to optimize any process or system. Nevertheless, RSM offers adequate accuracy for optimizing processes or systems (almost identical to GA). According to a previous study [21], RSM provides better optimization accuracy than GA. Furthermore, GA relies on a heuristic optimization strategy, which does not guarantee optimal solutions.
The optimization of biomass, coal, and waste torrefaction process variables made use of artificial neural networks and RSM by Ozonoh et al. [22]. In comparison with raw fuel, the torrefied product showed 10% higher heating values. Based on RSM, Inayat et al. [23] optimized the catalytic cogasification of palm waste and found that the gasification temperature and the catalytic loading and blending ratio are the most influential. Optimal conditions resulted in 19.96% CH4 and 38.81% syngas. In a study of hydrothermal gasification (HTG), Fozer et al. [24] used RSM for optimizing microalgae biomass production and sequential biogas generation. In optimum light levels, fermentation of microalgae biomass produces H2-rich gas without requiring any catalyst, suggesting improvement at the farm stage in downstream processing. As part of the optimization of a design mix of palm oil and diesel fuel introduced into diesel engines, Uslu [25] utilized RSMs and artificial neural networks (ANNs).
Fuzzy inference systems are generated using ANFIS-based methods, such as grid partition, subclustering, and fuzzy c-means. Multiple and individual response variables have been used in this study to optimize the equilibrium gasifier model. To compare BP-ANN and ANFIS models with the ASPEN Plus process model, extensive simulation studies are conducted to determine the best predictive model. Furthermore, synchronized effects among input and response variables determined optimal operating conditions for steam gasification.
Any gasification process requires optimization to achieve high-quality syngas. Thus, no detailed predictive models have been developed using back propagation neural networks (BP-ANN) and ANFIS, statistical analysis, and syngas production optimization for a developed steam-gasification process. This present study combines back propagation artificial neural network BP-ANN and adaptive neuro fuzzy inference system (ANFIS) to develop a prediction model for biomass gasification based on ASPEN Plus simulation. The use of artificial intelligence integrated with process simulations will help provide relevant industrial conditions as a result of energy concerns. The process will provide the opportunity to understand and design an optimal hydrogen production scale-up.
2. Materials and Methods
This study used plant raw materials that are annually renewable in Nigeria and concentrated in growing or processing sites. Corn cob, rice husk, and coconut shell were collected during grain crop harvesting. Plant material was air-dried and crushed to particle sizes (<1 mm) on a disintegrator. Furthermore, some parameters, including the identified biomass’s fixed carbon and volatile matter, were determined using the ASTM standard. Using standard methods established in the literature, the samples’ percentages of moisture and ash were determined [26].
An elemental analysis (proximate and ultimate analysis) was performed on biomass materials such as corn cob and was found to have a moderately higher calorific value, as shown in Table 1. This represents the input parameters in ASPEN Plus for the gasification reaction process for syngas, especially hydrogen. Detailed and comprehensive studies on characterization of corn cob for application in a gasification process for energy production have been reported in literature [27]. The results of the authors are comparable to the current study corn cob analysis.
| Proximate analysis, dry basis (%) | Ultimate analysis, dry basis (%) | ||||||||
|---|---|---|---|---|---|---|---|---|---|
| M | A | VM | FC | HHV | C | H | N | O | S |
| 9.8 | 8.5 | 69.2 | 12.5 | 17.04 | 47.2 | 6.4 | 0.4 | 46.0 | 0 |
- M: moisture; A: ash; VM: volatile matter; FC: fixed carbon; HHV: high heating value (MJ/kg).
3. Model Description
3.1. ASPEN Plus Model, Equation, and Assumptions
Thus, L is the Lagrange function, while the Lagrange multiplier is λj.
Gibbs free energy and Lagrange multipliers presented in Equations (1) and (2) have been applied in previous studies [30]. The biomass gasification process model flowsheet diagram for the corn cob is displayed in Figure 1. As a result of adopting the Peng-Robinson equation of state [31, 32] in the property method section, excellent precision could be obtained when simulating biomass steam gasification processes. Biomass was classified as a nonconventional input, and its proximate and ultimate analyses were entered in the stream named “Biomass” under “component attributes.” Moreover, steam is supplied at 150°C and 1 bar as a gasifying agent. A Gibbs reactor (RGIBBS) was operated with varying steam mass flow rates and variable biomass inputs to alter the steam-to-biomass ratio (S/B) and temperature in the gasification process (T). The blocks (reactors) used for the ASPEN Plus gasification’s simulations for the corn cob are shown in Table 2.
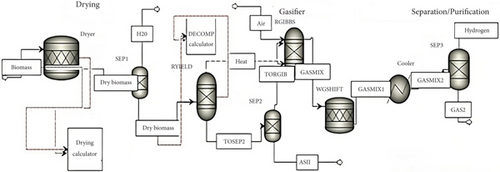
| Block | Model | Function |
|---|---|---|
| DRYING | RYIELD | Biomass is either dried based on proximate analysis of water content or divided into conventional components and ash |
| BIOMASS-DECOMPOSE | RSTOIC | For simulation of biomass gasification and combustion, decompose biomass into CO, CO2, H2, CH4, N2, and ash to easily handle solid reactions |
| SEP | SEP | Rotation and gravitational forces are used to separate gas and solid impurities |
| RGIBBS | Gasification reactions occur when the Gibbs free energy minimization is applied to all possible reactions | |
| SSPLIT | A yield reactor creates char, RSTOIC produces H2S after formation, and dry syngas is obtained by separating H2O from syngas |
This model is simplified by making the following assumptions: (i) Simulating atmospheric conditions and steady-state conditions is carried out; (ii) initially, devolatilization occurs instantaneously; (iii) a negligible amount of heat is lost; (iv) ash is considered an inert substance. In addition, the experimental statistical data range from the ASPEN Plus process model is shown in Table 3.
| Parameters | Unit | Minimum | Mean | Maximum |
|---|---|---|---|---|
| Input | ||||
| Steam | kg/h | 5500 | 34952.88 | 60000 |
| Reactor pressure | Bar | 0.1 | 0.15 | 1.0 |
| Reactor temperature | °C | 360 | 627.6 | 850 |
| Biomass | kg/h | 10000 | 20000 | 30000 |
| Output | ||||
| Mole fraction | ||||
| H2 | 0.17 | 0.387 | 0.5862 | |
| CO2 | 0.072 | 0.123 | 0.145 | |
| CO | 0.01 | 0.099 | 0.332 | |
| CH4 | 0.00 | 0.00 | 0.022 | |
3.2. Models Based on BP and ANN
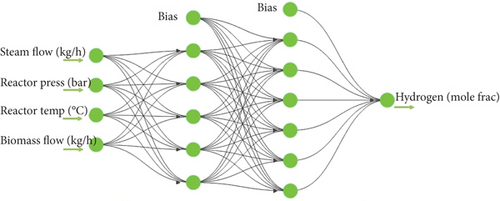
Net = newff (X, Y, ‘trainfun, ’‘trainlm) in MATLAB creates the BP model: X is the maximum and minimum value of the input quantity, Y is the number of hidden layer nodes, ‘trainfun’ is the transfer function (tansig function was used in this case), and ‘trainlm’ is the training function.
In this study, the steam flow (kg/h), reactor pressure (bar), reactor temperature (°C), and biomass flow (kg/h) are considered input data, and the amount of H2 (mole fraction) and, in the network training, hydrogen energy content (MJ/kg) was considered an output of the process. Training, validation, and test sets of data points for the ANN are divided into three categories, whose percentages are adjustable [36].
3.3. ANFIS Model Building
A model was developed using four (4) parameters which are independent variables, the steam flow (kg/h), reactor pressure (bar), reactor temperature (°C), and biomass flow (kg/h) as input while the output set contains data of the amounts of H2 (mole fraction) and energy content of the hydrogen produced (MJ/kg). These variables are listed in Table 3 along with their statistical characteristics. All subgroups have quite large ranges of data for each variable.
MATLAB functions linked to ANFIS are used to build model programs; the ANFIS model structure is shown in Figure 3. In general, a subject expert describes the fuzzy rules. The algorithm rather than an expert creates the rules when ANFIS is used. Two strategies were investigated in this study for generating a fuzzy inference system (FIS) structure from ANFIS data [38].
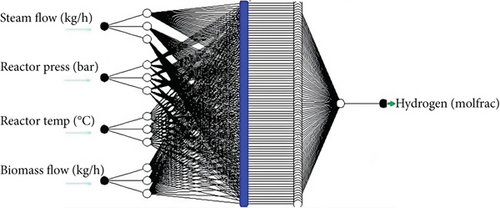
Gradient descent and least squares are used to determine contexts and parameters in hybrid learning. For its predictive purposes, ANFIS currently uses an advanced rapid-learning technique called hybrid learning. It has been established by many scientists that hybrid algorithms are effective [39, 40].
3.4. Response Surface Methodology (RSM)
Here, “p” represents the response variable; “u” represents input variables; “n” denotes the number of variables; ∂0, ∂i, ∂ii, and ∂ij indicate constant, linear, square, and interaction terms, respectively.
The following equations define each of the statistical parameters used for model evaluation as mentioned in Table 4 [40, 43].
| Equations |
|---|
|
|
|
|
|
|
|
|
|
|
In this case, R2, MAE, MSE, RMSE, and AAE are, respectively, the coefficient of determination, the mean absolute error, the mean square error, the root mean square error, and the average absolute error. Optimal matching of data points occurs when the prediction error approaches zero [1].
4. Results and Discussion
4.1. Model Evaluation for ASPEN plus
Table 5 shows the output and input of the process simulation model used to simulate the gasification of corn cobs. Syngas compositions were predicted using ASPEN Plus software, but certain assumptions were considered, leading to some uncertainty, for instance, an underestimation of CH4 content. A reliability inspection is therefore required before any further investigations can be conducted. Gasifier models must be validated with different experimental studies to ensure their authenticity and accuracy [44, 45]. As reported in published experimental studies, biomass feeds are validated using the same thermodynamic properties [14].
4.2. Model Evaluation for Predictive Potential
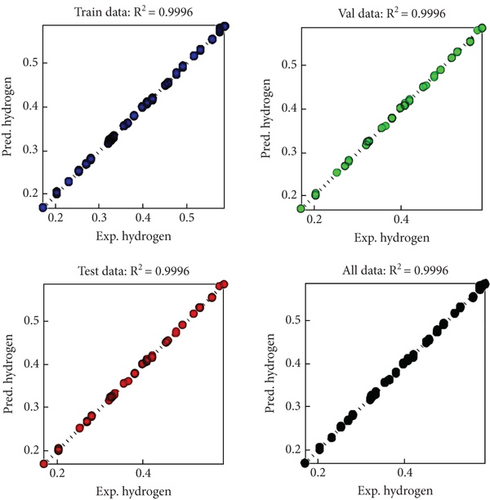
The model capability was evaluated using the following statistical parameters: R2, MAE, MSE, RMSE, and AAE which are the coefficient of determination, the mean absolute error, the mean square error, the root mean square error, and the average absolute error, respectively. ASPEN Plus, backpropagation neural networks, and ANFIS models were evaluated to predict hydrogen production. For various models, results are shown in Tables 6, 7, and 8. Figures 4 and 5 represent parity plots between experimental data and predicted values; in addition, Tables 6 and 7 show different trial results of the three models involved in this study. However, R2 should be close to unity (1) to achieve a strong correlation between experimental and expected values. In all three models, R2 was close to one, indicating strong compatibility [37]. Furthermore, for each model, the RMSE and MSE square root were calculated. All of the values obtained for MSE and RMSE were low, confirming that all of the models used are within range. AAE and MAE calculate a model’s precision and accuracy as displayed in Tables 6 and 7; however, Table 8 expresses the summary of the best results of the two predictive models for comparison. The model of ANFIS-grid partitioning (GP) was able to predict hydrogen production more closely than the best of BP-ANN with two hidden layers (4-4-5-2), based on statistical index results.
| Error analysis indicators | 3 | 4 | 5 |
|---|---|---|---|
| R2 | 0.9355 | 0.9397 | 0.935 |
| MAE | 0.0153 | 0.0147 | 0.0151 |
| MSE | 0.0006 | 0.0005 | 0.0006 |
| RMSE | 0.0236 | 0.0232 | 0.0237 |
| AAE | 0.0475 | 0.0428 | 0.0422 |
| Error analysis indicators | ANFIS-grid partitioning (ANFIS-GP) | ANFIS-subtractive clustering (ANFIS-SC) | ANFIS-fuzzy c-means (ANFIS-FCM) |
|---|---|---|---|
| R2 | 0.9993 | 0.9993 | 0.9977 |
| MAE | 0.0013 | 0.0014 | 0.0023 |
| MSE | 0.0000 | 0.0000 | 0.0000 |
| RMSE | 0.0023 | 0.0025 | 0.0044 |
| AAE | 0.0040 | 0.0041 | 0.0063 |
| Error analysis indicators | ANN | ANFIS-grid partitioning (GP) |
|---|---|---|
| R2 | 0.9397 | 0.9993 |
| MAE | 0.0147 | 0.0013 |
| MSE | 0.0005 | 0.0000 |
| RMSE | 0.0232 | 0.0023 |
| AAE | 0.0428 | 0.0040 |

4.3. Relationship of Gasification with Steam-to-Biomass Ratio (S/B)
The gasification of biomass is characterized by the following main reactions. The results of steam gasification of corn cob feedstock at 850°C with different steam-to-biomass (S/B) ratios are shown in Figure 6(a). H2 increased with an increase in S/B from 0.8 to 2.0, while CO and CH4 content decreased. Gas composition could change with a change in S/B for two reasons. Exothermic water-gas shift reactions occur when steam is added to the gasification system (Eq. (10)), and steam reforming of methane being endothermic methods (Eqs. (6)–(9)) consumed CO and CH4, increasing [44] H2 and CO2 content while decreasing CO and CH4. Le Chatelier’s principle could explain the second reason. By adding steam (reactant) to the gasification system, reactions shift toward products, increasing H2 production. According to Hu et al. [44], the same trend could be explained by an increase in steam reforming and shifting reactions because of the increased S/B. With an increase in S/B from 0.8 to 2.0, Figure 6(a) shows a slight increase in H2 content. Steam can limit cracking and endothermic reactions like water-gas (equations (6)–(8)) and Boudouard reactions (equation (9)) caused by the addition of a significant increase in steam quantity. Low S/Bs, however, had less effect since the composition of the gas remained the same. For the production of syngas, it seems reasonable to use higher S/B values (>1.4). While keeping the gasification temperature constant at 850°C, S/B varied from 0.8 to 1.2. It defines the further use of the syngas produced by biomass gasification by measuring H2/CO. As S/B increased, H2/CO trended upwards. Gas quality was shown to be affected in two opposite ways by steam addition. A higher S/B results in a higher dry gas yield and char yield [46].
4.4. Gasification Temperature and Gasification Control Variables
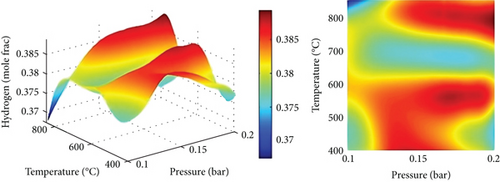
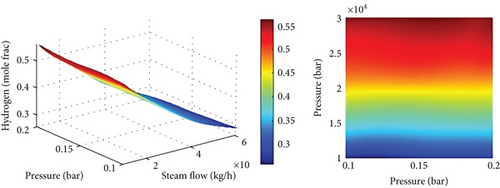
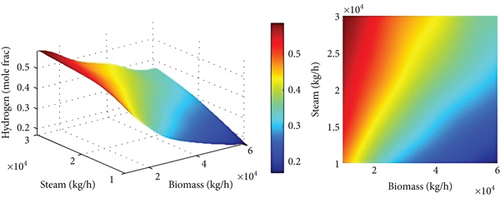
Figures 6(b) and 6(c) show the composition of gas at various temperatures with S/B at a constant value. By steam-gasifying biomass at 650 to 850°C, 22% of CO was produced, while CH4 and CO2 contents were decreased. The CO2 generated by shifting, cracking, and reactions (eqn. (10) and eqns. (6)–(9)) and consumed by the Boudouard reaction were similar to Mazumder and de Lasa [47], however taking these trends into account. Increasing gasification temperature led to an increase in CO2 consumption rate, which decreased CO concentration. Due to the enhanced endothermic water-gas reaction (eqn. (10)) as the temperature increased, H2 content increased slightly. Enhanced water-gas reactions (equation (10)) and Boudouard reactions (eqn. (4)) result in a rise in CO content as a result of a rise in gasification temperature. As a result, increasing gasification temperature leads to a greater rate of methane-steam reforming reaction (equation (10)) and decreases the amount of CH4. The products in endothermic reactions such as 1 and 2 are favored by Le Chatelier’s principle when the temperature is higher.
4.5. Model Optimization and Validation
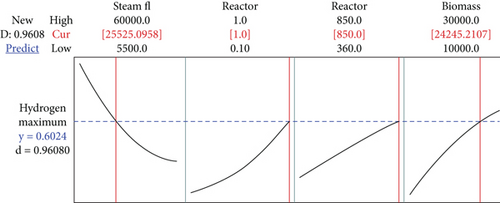
The maximum hydrogen value obtained using ASPEN Plus for the gasification of the biomass, corn cob with the input parameters such as steam flow of 60000 kg/h, the reactor pressure of 1 bar, the reactor temperature of 850°C, and the biomass flow of 30000 kg/h is 0.5862 mole fraction. Minitab 17 software (RSM) was used to estimate the optimum hydrogen produced from the process simulator in mole fraction, which was 0.6024 as shown in Figure 7. The input parameters were estimated to be a steam flow of 25525.1 kg/h, the reactor pressure was 1 bar, the reactor temperature was 850°C, and the biomass flow was 24245.2 kg/h. While ANFIS was also used to predict the mole fraction of hydrogen produced to be 0.5045, with the input parameters of steam flow, 60000 kg/h, the reactor pressure was 1 bar, the reactor temperature was 848°C, and the biomass flow was 24500 kg/h. The average hydrogen produced of 0.5085 (mole fraction) was obtained using the ASPEN Plus to validate the predicted optimal value with the experimental data. Predictive optimal model value and operational plant value were in good agreement.
5. Conclusion
The feasibility of producing syngas using corn cobs as biomass of choice was evaluated. The study performed a process simulation of steam gasification using the ASPEN Plus simulator. Using experimental data from the literature, the simulated results were validated. In addition to the gasification temperature, the steam-to-biomass ratio results in various effects on gas composition, gas yield, char yield, and H2/CO. Based on the simulated results, the yield of the gas was positively influenced by an increase in steam-to-biomass ratio from 0.8 to 2.0. The simulations show that an acceptable level of H2/CO gas could be produced under certain conditions such as steam flow of 23854.6 kg/h, the reactor pressure was 1 bar, the reactor temperature was 847.9°C, and the biomass flow was 23141.8 kg/h. Compared to the combustion of corn cobs (biomass) and without pretreatment, steam gasification significantly increased gas yield but decreased char yield. Due to the need to address the energy concerns, research in this direction using artificial intelligence integrated with process simulation will help provide relevant industrial condition that will give appropriate opportunity for understanding and constructing the optimum design for large-scale production of hydrogen.
5.1. Limitations of the Study
By coupling several gasification technologies, it is possible to overcome the limitations of each technology individually. In spite of this, hydrogen production is expected to incur higher operating costs.
5.2. Future Perspectives and Directions of the Study
The biomass gasification and catalytic gasification mechanisms must be determined in order to optimize H2 yield and control product composition. Moreover, integrating multiple gasification technologies will produce more hydrogen, as well as lower cost of production.
Conflicts of Interest
The authors declare that they have no conflicts of interest
Authors’ Contributions
Conceptualization, review, simulation, supervision, and modeling were conducted by Anthony I. Okoji; cosupervision, analysis, interpretation, review, and editing were conducted by Abiola E. Taiwo; analysis and interpretation were conducted by John Busayo Adeoye; review and editing were conducted by Paul Musonge; writing of the first draft preparation was conducted by David Olamide Makinde; review and editing were conducted by Comfort Nneka Okoji.
Acknowledgments
Open access funding is enabled and organized by SANLiC Gold.
Open Research
Data Availability
Data is available on reasonable request from the corresponding author.


