Attenuation of Coda and Body Waves for Tbilisi and Surrounding Area, Georgia
Abstract
The attenuation of high-frequency seismic waves was investigated in the crust beneath Tbilisi and the surrounding territory by analysing 225 local earthquakes that occurred from 2008 to 2020 and were recorded by eight seismic stations. The quality factors of coda waves QC and direct P and S waves, QP and QS, were estimated using the single backscattering model and the extended coda normalization method, respectively. The separation of intrinsic quality factors Qi from scattering quality factor QSC was fulfilled by Wennerberg’s method. Observed results show that all evaluated attenuation parameters are frequency-dependent in the frequency range of 1-32 Hz and increase with increasing frequency. Coda QC values increase also with increasing lapse time window from 20 s to 50 s and vary from 91 ± 5 at 1.5 Hz to 1779 ± 108 at 24 Hz, respectively. P waves attenuate slightly faster than S waves, and the ratio of QS/QP is more than unity and varies in a range of 1.5-1.8. The intrinsic and scattering quality factors are expressed by the following power laws: Qi = (77 ± 4)f(0.930 ± 0.046) and QSC = (219 ± 6)f(0.924 ± 0.050). The results show that Qi is close to QC, but QSC is larger than Qi, which means that intrinsic attenuation has a dominant role compared with the scattering effect. Our results were compared with those obtained in two other seismically active regions of Georgia, as well as with regions of the world. In general, the observed quality factors and their frequency-dependent relationships follow a similar trend, characterizing seismically active regions with complex tectonics. The calculated attenuation parameters characterize the entire earth’s crust under Tbilisi and the surrounding area. The results obtained will be useful in future seismological studies since the Q parameters are estimated for the first time for the given region.
1. Introduction
The amplitudes of seismic waves decay as they propagate through the medium. The geometrical spreading and heterogeneities of the earth are the main reasons for their attenuation. Total attenuation is a combination of intrinsic attenuation and scattering attenuation. The intrinsic absorption of seismic waves is due to the inelasticity of the medium (kinetic energy transforms into thermal energy), while the scattered attenuation is due to the scattering of seismic energy on irregularities of different sizes distributed in the earth’s crust and mantle without energy loss from the wave field [1–4]. Thus, the evaluation of total attenuation offers significant insights into the composition and geological structure of the Earth. On the other side, the knowledge of attenuation parameters is important to study different issues of seismology and engineering seismology, especially for seismic hazard assessment. There are several methods for estimating attenuation parameters using various body and surface waves, but since the 1970s, when Aki and Chouet [2] proposed the single backscattering model to characterize coda waves, measurement of the quality factor coda Q or Qc, due to its simplicity and properties of coda waves, has become one of the common methods in seismology [2, 3, 5–8]. The quality factor is an inverse of attenuation and is determined as the ratio of wave energy to the energy dissipated per cycle of oscillation [9, 10]. According to Aki [10], the seismic coda waves of local earthquakes follow the body and surface waves and are formed by the superposition of backscattered S waves from randomly distributed irregularities of various sizes in the Earth. In general, the single-scattering model [2, 11] and the multiple-scattering model [1, 12, 13] are used to characterize coda waves on seismograms. The single-scattering model assumes that coda waves propagate in an isotropic and homogeneous half-space, where heterogeneities are uniformly distributed and the scattering is a weak process and does not produce multiple scattering when primary waves encounter another scatterer (the traveling distance is less than the mean free path).
As mentioned earlier, Aki and Chouet [2] introduced the seismic attenuation parameter coda Qc, which is the measure of the decay rate of coda wave amplitudes versus lapse time (the lapse time is defined as the time elapsed after the origin time) within a certain frequency interval and developed the method for Qc estimation. Unlike direct body waves, coda waves are formed in a certain volume of the lithosphere. Therefore, the exponentially decaying rate of coda amplitudes of earthquakes at a local distance (up to 100 km) in each given frequency band does not depend on the local effect, source radiation properties on the source-receiver path, hypocentral distance, and magnitude but depends on the frequency and the lapse time [2, 10]. Because the single scattering model ignores multiple scattering waves, its reliability, and thus the physical meaning of coda Qc, has been the subject of much debate among seismologists. In the single-scattering model, the problem is the uncertainty of Qc interpretation in terms of scattering Qsc and intrinsic Qi values. In general, intrinsic attenuation plays a more significant role in coda Qc (which in turn is the same as the total S wave attenuation) than scattering attenuation [13]. Various methods have been proposed to investigate the multiple scattering process and to separate scattering and intrinsic effects. For example, Wu [12] developed the radiative transfer theory for the multiple scattering problem taking into account all orders of scattering. Wu’s method was later improved by Fehler et al. [13] to the multiple lapse time window analysis, where the total energy is estimated for three followed time windows as a function of hypocentral distance and frequency. Based on Zeng’s multiple scattering model [14] and the approximation of Abubakirov and Gusev [15], Wennerberg [16] developed the method to separate intrinsic and scattering attenuation, which relies on the independent estimation of the direct S wave Qs and the coda Qc. Although the single scattering model is no longer considered a reliable assumption, it is still used to estimate the Qc parameters as they characterize a given region and the model can be easily used to calculate the attenuation properties of the medium [2–8, 15, 17]. Generally, attenuation characteristics at a small distance (up to 100 km) were estimated mainly using a single scattering model; while at long distances, multiple scattering model was used. Numerous works around the world have been done about spatial and temporal variations of coda Q parameters and shown that the Q value is correlated with the seismicity and tectonics of the region. In general, Q values are lower in seismically active areas compared to stable regions; also, areas of complex tectonic heterogeneity reveal a strong frequency dependence on Q [3].
We also used a single scattering model [2] to estimate Qc values in the present work, since we mainly considered small local earthquakes with epicentral distances up to 62 km. The study region is Tbilisi, the capital of Georgia, and the adjacent territory. It is an old city (Tbilisi was founded in the fifth century) with a dense population, and especially over the past two decades, Tbilisi has become one of the fastest-growing cities in the South Caucasus. Tbilisi is an important industrial center of the Caucasus region, and due to its location at the crossroads between Europe and Asia, it is one of the most important transportation hubs for global energy and trade projects. For example, the Baku-Tbilisi-Ceyhan oil pipeline is passing throughout the region. Since Tbilisi is located in a seismically active area, seismic hazard assessment is critical to the seismic design of engineering projects. In turn, the correct analysis of seismic hazards is impossible without knowledge about the attenuation of seismic waves, especially high-frequency transverse S waves. In general, the geological and geophysical aspects of the Caucasus region have been widely studied [18]. There are enough articles on the attenuation of various body and surface waves in the Caucasus region [19–21], but we have very few studies about the attenuation of seismic waves in the Tbilisi area, especially about the attenuation of P waves. It should be noted that almost all of them were done in the previous century with the help of analog data. Basically, for Tbilisi, on a local scale, the attenuation of shear waves is estimated at separate (individual) local points using the geophysical survey. However, there are several studies based on regional datasets for the entire Georgia and Caucasus region [22, 23], but the mentioned models do not give us an image of the city of Tbilisi in detail. They provide information on the decay of maximum amplitudes of shear waves considering several parameters such as magnitude, hypocentral distance, faulting mechanisms, and local soil conditions. For the first time, the quality factor Qc and their frequency relationship in the lapse time window length equal to 35-45 sec were estimated for the Tbilisi area using digital data in [24], but only data from 20 earthquakes recorded on a single seismic station “TBLG” were used. The first digital seismograph was installed in Georgia in 2003, and then, the number of digital stations increased; especially since 2020, their number has been growing rapidly, and thus, we will be able to obtain more reliable data on the attenuation properties in the Tbilisi area. Thus, in the present work values of coda, Qc were obtained at four lapse time windows in different frequency bands using a single scattering model of Aki and Chouet [2], and the values and quality factors of P and S waves— Qp and Qs—were estimated with the help of extended coda normalized method [25, 26]. Then based on an independent estimation of Qc and Qs, the amounts of scattering and intrinsic attenuations of Qsc and Qi were evaluated using Wennerberg’s approach [16]. At last, we compared our results with results obtained in other areas of Georgia and other regions of the world where attenuation parameters were derived using similar methods. Such a study has not been conducted for this region yet.
2. The Study Region
The Caucasus is one of the youngest mountain systems on the Earth. It is located in the central part of the Alpine-Himalayan belt and formed as a result of a still ongoing continental collision of the Arabian and Eurasian plates. The thrust faulting systems in the Caucasus are caused by the movement of the Arabian plate to the north and by the movement of the Turkish and the Iranian blocks to the west and the East, respectively [27, 28] (Figure 1(a)). The convergence rate of these blocks is different and is about 4 mm/yr to the west, near the Black Sea, and about 14 mm/yr to the east, near the Caspian Sea. The velocity of the northward movement of the Arabian Plate is 25 mm/yr [29]. The compressional zone between the Greater and Lesser Caucasus, where Georgia is located, is characterized by active and complex tectonics. The prevailing form of deformation is trusting and high-angle reverse faulting, but normal and strike-slip faulting also exists in the territory of Georgia. In general, the main tectonic units are the mountain ranges of the Greater and Lesser Caucasus in the north and south, respectively, the Achara-Trialeti fold-thrust mountain belts, the intermountain lowlands of the Transcaucasus, and the Javakheti and Kazbegi volcanic highlands [28–31] (Figure 1(b)).

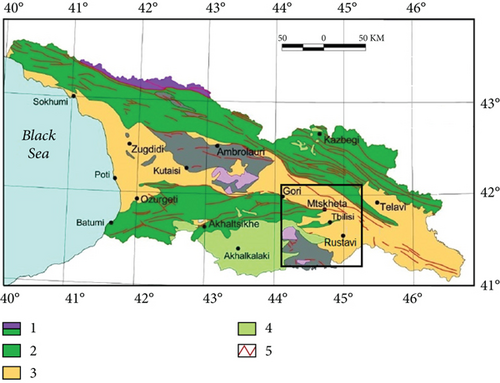
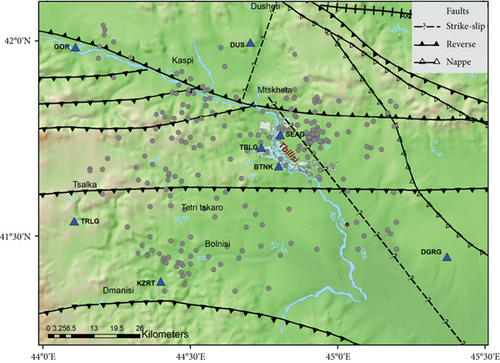
Tbilisi is the capital of Georgia, and its adjacent territory is located within the Adjara-Trialeti fold-thrust mountain belts in the intermountain (Mtkvari) depression which is notably narrow in that place. In the Tbilisi area, the (submeridional) N-S shortening through the Greater and Lesser Caucasus is mainly localized within the Lesser Caucasus [32]. There are several active faults around Tbilisi; two of them are parallel with the latitudinal strike and are located along the northern and southern borders of the Adjara-Trialeti zone with reverse motion dipping to the south and north, respectively (Figure 2). Tbilisi is located within these faults at about 10-15 km from each fault [33]. To the east of Tbilisi, along the Mtkvari River, a fault called the Tbilisi Fault stretches from Mtskheta towards Azerbaijan. Cinematically, it is a right-lateral strike-slip fault, and a number of weak and moderate earthquakes are connected with this fault zone [31]. Tbilisi and its surrounding territories are composed of terrigenous and tuffaceous rocks of the Tertiary age. An important place is occupied by Quaternary sediments with Middle Eocene outcrops. The average thickness of the Earth’s crust and the sediment below Tbilisi is about 47 km and 6 km, respectively [34].
Georgia is characterized by moderate seismicity, but strong earthquakes also have often occurred in its territory. As for the Tbilisi seismicity, it is not as high as the region of Racha in the northwest and the Javakheti highlands in the south (the Lesser Caucasus). Data about seismic events in Georgia have existed from the beginning of the Christian era, but reliable information about Tbilisi earthquakes can be found from the 13th century. From that time to the present, more than 400 noticeable earthquakes have been observed, the maximum effect of which in the city did not exceed the macroseismic intensity of VII on the Medvedev-Sponheuer-Karnik scale (MSK) [35]. Two strong historical earthquakes occurred at distances 20 and 25 km from the city in 1275 and 1896 with M6.5 and M6.3, respectively. The parameters of historical earthquakes were determined based on the macroseismic data interpretation, as well as damage information documented in ancient Georgian, and other chronicles was turned into macroseismic intensity [35, 36]. The first seismic station in Georgia was installed in 1899, and since 1900, main information about earthquakes has been obtained from instrumental and macroseismic data. Most of the earthquakes in the study area are located along the main tectonic faults. Since Tbilisi is located in the center of the Caucasus, its seismicity, in addition to Tbilisi earthquakes, is also affected by earthquakes that occur outside of Tbilisi. Basically, such source zones of earthquakes are the Javakheti highlands, the Adzhara-Trialeti fault system, the Racha and Kazbegi regions, and others. After the devastated Spitak (1988, M7) and Racha (1991, M7) earthquakes, the seismic activity increased, and because the seismic faults with potential M6.0-6.5 are located in the vicinity of the city, the territory of Tbilisi was assigned to the seismicity of VIII. The last strong earthquake occurred in Tbilisi in 2002, with a moment magnitude equal to 4.6 and a shallow depth of about 5 km. The intensity was VII-VIII MSK. The main shock was accompanied by a small sequence of foreshocks and hundreds of aftershocks. After this earthquake, seismicity increased in the Tbilisi area. Despite a moderate magnitude and a low PGA value of 0.11 g recorded by the Tbilisi seismic station, on a rock site at a distance of 6 kilometers from the epicenter, the earthquake caused serious consequences. More than 100 buildings collapsed, and eight persons died. The source mechanism of this earthquake was right strike-slip with strike azimuth 330° and was associated with the Tbilisi Fault. The moderate historical earthquakes with the intensity in the epicenter of VI-VII MSK in 1682, 1803, 1804, and 1819 also are connected with this fault [37].
3. Data
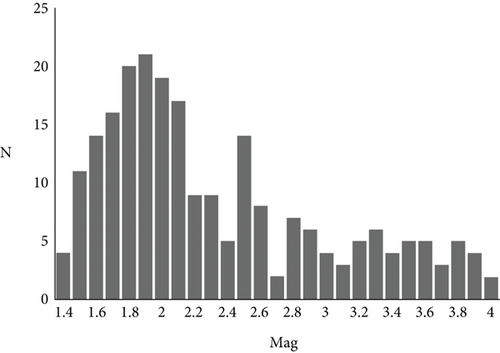
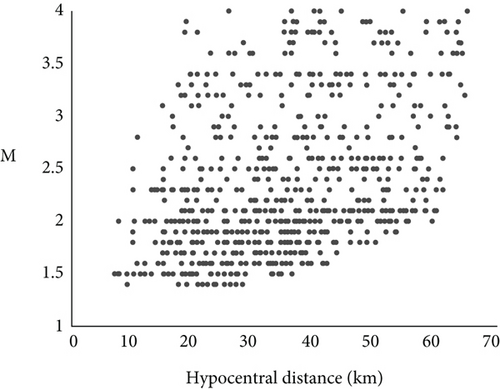
To study the attenuation parameters in the study area, we used data from two hundred and twenty-five earthquakes recorded by eight seismic stations TBLG, BTNK, SEAG, TRLG, KZRT, GORI, DUS, and DGRG for 2008-2020. Seismograms were obtained from the National Seismic Monitoring Center network of Ilia State University. These stations were mainly equipped with broadband Guralp CMG40T, CMG-3T, CMG-3ESPC, and Trillium 40 seismometers at a sampling rate of 100 samples per second. The used seismic stations were operated at different time intervals; only the s/s TBLG and TRLG have been continuously operating since 2007 and 2009 to the present, respectively. We have selected about 750 seismograms with a signal-to-noise (S/N) ratio of more than two and used the software Seismic Analysis Code (SAC) [38] to estimate the coda Qc as well as the quality factors Qp and Qs of the direct P and S waves. Each earthquake was recorded by two or more seismic stations. Earthquakes used have the following parameters: the epicentral distance varies from 7 to 62 km, the local magnitude range is 1.4-4.0, and the depths mainly are up to 25 km. Figures 2, 3(a), and 3(b) show the location of earthquakes and stations, the distribution of the number of used earthquakes by magnitudes, and the distribution of the hypocentral distance of selected data by magnitudes, respectively.
4. Method and Data Processing
4.1. Qc Estimation
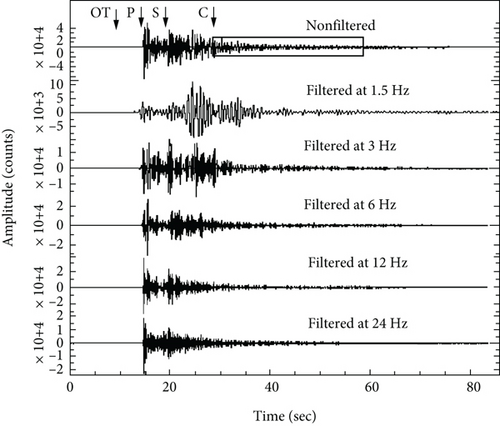
4.2. Qp and Qs Estimation

4.3. Qi and Qsc Estimation
Qi and Qsc were estimated from the corresponding values of Qc and Qs using Equations (5)–(8). Unfortunately, we used this method routinely and did not yet check the reliability of Wennerberg’s approximation to our data. Since the present method is based on the assumption that the source and station are located in the same place, it is needed to study the solutions to the energy transport equation in two cases when the source and receiver are separated by a distance and collocated (in our case, the epicentral distance is up to 62 km) [7, 40, 41]. We expect to study this issue in the near future.
5. Results and Discussion
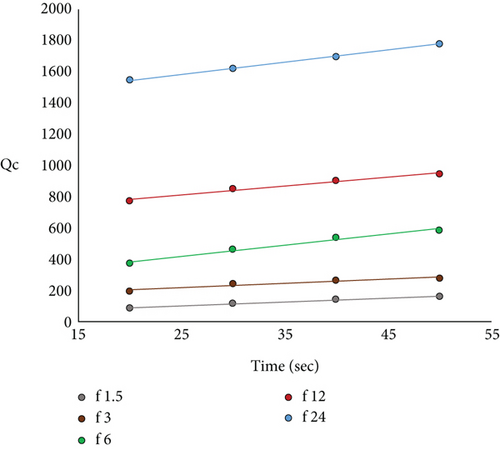
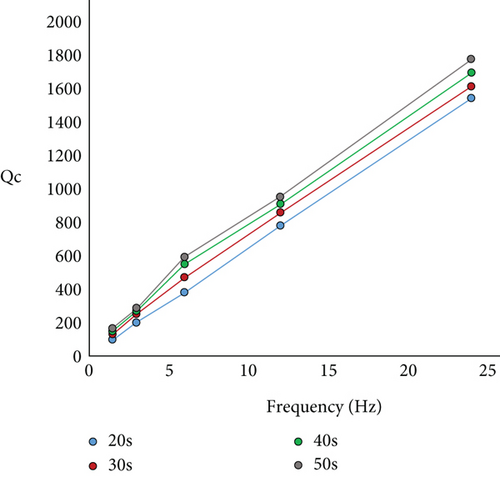
The estimated attenuation parameters, Qc, Qp, Qs, Qi, and Qsc, increase with increasing frequency in the range of 1-24 Hz. The values of Qc also increase with increasing the lapse time window length, and we have evaluated coda Qc in four lapse time windows; minimum and maximum lapse time windows were 20 s and 50 s, respectively, since the results of less than 20 s and more than 50 s were not stable. The mean of Qc values averaged over all stations for each lapse time window in each frequency band is given in Table 1. Figures 6(a) and 6(b) show that relationships between the Qc parameters and lapse times t are almost linear at all central frequencies. The Qc frequency relations follow a power law function of the form in all lapse time windows, where Q0 is the quality factor at 1 Hz and n is the frequency exponent [42]. Both values depend on lapse time, and Q0 increases and n decreases as the lapse time window length increases (Table 1). Frequency relationships of Qc vary from Qc = (62 ± 3) f(1.016 ± 0.031) to Qc = (114 ± 7) f(0.865 ± 0.053) for 20 s and 50 s lapse time windows, respectively. The time dependence of Qc values can be explained by several factors [43], but the main reason for the increase in Qc over time, especially for the single scattering model, is probably the change in attenuation with depth [7, 43–46]. According to Aki and Chouet [2], in the Qc method, when the source and the receiver are at the same points, coda waves sample different circular areas of radius Vst/2, where t = tcoda + w/2 (tcoda is the average starting time of coda waves, and w is the length of lapse time window), and Vs is the average velocity of S waves (Vs = 3.4 km/s). We have considered coda windows lengths of 20, 30, 40, and 50 s, and so, coda waves are generated in circular areas with radii of approximately 51, 60, 71, and 84 km, respectively. This means that coda waves formed in long lapse time windows characterized attenuation properties of deep zones of the earth, and the upper layers of the lithosphere are less heterogeneous than the deeper zones of the lithosphere beneath Tbilisi and the adjacent areas. As mentioned in the abstract, we have calculated the coda Qc for Tbilisi City using data of 20 earthquakes recorded at TBLG station in the lapse time window of 40 s and got the following relation: Qc = (86 ± 8)f(0.890 ± 0.062). Currently, we obtained approximately the same result Qc = (102 ± 6)f(0.889 ± 0.042) using the data from eight seismic stations for the 40 s lapse time window [24].
| Lapse time (s) | 1.5 Hz, Qc ± σ | 3.0 Hz, Qc ± σ | 6 Hz, Qc ± σ | 12 Hz, Qc ± σ | 24 Hz, Qc ± σ | Q0 ± σ | n ± σ |
|---|---|---|---|---|---|---|---|
| 20 | 91 ± 5 | 196 ± 10 | 373 ± 23 | 777 ± 42 | 1545 ± 83 | 62 ± 3 | 1.016 ± 0.031 |
| 30 | 121 ± 5 | 247 ± 13 | 465 ± 31 | 853 ± 45 | 1618 ± 86 | 86 ± 4 | 0.927 ± 0.036 |
| 40 | 143 ± 8 | 267 ± 17 | 543 ± 38 | 904 ± 54 | 1698 ± 94 | 102 ± 6 | 0.889 ± 0.042 |
| 50 | 163 ± 11 | 281 ± 23 | 587 ± 42 | 948 ± 60 | 1779 ± 108 | 114 ± 7 | 0.865 ± 0.053 |
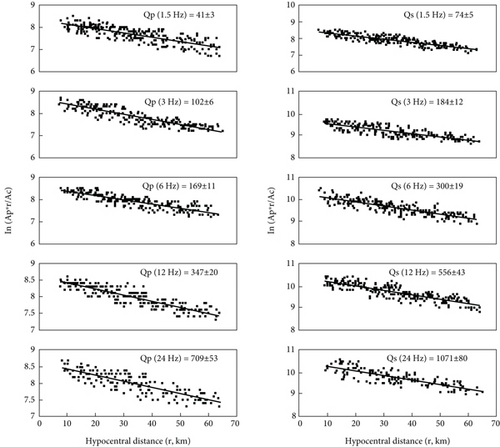
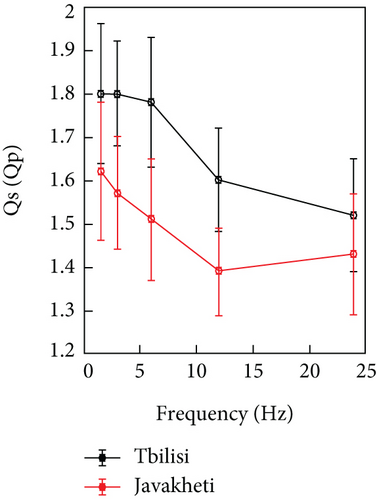
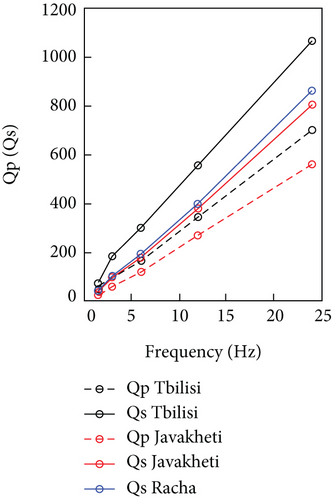
We got that frequency relation parameters n are about unity for both Qp and Qs, but it is a little more for Qp than for Qs. It means that P attenuates faster than the S wave. The ratio Qs/Qp is more than unity for all central frequencies and varies from 1.5 to 1.8 which is approximately equal to Vs/Vp. Such a result is observed in many regions of the world with a high degree of lateral heterogeneity [3, 47–51]. We observed similar results for another more seismically active region, the Javakheti volcanic plateau, where the Qs/Qp ratio varies in the range of 1.4-1.6 (Figure 8(a)) [51]. The values of Qp and Qs along the frequency for three regions of Georgia are given in Figure 8(b). Unfortunately, Qp is not estimated for the Racha region. Attenuation is high in all these regions, but Qp and Qs parameters are higher in the Tbilisi area than in the Javakheti plateau and the Racha region as was observed for coda Qc.
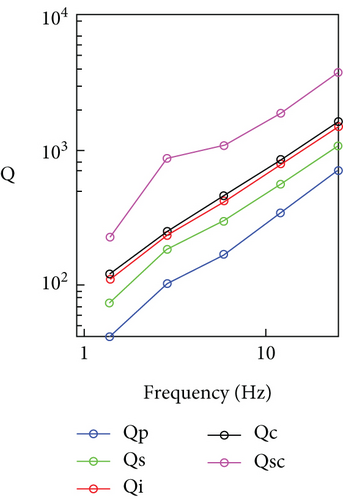
For comparison of Qc and Qs values, we have chosen the Qc calculated at the 30 s coda window, since the coda waves generated in the 30 s coda window and the S waves of earthquakes with a travel time of less than 15 s sample about the same volume of the Earth’s crust. In more detail, they sample a little more of the entire crust, as the thickness of the crust under the Tbilisi area is about 48 km [34]. Since the frequency relation parameters for Qc in coda window 30 s and Qs are practically the same (0.927–0.930), the nature of their attenuation with frequency is similar [6, 25].
The values of Qi and Qsc increase with increasing frequency and vary from 107 to 1458 and from 242 to 4032 in the frequency range of 1.5-24 Hz, respectively. We have estimated the seismic albedo B0 = Qi/(Qi + Qsc) and got that B0 < 0.5 for all central frequencies and is about 0.3. This means that in coda wave attenuation, anelasticity (intrinsic) attenuation dominates over the scattering effect since Qsc is more than Qi (Figure 8(c)). Also, Qc is greater than Qs which is consistent with the model of Zeng [14], according to which values of Qi and Qsc should be such that Qc exceeds Qs. Similar results were obtained for the Racha region [46]. The knowledge of the relative amounts of scattering and intrinsic attenuation in the total attenuation is important because they characterize the tectonic of a region [3, 52–55].
The results obtained in the present study were compared with other tectonically active regions of the world, as well as with two regions of Georgia: the Racha region, where a strong earthquake M7 occurred in 1991, and the Javaketi volcanic plateau. For comparison, the values of Qc observed in the time interval of 30 s for all the considered regions were chosen since the coda waves should sample approximately the same volume (Figure 9). The Qc values obtained for the Tbilisi area (line 7) are close to the Northwest Caucasus (line 9) and are more than the Racha (line 4) and the Javakheti (line 5) regions, which indeed are more seismically active regions than the Tbilisi and surrounding territory. In general, the low values of Qc and their frequency-dependent behavior in the study region are comparable and correlate with other seismically active and heterogeneous regions considered in the study, except the Etna volcanic region (line 1), which is characterized by a high-level attenuation (Qc values are low; parameter n is high).
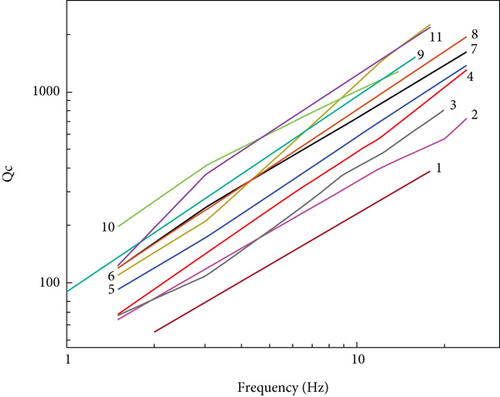
The same tendency showed values of Qi and Qsc. For comparison of these parameters, we selected those regions where the Wennerberg approach [16] was applied (Figures 10(a) and 10(b)). The observed results show that the study area is seismically active and highly heterogeneous as the whole territory of the Caucasus.
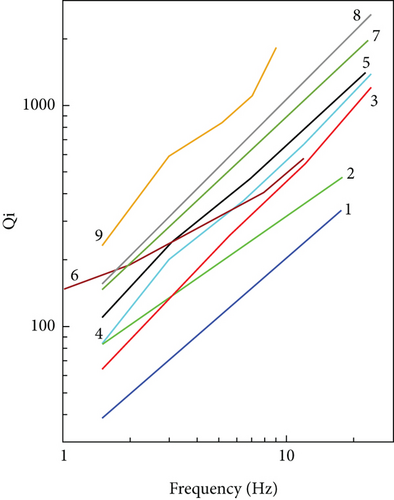
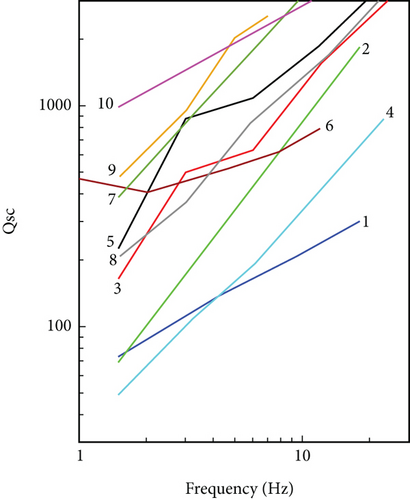
As was noted above, the Caucasus is one of the youngest mountain systems on the Earth and is characterized by relatively late folding which is more disturbed and inhomogeneous. In such regions, attenuation is high and Q values are low compared to those regions where the medium is more consolidated with a small number of heterogeneities. The low values of Q parameters in the study region can be connected to a rather complex morphological (tectonic, lithological) structure of Tbilisi and its environs. In the vicinity of Tbilisi, there are large landforms, in the formation of which tectonic processes played a leading role. In the relief of the Tbilisi region, many anticlinal and synclinal folds are well expressed, which are significantly complicated by tectonic creeps and ruptures [63].
The crust under Tbilisi and the surrounding area is complex and is divided into small blocks of different sizes. Numerous lateral cracks and faults are distributed in the lithosphere [64]. Also, based on field observation and analysis of boring and geophysical data parallel and very close to the Tbilisi fault, a hidden deep fault was established [2]. The high attenuation and especially the predominance of intrinsic attenuation over scattering is possibly due to the presence of oil, gas, clay, and water reservoirs. Tbilisi is rich with natural thermal waters, at different depths from 300 to 3500 meters, and there is a powerful aquifer with a temperature of 400°С to 740°С, associated with outcrops of Middle Eocene deposits [63]. This is an underground natural reservoir. In general, knowledge of the variation of seismic wave velocities and attenuation parameters with depth is important for a more accurate interpretation of seismic wave attenuation mechanisms and the tectonics of a given region which is the scope for future works.
6. Conclusions
The quality factors of coda, P, and S waves—Qc, Qp, and Qs, and also the amount of intrinsic Qi and scattering Qsc parameters were estimated in different frequency bands for metropolitan Tbilisi City and surrounding territory. Even though the seismicity of Tbilisi and its surrounding territory is less than in some other regions of Georgia, seismic hazard assessment is an important task for the region under study, since the number of various constructions is currently increasing dramatically. There are also many buildings built in the 19th and early 20th centuries, and most of them are in poor condition, and as we saw, the moderate earthquake of 2002 caused significant damage to the city. It should also be taken into account that individual areas of the city react differently to earthquakes. Thus, it is needed to improve corresponding studies about hazards according to modern building codes. This is especially necessary for Tbilisi, where landslides are typical for the study area, and even a relatively weak earthquake can cause significant damage to the city. The uncertainties in the prediction of the earthquake ground motion model, which is one of the main steps in the analysis of seismic hazard, are mainly caused by a lack of knowledge about the parameters of attenuation of seismic waves and the regional structure of the earth. The analysis of quality factors, especially their spatial and temporal variations, is important for understanding the attenuation characteristics in a given area in different frequency ranges. Our results show that each region needs to be analyzed separately, since they differ from each other in seismic and tectonic structure, and, accordingly, the attenuation parameters will also be different. The results obtained in this study are useful for assessing the seismic hazard in Tbilisi and other tasks of seismology. In the near future, several seismic stations will be installed in Tbilisi and its environs, and it will be possible to study the attenuation parameters in more detail, namely, by using multiple scattering models. We also plan to expand our research to other regions of Georgia, such as the western and eastern parts of Georgia where several strong earthquakes (M > 6) occurred both in the last century and in the historical period. Thus, we will be able to regionalize almost the entire territory of Georgia according to the Q parameter.
Conflicts of Interest
The authors declare that there is no conflict of interest regarding the publication of this paper.
Acknowledgments
This work was supported by the Shota Rustaveli National Science Foundation of Georgia (SRNSFG) (grant number #FR-21-2046). We would also like to thank the Scientific Foundation for the financial support.
Open Research
Data Availability
The data about all earthquakes are collected by a team of the Institute of Earth Sciences and National Seismic Monitoring Centre (http://ies.iliauni.edu.ge) under the Ilia State University, and access can be done upon the special request to the institute. Requests for access to these data should be done via e-mail ([email protected]).


