Heterogeneous UAV Swarm Collaborative Search Mission Path Optimization Scheme for Dynamic Targets
Abstract
To solve the problem of collaborative search mission planning (CSMP) for a heterogeneous unmanned aerial vehicle (UAV) swarm for dynamic targets, this paper proposes a new CSMP scheme for a heterogeneous UAV swarm. First, a new polar coordinate system motion method is used to establish the UAV motion model and decision input solution model, which effectively solves the path-unified coding problem of a heterogeneous UAV swarm. Then, in the mission area, a dynamically updated multisearch situation map model is established. Finally, to improve the global searching capability of a UAV, an improved path optimization algorithm PSO-Rolling Horizon Control (PSO-RHC) is designed. Multiple Monte Carlo simulations are performed for three time-sensitive moving target types and three constraint types. The simulation results show that the task execution efficiency indexes of the proposed scheme for the decision input solution model, pheromone update mechanism, and optimization algorithm are improved by 188%, 72%, and 102%, respectively, and the overall performance is improved by 227%.
1. Introduction
Unmanned aerial vehicles are increasingly used in modern air combat to enhance the combat capabilities of manned aircraft [1]. Due to limited capacity and computing power, drones cannot obtain enough resources to complete tasks, and drones themselves do not have enough power to complete complex tasks. Efficient collaboration among multiple UAVs can effectively improve the task execution efficiency of a UAV swarm. Decentralization, autonomy, and robustness of UAV swarm cooperative control similar to the distributed and self-organizing properties of biological groups such as ant colonies, bee colonies, bird swarms, and fish swarms are required [2]. The UAV swarm is an autonomous system inspired by the self-organization mechanism of biological groups, with complementary functions and cooperative operations, which greatly improves execution efficiency. Therefore, cooperative control techniques of UAV swarms have been presented and widely investigated.
The multi-UAV cooperative mission planning problem (MCMPP) is a somewhat complicated and challenging NP-H optimization problem. The mission planning optimization algorithm optimizes a UAV swarm flight path with the constraints of a mission environment to improve the coordination efficiency and task execution efficiency of the UAV swarm. Due to the large scale of the UAV population, its computing and communication volumes are increasing exponentially, making it difficult to centralize decision-making within a useful time frame. Therefore, distributed decision-making schemes have been proposed for a variety of applications, such as swarm flocking [3], reconnaissance [4], surveillance [5], cargo transportation [6], search [7], assignment of tasks, and planning of routes [8–10].
At present, the MCMPP for a homogeneous UAV swarm has been extensively studied. However, in practical real-time search, rescue, and security systems, there is a clear trend that many different types of autonomous drones perform different functions, and each type is specialized and efficient to perform specific tasks. Autonomous UAVs with various architectures and characteristics provide strong teamwork capabilities while controlling system complexity and cost and are widely used in military and civilian fields. Heterogeneous UAVs can adapt to changing mission requirements during joint mission execution. Compared with similar drones, it can significantly improve system performance and reduce integration and maintenance costs [11]. In contrast to a homogeneous UAV swarm, UAV performances in a heterogeneous UAV swarm, including maneuverability, sensor performance, and task execution performance, are usually heterogeneous. The multifunctional heterogeneous UAV cooperative mission planning problem (MFHCMPP) has NP-hard complexity in path optimization [12], and its heterogeneity makes it difficult to find the optimal solution. To solve the MFHCMPP, in reference [13], the authors considered a sensor heterogeneous UAV swarm and the task scenarios with timing constraints and functional constraints. A multigroup fruit fly optimization algorithm (MFOA) was proposed to solve the MFHCMPP. In the simulation experiment, the 3D path planning results of the UAV swarm were generated based on the criterion of minimizing the completion time and the total task time at the same time, which verified the effectiveness of the method. In reference [14], the authors considered a heterogeneous UAV swarm with interchangeable recording sensors and established a mathematical model that integrated the sensor allocation and path planning problems. A comprehensive mission planning framework based on a two-level adaptive variable neighborhood search algorithm was proposed. The framework had high flexibility to solve complex NP-H optimization problems. In reference [15], a heterogeneous unmanned vehicle system, including a UAV, unmanned ground vehicle (UGV), unmanned surface vessel (USV), and other unmanned vehicles, was established to solve the problem of the search and track cooperative path planning for underwater targets. Then, in order to reduce the computational complexity of the combined search space between unmanned vehicles, a heterogeneous system framework, cooperative strategy, and path planning algorithm were developed, and the communication mechanism and information flow between unmanned vehicles were defined.
In the research field of the MCMPP, from the perspective of the task type, the research on path planning for static tasks is relatively mature. The main classical models include the multitrip salesman model (MTSP), mixed linear integer programming model (MILP), and vehicle scheduling and path planning model (VRP). These models are solved with heuristic algorithms [16] such as genetic algorithms (GAs) [17, 18], evolutionary algorithms (EAs) [19, 20], ant colony optimization (ACO) [21–24], and particle swarm optimization (PSO) [4, 25, 26].
Path planning for dynamic tasks [27, 28] is another research field of the task type in the MCMPP relative to static tasks. The cooperative search task of a UAV swarm for dynamic targets is a type of dynamic task. Due to the unknown location of the mission target, the path-planning method based on the static model cannot be directly applied. Therefore, in order to solve the cooperative search problem of a UAV swarm for dynamic targets, target probability map (TPM) [29–34], digital pheromone map (DPM) [35–38], and environment map [39] methods are widely used to help a UAV swarm perceive the surrounding environment. A TPM is a probability distribution model that is used to describe the probability distribution of unknown search targets in the given mission area. In reference [33], an improved multi-TPM model for multitype targets was proposed by establishing a TPM model that distinguished target types. At the same time, the TPM model was able to update the target probability distribution by adding time parameters in the model over time. To a certain extent, the algorithm solved the problem of the cooperative mission planning of UAV swarms for dynamic targets. However, the problem with this algorithm was that the model relied heavily on the prior information of the target, and the target type could not be modified during task execution. In reference [34], the two-dimensional normal random distribution was used to describe the initial TPM, and the authors designed a TPM update method during the task. However, the definition of the target’s prior information and the target’s motion type in the literature was not sufficient, and the definition of heterogeneous sensors in the UAV swarm was not considered. In this research, inspired by the ant colony pheromone indirect communication collaboration method, the DPM, which has physical characteristics such as secretion, propagation, and volatilization of bio pheromones, is established and updated in the established mission area to describe the search state of the UAV cluster for the mission area. In reference [33], the return visit of the UAV swarm to the searched area was implemented by using three operations of pheromone concentration volatilization, residue, and secretion to update the pheromone map. However, the problem with this method is that the oversimplified method of constant increment and threshold limitation was used to secrete pheromones. This problem leads to the low efficiency of a UAV’s return search. In reference [35], two types of pheromones, attraction and repulsion, were used to mark search areas that had not been visited for a long time and had been recently visited, respectively. Through this pheromone guidance mechanism, the selective search of the search area and the nonsearch area was realized, and the phenomenon of a UAV flying out of the search area could be avoided. However, the problem with this method was that the above two types of pheromone coordination and update algorithms needed to be optimized. Under special numerical conditions, the pheromone guidance mechanism would be wrong.
To improve the optimization efficiency of the MCMPP, a mathematical model is usually established to describe the flight path of a UAV swarm. The mathematical model can encode the UAV flight path to facilitate the heuristic optimization algorithm. This type of mathematical model is called a decision input solution model [33]. In the study of the MCMPP for dynamic targets, the existing literature [33–35, 39–43] often uses the method of a geometric model. The method based on the geometric model focuses on describing the necessary constraints and seeks feasible and safe paths that meet the preknown flight environment through the establishment of mathematical models to solve the problem. Almost all graph-based exploration methods, such as the Grid method [33–35, 39], A ∗ [40], Phi ∗ [41], Dijkstra search method [42], and Voronoi graph method [41], have been classified as model-based methods. The algorithm based on the geometric model is easy to implement and can efficiently provide the correct path for each drone through the static roadmap so that all obstacles and threats can be detected early. For example, in reference [41], the incremental Phi ∗ method is proposed to solve the path planning problem of UAVs at any angle on the grid, which can obtain the shortest path close to the optimal. In references [33–35, 39], the Grid method, a UAV motion model that discretizes the direction of UAV motion, was used as a decision input solution model. To simplify the calculation, the decision input solution was defined as three grid points at different distances near the current motion direction of the UAV. Geometric model-based methods have shown significant advantages in reducing computational complexity and increasing practical efficiency, but given the complete availability of global environmental information, the scope of these methods is limited. Furthermore, the geometric models of these methods may yield suboptimal results in terms of accuracy and practicality due to the performance limitations of the geometric models. First, the high maneuverability of a UAV is limited by this method. Since the flight path of a UAV is connected by discrete grid points, the UAV can only move in the given direction, which greatly limits the flight freedom of the UAV. This problem causes the UAV path generated by the optimization algorithm to meander, which is inconsistent with the actual flight trajectory of a UAV. Second, this method is not suitable for a uniform UAV swarm. The research on UAV flight speed and energy consumption modeling in reference [44] shows that a UAV has higher energy utilization efficiency and a longer flight distance when it moves at a constant speed. Therefore, in the cooperative mission planning problem of a UAV swarm, it is usually assumed that the UAV is moving at a constant speed. However, in the Grid method, the motion distance of the UAV depends on the distance between the changing grids. Third, this method is not suitable for heterogeneous UAV swarm. The maneuverability factors of different types of UAVs, such as speed, step size, minimum turning radius, and maximum heading angle, are usually different. This makes it impossible to use the same size grid to describe the path of different types of drones. Therefore, the current Grid method has some problems and cannot be used as an appropriate input solution model to solve the collaborative search mission of a heterogeneous UAV swarm for dynamic targets.
- 1.
Based on the polar coordinate system motion method, an improved UAV motion model and a decision input solution model are established. Therefore, the high maneuverability of each heterogeneous UAV can be fully released in path optimization.
- 2.
A dynamic updating multisearch situation map model is established, including an environmental search map, an environmental pheromone map, and a TPM. A numerical update algorithm based on a normal distribution integral is used to update the pheromone concentration in the environmental pheromone map. The multisearch situation graph model improves the search performance of UAVs and the task information sharing performance among UAVs in the UAV swarm.
- 3.
The improved path optimization algorithm PSO-Rolling Horizon Control (PSO-RHC) is designed. Based on the traditional PSO algorithm, the RHC method is used to improve the global optimization performance. In addition, the optimal solution rolling mechanism is designed to improve the convergence speed of the PSO-RHC algorithm. Compared with the traditional heuristic algorithm, the UAV swarm path obtained with the PSO-RHC algorithm is smoother and the optimization performance index is higher.
- 4.
Three types of motion and time-sensitive targets that distinguish known partial motion state information are considered, including unknown static targets, unknown dynamic targets, and dynamic targets with known partial prior information. In the task planning problem, heterogeneous UAV maneuverability constraints, sensor constraints, and flight energy constraints are considered.
The rest of this article is organized as follows. The second section describes the cooperative mission planning problem of a heterogeneous UAV swarm and establishes an improved UAV motion model, a dynamically updated multisearch situation graph model, and a collaborative search mission optimization model. In the third section, the PSO-RHC algorithm is proposed to achieve the cooperative search path optimization of a UAV swarm. In the fourth section, a Monte Carlo simulation is carried out to verify the effectiveness of the proposed method. Finally, the fifth section offers the conclusions.
2. Modeling of the Cooperative Mission Planning Problem for a Heterogeneous UAV Swarm
In this section, the heterogeneous UAV model, multisearch situation map model, and collaborative search mission optimization model are established.
2.1. Heterogeneous UAV Model
The UAV swarm considered in this research is composed of heterogeneous fixed-wing UAVs; that is, each UAV has different functional and performance constraints, including different maximum turning angles, different motion speeds, and different target detection performance. The mission area S ∈ R2 is assigned, in which there are n ∈ N multitype UAVs and i ∈ I unknown targets. In the task, three types of motion and time-sensitive targets with known partial motion state information are considered, including unknown static targets, unknown dynamic targets, and dynamic targets with known partial prior information. Among these targets, the dynamic target with known partial prior information refers to the fact that the trajectory of the target has been observed for a long time before the start of the mission, and some position data for the target is obtained by sampling as the prior information of the mission. The mission of the UAV group is to search for moving targets in an unknown environment through an effective decision-making method based on limited prior information. The total mission time is kmax.
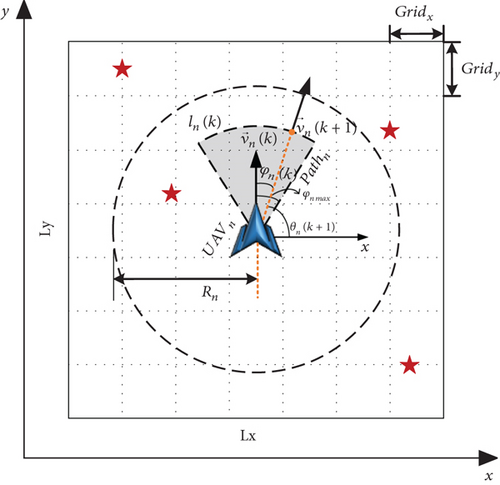
2.2. Multisearch Situation Map Model
A multisearch situation map is established, and each grid in the task area is assigned, including the environment search map, environment pheromone map, and TPM.
2.2.1. Environment Search Map
2.2.2. Environment Pheromone Map
In the global pheromone update mechanism shown in Equation (7), using a0(x, y) as the reference value and τx,y as the upper limit of the integral of the normal distribution function, the growth from reference value to ax,y(k) is .
Letting μ = λ × kmax, the growth rate of the pheromone concentration after grid pheromone volatilization can be adjusted using the parameter λ.
2.2.3. TPM
- a.
For unknown static targets and unknown dynamic targets, the probability of the targets being in any grid in the task area is the same, so the target probability distribution density function can be described by a uniform distribution.
- b.
For the dynamic target with known partial prior information, the prior information data is defined as a set of grid coordinates, including Ε × Ic grid coordinates.
2.3. Collaborative Search Mission Optimization Model
The purpose of UAV swarm cooperative search is to cover the task area under the given constraints and detect more targets. According to the multisearch situation map model proposed in Section 2.2, the corresponding revenue evaluation subfunctions are established, namely, environmental search revenue JS(k), environmental pheromone revenue JA(k), and target existence probability revenue JP(k).
At k, N selects the optimal solution U∗(k) from U(k) as the optimal decision input that can maximize J(k + 1) and generates the search path for each UAV according to U∗(k).
3. Design of PSO-RHC Algorithm
In this section, the PSO-RHC algorithm for collaborative search mission planning is proposed, including the coding method of the decision input solution, the solution process of the PSO algorithm, and the design of the rolling horizon control method.
3.1. Coding Method of Decision Input Solution
3.2. Solution Process of PSO Algorithm
The optimal decision input problem shown in Equation (21) can be defined as an optimization problem of N dimensional solution space, which can be solved with the PSO algorithm.
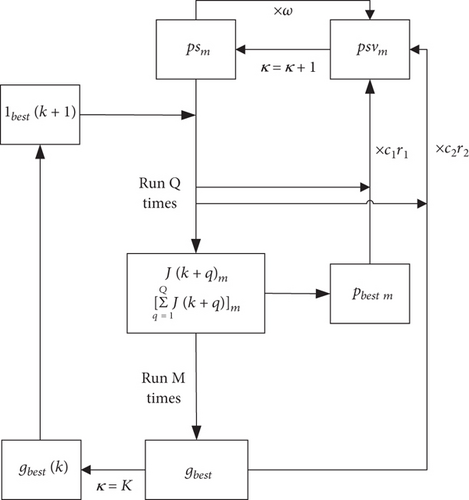
First, the particle swarm PS consists of M initialized particles psm(m = 1, 2, ⋯, M) that are randomly generated. Secondly, PS performs multiple iterations to optimize the objective function J, and pbestm and gbest are recorded as the historical optimal solutions of psm(κ) and gbest, respectively. Then, the moving speed psvm(κ) of psm(κ) is calculated and generated. Finally, after PS iterates to the maximum number Κ, gbest is the output.
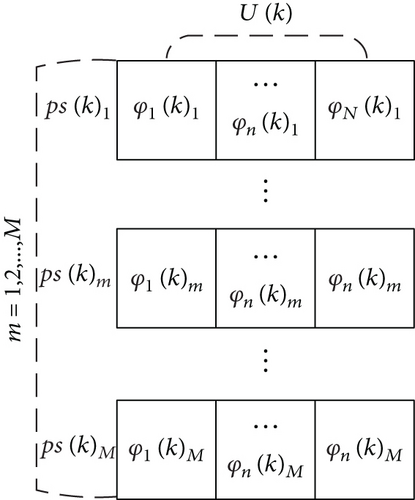
Each psm is independently taken as the decision input solution in Equation (19) to obtain pbestm and gbest to complete an iterative calculation of the particle swarm. After PS iterates to Κ, gbest is the optimal decision input solution U∗(k) of N at k.
3.3. Rolling Horizon Control Method
Therefore, it is necessary to expand the dimension of the solution from N to D = N × Q in the particle swarm structure, as shown in Figure 2. The particle swarm structure controlled by the rolling horizon is shown in Figure 3.
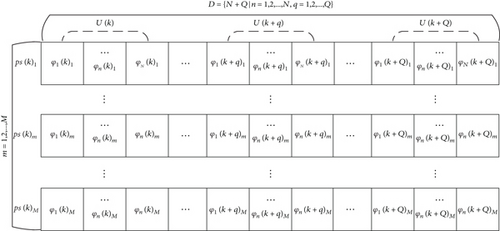
With the above method, the search path and overall performance gain of N in [k, k + Q] can be calculated at k. The optimal decision input U∗(k), which can make , can be generated at k. In this way, the UAV swarm can consider further path optimization and jump out of the local optimum to improve the overall search mission performance.
However, the cost of doing this is more computational resource consumption and a slower particle swarm convergence speed. In the PSO algorithm, the factor of whether the initial solution is good enough has a great influence on the convergence speed of the particle swarm. Therefore, the following method, called the optimal solution rolling mechanism, is used to provide a suboptimal solution for the PSO algorithm as an initial value.

As the inheritance of the optimal solution at k, lbest(k + 1) can effectively improve the convergence speed of the PSO-RHC algorithm.
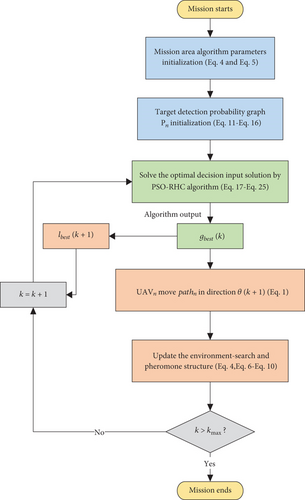
The algorithm flow of the PSO-RHC algorithm is shown in Figure 5.
4. Simulation Experiments
To verify the superiority of this method in the optimization of the UAV swarm search, a simulation based on MATLAB is carried out. This section describes how the performance of the proposed method is studied based on four aspects, including the decision input solution model, the pheromone update mechanism, the optimization algorithm, and the overall improvement. Compared with the corresponding four algorithms, the performance of the proposed method is studied and its superiority in the search optimization of a UAV swarm is proven.
The mission execution flowchart of the UAV swarm N to perform the collaborative search mission is shown in Figure 6. After the mission starts, first, as shown in the blue process of Figure 6, the relevant parameters and matrix of the mission area algorithm are initialized according to Equations (4) and (5), and the target detection probability graph matrix Pn is initialized according to Equations (11)–(16). Then, as shown in the green process of Figure 6, according to the collaborative search task optimization model and the solution process of the PSO-RHC algorithm, shown in Equations (17)–(25), the optimal decision input solution gbest(k) is solved. Finally, as shown in the orange process in Figure 6, the UAV swarm N motion state is updated according to the UAV motion model shown in Equation (1), and the environment-search and pheromone structure is updated according to Equations (4) and (6)–(10), respectively. If k > kmax, the mission ends, and all the algorithm pops out. Otherwise, k = k + 1 and proceed to the next iteration until k > kmax.
4.1. Mission Scenarios and Parameter Settings
| Target label i | Target type | Coordinate Ci | Speed vi(km/h) | Radius di(km) |
|---|---|---|---|---|
| 1 | Ia | (70.59, 80.51) | 0 | 0 |
| 2 | Ia | (164.48, 161.02) | 0 | 0 |
| 3 | Ib | (105.1, 110.23) | [50.2, 100.4] | 20.3 |
| 4 | Ib | (70.34, 92.56) | [50.2, 100.4] | 23.6 |
| 5 | Ic | (72.26, 126.38) | [50.2, 100.4] | 29.66 |
| 6 | Ic | (124.4, 63.76) | [50.2, 100.4] | 32.51 |
| 7 | Ic | (119.68, 130.13) | [50.2, 100.4] | 34.34 |
| 8 | Ic | (80.32, 59.06) | [50.2, 100.4] | 30.9 |
It is assumed that the UAV swarm N enters the mission area at k = 1 and the system iteration step is 20 s, that is T = 20. In addition, it is assumed that the UAV swarm flies at different altitudes, so the collision between UAVs is not considered in the research and simulation of this paper. During each iteration of the system, the UAV swarm has a displacement and performs detection for the surrounding environment. The UAV swarm N contains four UAVs with different performances, as shown in Table 2. In Table 2, the UAV swarm is divided into the three levels of A, B, and C based on the aspects of maneuver performance and detection performance. The take-off position coordinates of each UAV are given. The specific performance parameters of a heterogeneous UAV are shown in Table 3. The other relevant parameters in this method are shown in Table 4.
| UAV label | Whole performance | Maneuver performance | Detection performance | Take-off position |
|---|---|---|---|---|
| 1 | A | A | A | (10, 10) |
| 2 | B | A | B | (10, 190) |
| 3 | B | B | A | (190, 190) |
| 4 | C | B | B | (190, 10) |
- The performance rating order is A > B > C.
| UAV label | Maximum turning angle φn max | Speed vn(m/s) | Maximum detection radius Rn(km) | Target detection parameter αn(km) |
|---|---|---|---|---|
| 1 | 75° | 216 | 10 | 4.35 |
| 2 | 75° | 216 | 6 | 2.61 |
| 3 | 45° | 180 | 10 | 4.35 |
| 4 | 45° | 180 | 6 | 2.61 |
| Parameter name | Parameter value | Parameter description |
|---|---|---|
| T | 20 | Step of system iteration (Equation (1)) |
| λ | 0.2 | Update constant of global pheromone (Equation (10)) |
| E | 200 | Number of Ic type target prior data (Equation (13)) |
| δ0 | 50 | Normal distribution variance (Equation (14)) |
| M | 10 | Number of particles in Equation (22) |
| Q | 6 | Rolling times in Equation (23) |
| K | 24 | Maximum iterations in Equation (22) |
| D | 24 | Dimension of decision input solution in Equation (23) |
4.2. Simulation and Analysis
The task execution efficiency of the heterogeneous UAV swarm search mission is affected by multiple modules in the mission planning scheme. This research improves the mission planning scheme based on three aspects: decision input solution model, pheromone update mechanism, and optimization solution algorithm. Therefore, in the simulation, the proposed algorithm is compared with four other different algorithms, which have different variables mentioned above for the three aspects. The algorithm list and the differences between the algorithms in the simulation are shown in Table 5.
| Algorithm label | Decision input solution model | Pheromone update mechanism | Algorithm of optimization |
|---|---|---|---|
| Algo. 1 | Polar coordinate | Integral method | PSO-RHC |
| Algo. 2 | Grid method [33] | Integral method | PSO-RHC |
| Algo. 3 | Polar coordinate | Constant increment [33] | PSO-RHC |
| Algo. 4 | Polar coordinate | Integral method | PSO [4] |
| Algo. 5 | Grid method [33] | Constant increment [33] | PSO [4] |
4.2.1. Path Optimization Performance Analysis
As shown in Figure 7, the Grid method [33–35, 39] shown in Table 5 is a UAV motion model that discretizes the direction of UAV motion. In the Grid method, the decision input solution is defined as three grid points at different distances near the current motion direction of the UAV, which leads to the change of the motion step of the UAV. However, many references often consider the UAV as a uniform motion when using the Grid method for simulation and ignore the problem of the change of the UAV motion step size, which causes the simulation results to have large errors. In the simulation experiment of this research, as shown in Table 3, the UAV is moving at a constant speed. To prove and eliminate this error, the simulation method is as follows:
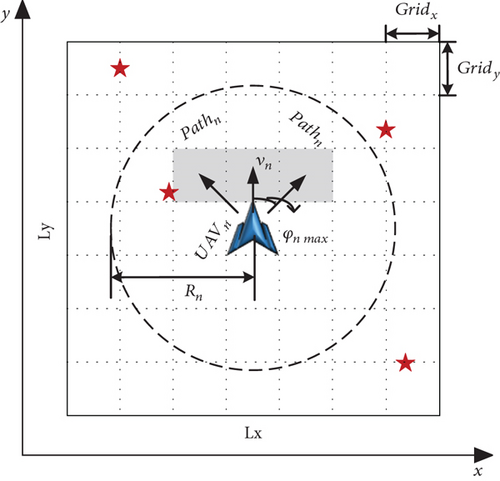
In addition, due to the discrete and fixed motion direction of the UAV in the Grid method, the Grid method cannot solve the path optimization problem of the UAV swarm with different motion performances. Therefore, in the simulation of the Grid method, the maximum deflection angle of the UAV is set to φn max = 45∘.
In summary, for the two problems of the Grid method in the path optimization problem of uniform heterogeneous UAV swarm, in this research, the above solutions are used to control variables for more objective algorithm performance analysis and comparison. The simulation analysis is given below.
Before the path optimization simulation of the UAV swarm collaborative search mission, the random motion trajectories of targets 5–8 are generated according to Equation (26) and Table 1. Then, the motion trajectory of each target is randomly sampled E times to obtain the prior information of the Ic type target. The 2000 times random motion tracks of targets 5–8 are shown in Figure 8(a), and the E times sampling prior coordinates of targets 5–8 are shown in Figure 8(b).
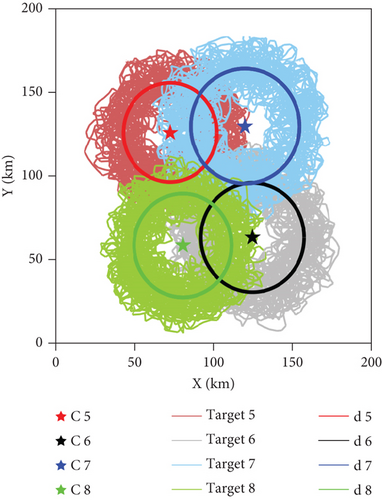
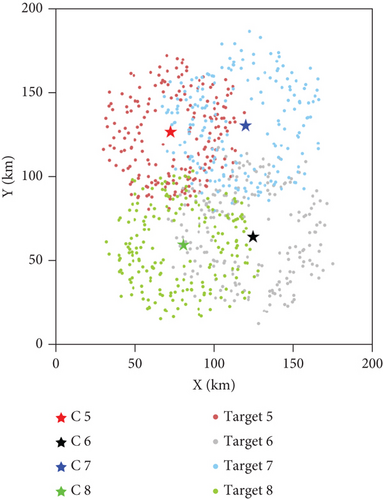
As shown in Figure 8(a), the star represents the position of Ci, which is the center of the random motion trajectories of the dynamic target. With Ci as center and di as radius, the bold dark circle represents the reference range of the random movement of the dynamic target. The light-colored lines represent the random trajectory of the dynamic targets. It can be seen from Figure 8(a) that the dynamic target moves randomly around a circle with Ci as the center and di as the radius. As shown in Figure 8(b), the star represents the position of Ci, and the points represent the target positions sampled from the random motion trajectories of the dynamic targets.
Using Equations (11)–(15) to process the target data in Table 1, as shown in Figure 8(b), the generated TPM matrix image is shown in Figure 9, where Figure 9(a) is a three-dimensional image and Figure 9(b) is a two-dimensional image. Figure 9 reflects the target distribution probability in the mission area obtained from prior information. The TPM matrix initialization information is substituted into each algorithm for the UAV swarm path optimization simulation.
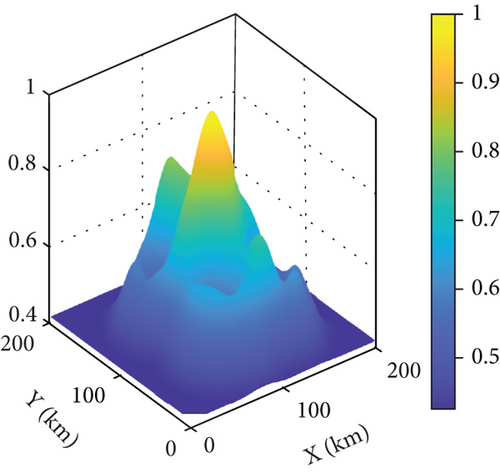
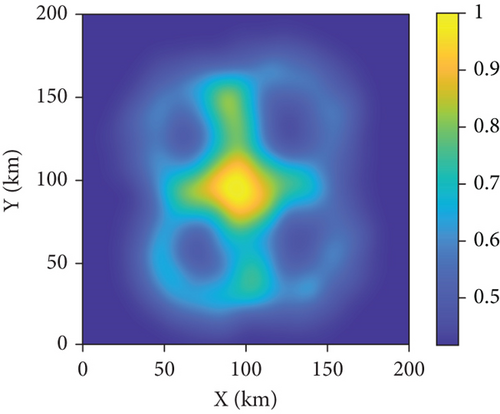
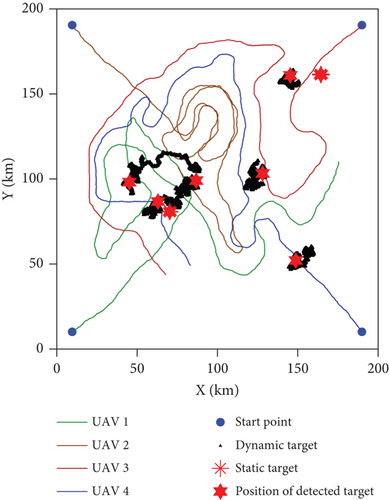
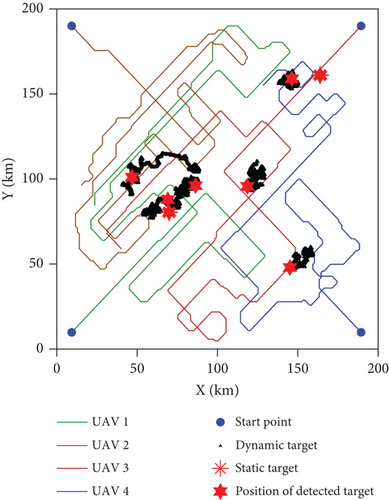
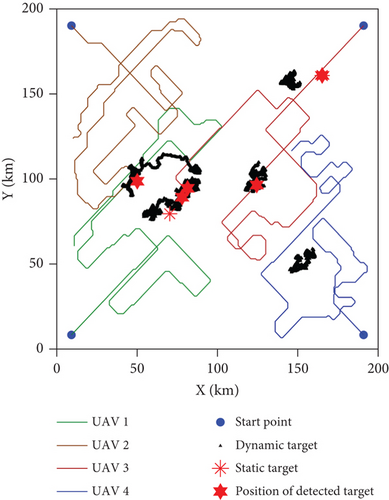
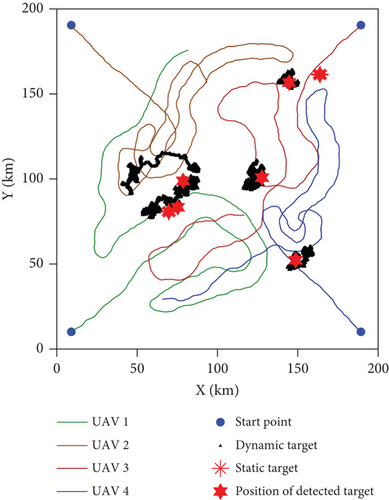
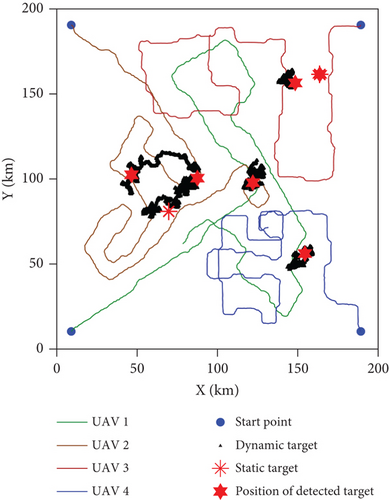
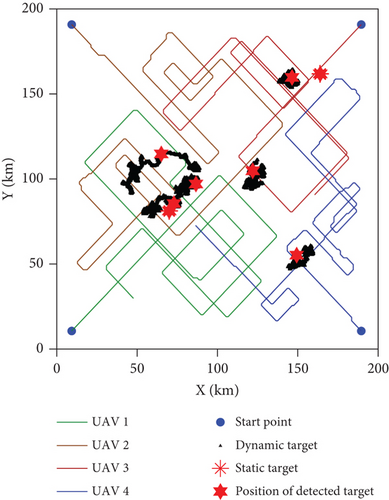
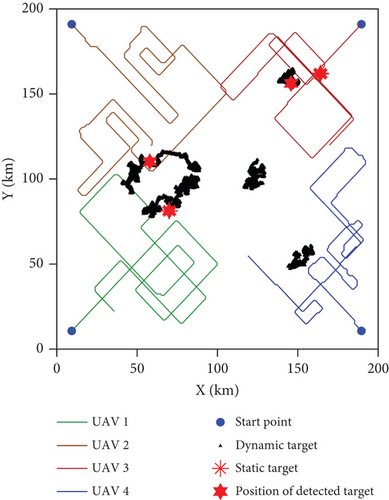
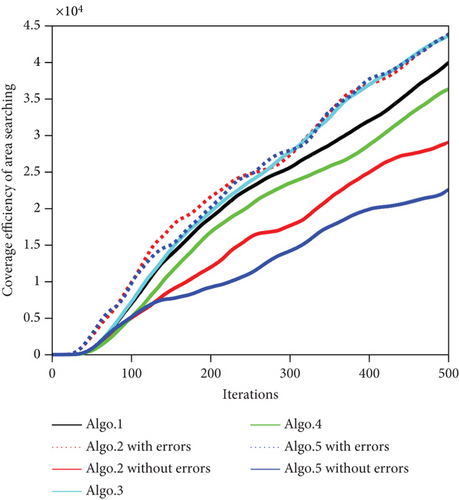
The paths of the UAV swarm after 500 iterations obtained in the five experiments of Algo. 1–Algo. 5 are shown in Figures 10–14. The black triangle in the figure represents the target, the red hexagon star represents the detected target, and the blue dot represents the take-off position of the UAV. Figure 15 shows the comparison of the number of detected targets between five algorithms. Figure 16 shows the comparison of the coverage efficiency of area searching between the five algorithms.
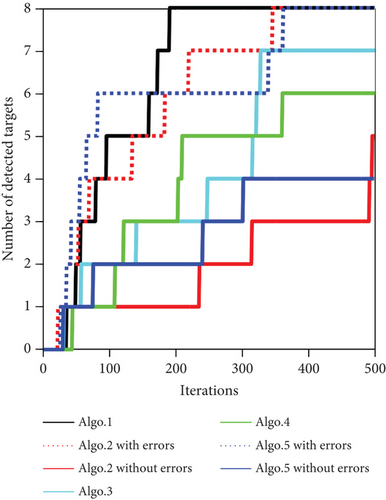
As shown in Figure 15, the number of detected targets is increased with iterations and the number of Algo. 1 first reaches eight. As shown in Equation (2), the UAV has a certain probability of detecting a target during searching the mission area. Use the Russian roulette method to determine whether a target has been detected. With iterations, if a target has been detected, then the detected target stops moving and the number of detected targets increases 1.
As shown in Figure 16, the coverage efficiency of area searching increases with iterations. To improve the searching and detecting efficiency for dynamic targets, three area searching map models including environment search map, environment pheromone map, and TPM have been established in the research of this paper. Therefore, the coverage efficiency of the area searching, in Figure 16, is calculated by the collaborative search mission optimization model as shown in Equation (19). In addition, Figure 16 shows that the coverage efficiency of Algo. 3 is higher than that of Algo. 1 due to the constant increment used in Algo. 3, which would increase the value of the environment pheromone fast. This problem is analyzed in detail in the following sections, as shown in Figure 17. Therefore, Algo. 3 should not participate in coverage efficiency comparison. Similarly, Algo. 2 (with errors) and Algo. 5 (with errors) should not participate in comparison, too. In conclusion, as shown in Figure 16, the coverage efficiency of Algo. 1 is higher than the other three algorithms and this conclusion is the same as that shown in Figure 15.
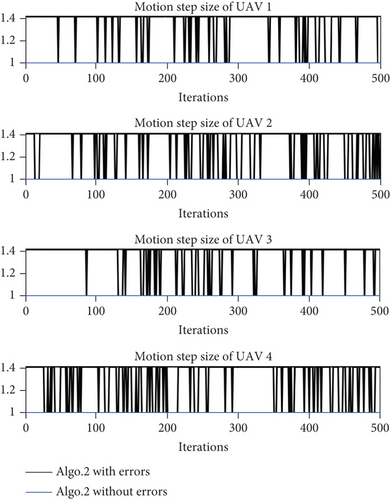
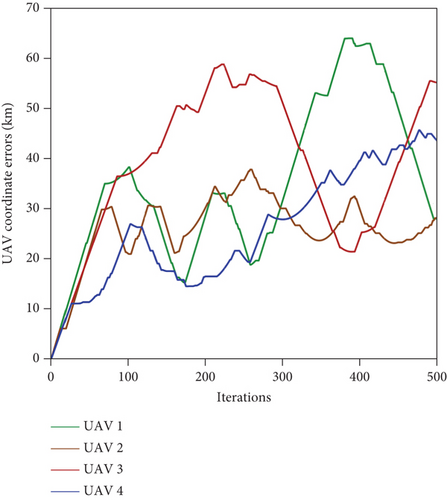
It can be seen from the UAV swarm path shown in Figures 11 and 14 that the Grid method has path errors in Algo. 2 and Algo. 5, which increases with the iteration of the algorithm. Taking Algo. 2 as an example, the variation curve of the error of Algo. 2 with the iteration of the algorithm is described in Figure 18. Figure 18(a) shows the variation curve of the motion step sizes of the UAVs in Algo. 2 (with errors) with the iteration of the algorithm, and Figure 18(b) shows the variation curve of the coordinate error of each UAV of Algo. 2 with the iteration of the algorithm. The UAV coordinate error refers to the Euclidean distance between the UAV coordinate (with errors) shown in Figure 11(a) and the UAV coordinate (without errors) shown in Figure 11(b). The variable step size of the UAV, which is contrary to the assumed conditions, leads to an error between the actual coordinates and the expected coordinates, which can reach up to 61.69 km.
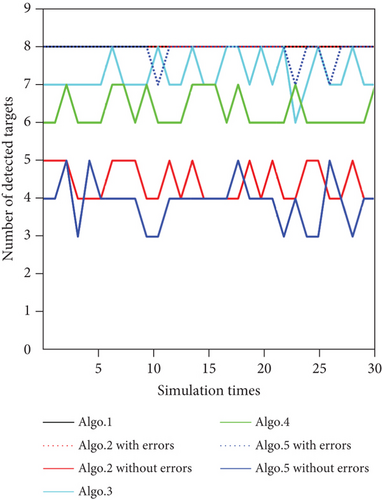
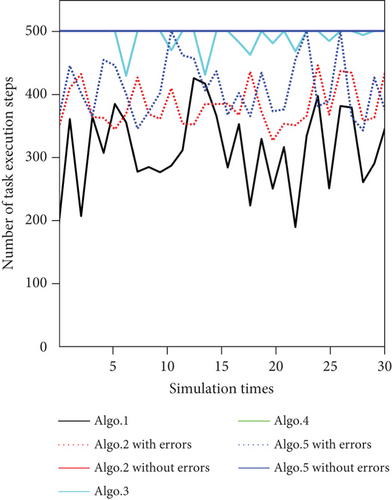
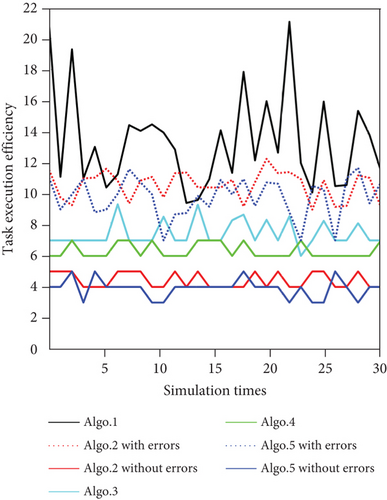
It can be seen from Figure 15 that the number of targets detected by Algo. 2 (with errors) and Algo. 5 (with errors) is eight, but those of Algo. 2 (without errors) and Algo. 5 (without errors) are five and four, respectively. The number of errors for the detected target is three and four. The 30 simulation results displayed in Figure 19 show that the use of the Grid method leads to large errors in path generation and target detection. Therefore, in the next simulation and analysis, Algo. 2 (with errors) and Algo. 5 (with errors) are only used as reference data rather than as a basis for algorithm performance evaluation. Henceforward, when referring to Algo. 2 or Algo. 5, the terms refer to Algo. 2 (without errors) and Algo. 5 (without errors).
According to the target distribution probability diagram shown in Figure 9 and the path optimization results of each algorithm shown in Figures 10–14, the differences and advantages between Algo. 1 and Algo. 2–Algo. 5 are compared and analyzed as follows. In the following, the generated path by Algo. x is abbreviated as Path x.
It can be seen from Figure 10 that Path 1 has the characteristics of cluster linkage, regular cruising, and a smooth trajectory. In addition, the UAV swarm focuses on searching areas with a high probability of target existence. In line with expectations, Path 1 detects all the targets.
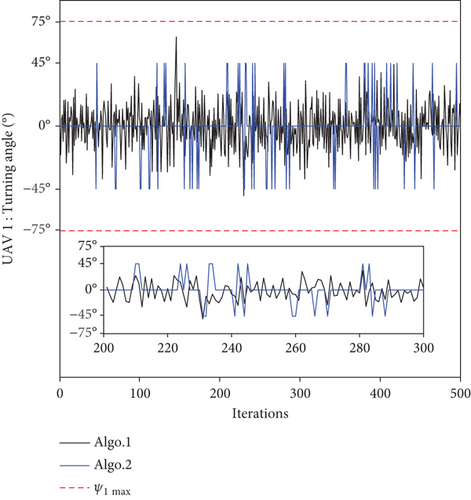
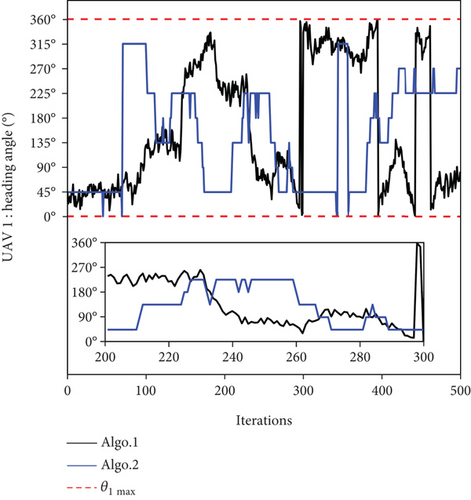
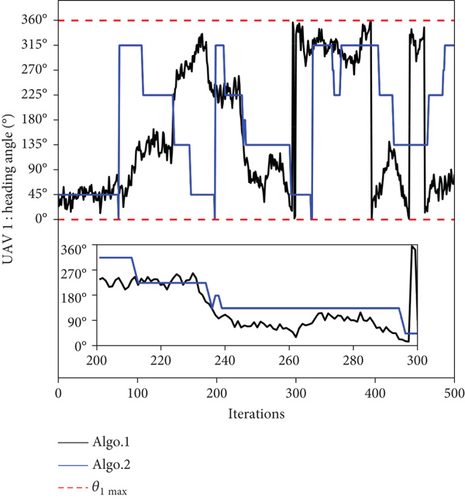
It can be seen from Figure 11(b) that Path 2 is more convoluted and not smooth enough. It does not give full play to the high mobility of UAVs and cannot give full play to the search performance of the heterogeneous UAV swarm. Taking UAV 1 as an example, the motion states of the Algo. 1 and Algo. 2 UAVs are compared in Figure 20. Figure 20(a) shows the change curve of the UAV turning angle with the algorithm iteration, and Figure 20(b) shows the change curve of the UAV heading angle with the algorithm iteration. Taking the period k ∈ [200, 300] as an example, two subgraphs are added to Figures 20(a) and 20(b) to observe the change in the UAV motion state. It can be seen from Figure 20 that due to the limitations of the solution space in the Grid method, the motion state of the UAV in Path 2 is discrete, and the frequency of the oblique motion of the UAV is higher. The oblique motion refers to the motion with a 45° angle between the motion direction and the x-axis or y-axis. The motion step of the oblique motion is longer and the search income is higher. It can be seen from Figure 15 that Path 2 only detects five targets due to the error caused by the Grid method and the limitations of the discrete motion state.
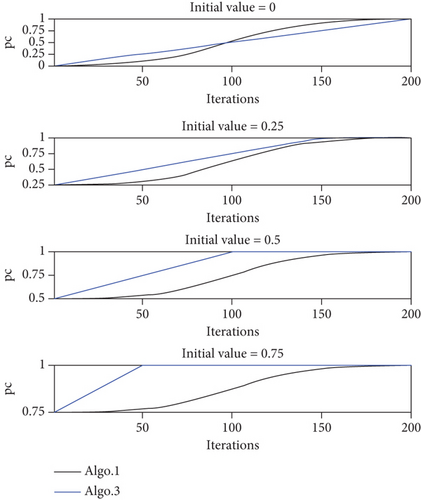
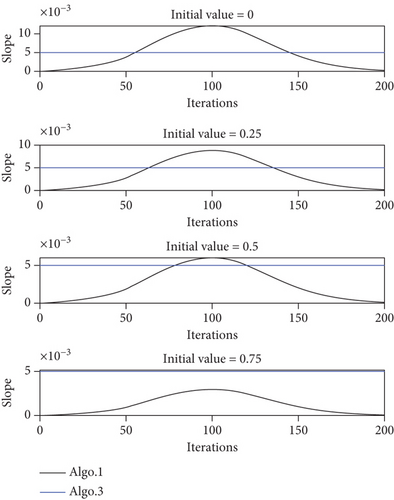
It can be seen from Figures 12 and 15 that the cooperative search efficiency of each UAV in Path 3 is lower than in Path 1, and seven targets are detected in Path 3. The pheromone update mechanisms of Algo. 1 and Algo. 3 are compared in Figure 17, where Figure 17(a) represents the pheromone concentration growth curve with different initial values and Figure 17(b) represents the pheromone concentration growth slope curve with different initial values of the pheromone concentration. It can be seen from Figure 17 that the pheromone update mechanism of Algo. 1 based on Equation (10) can adjust the slope of pheromone concentration according to different initial values of the pheromone concentration. However, when the grid in Path 3 is searched, the growth rate of the pheromone concentration based on the constant increment method is faster and independent of the initial value of the pheromone concentration. Therefore, in Path 3, each UAV conducts a patrol search in its adjacent area, which causes Path 3 to not fully cover the mission area with a high probability of target existence.
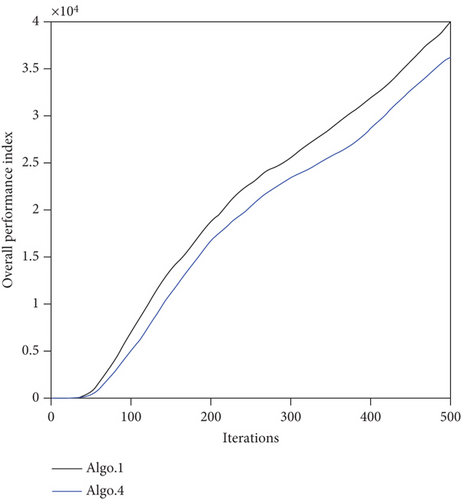
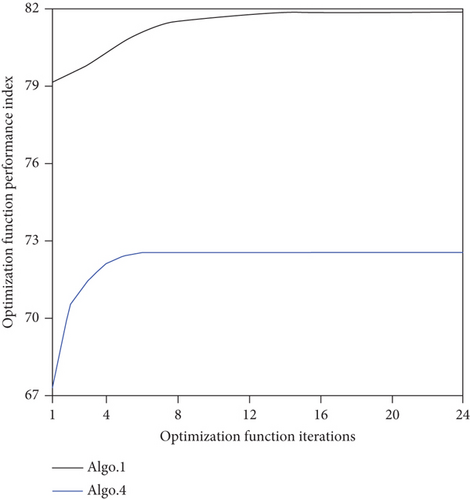
It can be seen from Figures 13 and 15 that the path continuity of Path 4 is lower than that in Path 1, and only six targets are detected in Path 4. The optimization function performance of Algo. 1 and Algo. 4 is compared in Figure 21. Figure 21(a) shows the curve of the overall performance index of the UAV swarm with the iteration of the algorithm, and Figure 21(b) shows the average convergence curve of the optimization function performance index during the search mission. It can be seen from Figure 21 that the mean value of the optimization performance index of the PSO-RHC algorithm converges to 81.87, while that of the traditional PSO algorithm is 72.55, which is an increase of 12.8%. The comparison of the simulation results shows that the PSO-RHC algorithm can jump out of the local optimum and consider the path optimization of longer distances, thereby generating a better cooperative search path for the UAV swarm.
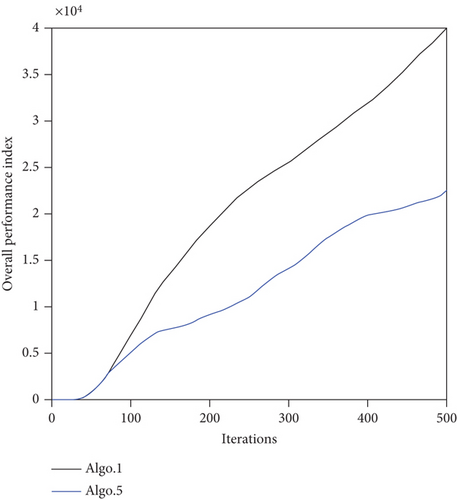
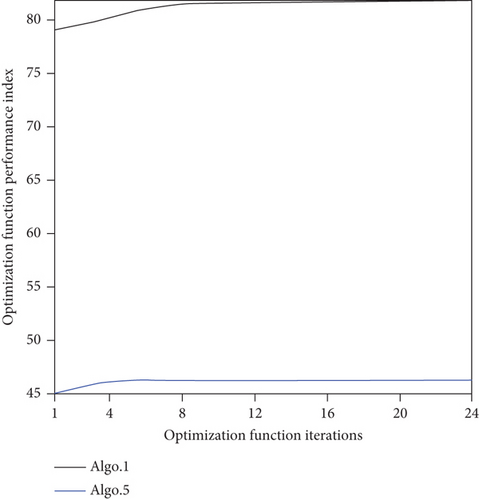
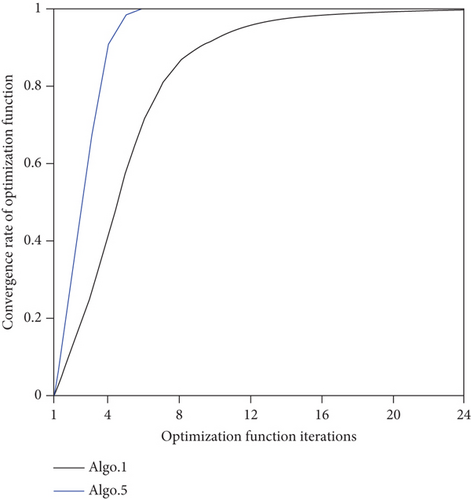
As shown in Table 5, Algo. 5 is composed of three other algorithm modules. It can be seen from Figure 14 that the path of Path 5 is convoluted, the cooperative search efficiency of each UAV is lower than that in Path 1, and the UAVs are more inclined to oblique motion, which combines the shortcomings of Paths 2–4. The performances of the Algo. 1 and Algo. 5 algorithms are compared in Figure 22. Taking UAV 1 as an example, Figure 22(a) shows the change curve of the UAV heading angle with the algorithm iteration, and Figure 22(a) shows the detailed change of period k ∈ [200, 300]. Figure 22(b) shows the change curve of the overall performance index of the UAV swarm with the algorithm iteration. Figure 22(c) shows the average convergence curve during the search mission. Figure 22(d) shows the average convergence rate curve of the optimization function during the search mission. It can be seen from Figures 22(b) and 22(c) that the overall performance index of Path 1 is better than that of Path 5, and the index increases by 77.5%. It can be seen from Figure 22(d) that the convergence rate of the optimization function of Algo. 5 reaches 100% at the 6th iteration, while the convergence rate of the optimization function of Algo. 1 reaches 92% at the 10th iteration and 97.3% at the 14th iteration. It can be seen from Figure 15 that the worst path in the five paths optimized by five algorithms is Path 5, in which only four targets have been detected. The above simulation results show that Algo. 1 has fully improved the mission planning scheme based on the three aspects of the decision input solution model, pheromone update mechanism, and optimization algorithm. Moreover, the additional computational complexity caused by the increase of the solution space is within the acceptable range.
4.2.2. Task Execution Efficiency Analysis
The five algorithms are simulated with Monte Carlo simulation 30 times, and the number of iterations of each algorithm is 500. The comparison of the five algorithms based on three metrics is shown in Figure 19.
Figure 19(a) is the line graph of Metric 1, the number of target detections. It can be seen from the graph that the simulation results of Algo. 1 are the best, and all the target detection tasks are completed in 30 simulations. However, the simulation results of the other algorithms are relatively poor. Most of the simulation results cannot complete the detection task of all targets. The worst simulation results only detect three targets by eliminating the error of Algo. 5.
Figure 19(b) is a line chart of Metric 2, the number of task execution steps, which refers to the number of iterations of the algorithm when completing the detection task of all eight targets, but if the task is not completed when the algorithm is iterated 500 times, the corresponding value of Metric 2 is 500. As can be seen from Figure 21(b), Algo. 1 has the best simulation results. All 30 simulations complete the task before the algorithm iterates 500 times. The best simulation results only use 189 steps; that is, when the algorithm has iterated 189 times, all eight targets have been detected. However, most of the simulation results of the other algorithms fail to complete the task before the algorithm iterates 500 times. The best simulation result uses 429 steps with Algo. 3, that is, the algorithm completes the task with 429 iterations.
The three metrics of the five algorithms in 30 simulations, as shown in Figure 19, are averaged to compare the performance of each algorithm. The results are shown in Table 6.
| Algorithm label | Average value of Metric 1 | Average value of Metric 2 | Average value of Metric 3 |
|---|---|---|---|
| Algo. 1 | 8 | 313.50 | 12.76 |
| Algo. 2 (with errors) | 8 | 382.23 | 10.46 |
| Algo. 2 (without errors) | 4.43 | 500 | 4.43 |
| Algo. 3 | 7.26 | 489.98 | 7.42 |
| Algo. 4 | 6.33 | 500 | 6.33 |
| Algo. 5 (with errors) | 7.90 | 409.97 | 9.63 |
| Algo. 5 (without errors) | 3.90 | 500 | 3.90 |
It can be seen from Table 6 that the performance of Algo. 1 is the best, followed by the performances of Algo. 3 and Algo. 4, and the performances of Algo. 2 and Algo. 5 are poor. By comparing the average value of Metric 3 of Algo. 1 and the other algorithms, the improvement of this research can be evaluated based on four aspects: the decision input solution model, pheromone update mechanism, optimization solution algorithm, and overall optimization, as shown in Table 7:
| Mission planning scheme modules | Performance improvement degree | Algorithm comparison |
|---|---|---|
| Decision input solution model | 188% | Algo. 1 and Algo. 2 |
| Pheromone update mechanism | 72% | Algo. 1 and Algo. 3 |
| Optimization algorithm | 102% | Algo. 1 and Algo. 4 |
| Entire scheme | 227% | Algo. 1 and Algo. 5 |
As shown in Tables 5–7, the conclusions can be drawn as follows. The simulation results show that under the assumed task conditions in this research, the method proposed in this paper improves the mission planning scheme based on the three aspects of the decision input solution model, pheromone update mechanism, and optimization solution algorithm, which are improved by 188%, 72%, and 102%, respectively. The overall performance is improved by 227% compared with other methods.
5. Conclusion
To solve the problem of cooperative search task planning for a heterogeneous UAV swarm for dynamic targets, this paper proposes an improved cooperative search mission planning algorithm for a heterogeneous UAV swarm. Heterogeneous UAV maneuverability constraints and detection performance constraints, as well as three target types that distinguish the motion and time sensitivity of known partial motion state information, are considered in this problem.
First, based on the polar coordinate motion method, an improved UAV motion model and decision input solution model are established. Therefore, the high mobility performance of each UAV can be fully released in the path optimization under the condition of heterogeneous performance in the UAV swarm. Then, a dynamically updated multisearch situation map model is established, including the environment search map, environment pheromone map, and TPM. The numerical update algorithm based on normal distribution integral is used to update the pheromone concentration in the environmental pheromone map. The multisearch situation graph model improves the search performance of UAVs and the task information sharing performance among UAVs in the UAV swarm. Finally, an improved path optimization algorithm PSO-RHC is designed. Based on the traditional PSO algorithm, the RHC method is used to improve the global optimization performance. Compared with the traditional heuristic algorithm, the UAV swarm path obtained with the PSO-RHC algorithm is smoother and the optimization performance index is higher. In addition, by using the optimal solution rolling mechanism, the convergence speed of the PSO-RHC algorithm is effectively improved in order to solve the problem of slow convergence speed caused by the increase of the solution space. Therefore, the heterogeneous UAV swarm can achieve efficient collaborative task execution for the assumed task conditions in this study.
To study the efficiency of task execution and optimize the performance of the algorithm, several simulations are carried out. The simulation results show that under the assumed task conditions in this study, the method proposed in this paper improves the mission planning scheme based on three aspects: the decision input solution model, pheromone update mechanism, and optimization solution algorithm for the cooperative search task planning problem of a heterogeneous UAV swarm with dynamic targets, with improvements of 188%, 72%, and 102%, respectively.
However, in the collaborative search path optimization problem in this study, the obstacle avoidance and collision avoidance of UAVs and the dynamics of the actual mission area are not fully considered. Therefore, the environmental modeling of the dynamic mission area (such as the dynamic wind field and obstacles) is more in line with the actual task scenario, which still needs to be studied in future work.
Conflicts of Interest
The authors declare no conflicts of interest.
Funding
This work was supported in part by the National Natural Science Foundation of China under Grant No. 42201472 and No. 62101599.
Open Research
Data Availability Statement
The data used in this study have been mainly obtained in the simulation experiments.


