Assessing Peak Load Reduction Potential on Distribution Network: A Case Study of Residential Households in Freetown, Sierra Leone
Abstract
Sierra Leone struggles with electricity with a 38% electrification rate. The expanding distribution network with limited generation capacity leads to frequent power outages during peak hours. Demand response (DR), a widely recognized demand-side management strategy, has effectively balanced the electricity supply and generation worldwide. The primary objective of this study is to assess the potential for DR in the residential electricity sector, focusing on drivers such as security, environmental concerns, and incentives. The case study was conducted in Freetown, Sierra Leone. This study employs diversified demand modeling with household energy audit data to estimate the potential reduction in peak load achievable through voluntary demand response (VDR). This study generated load profiles for 12 household appliances and an aggregated load profile for the Freetown distribution network. Notably, the study achieved a substantial peak load reduction of 4.19 and 3.54 MW during the morning and evening peak hours, respectively. Additionally, this research highlights the significant roles of power security, price incentives, and environmental factors in encouraging residential consumers in Sierra Leone to participate in DR programs. This study underscores the response’s role in Sierra Leone’s electricity challenges, providing insights into peak load reduction and the motivation for residential consumer participation in DR programs.
1. Introduction
The escalating global demand for electricity, particularly in developing countries, necessitates an understanding of power consumption patterns and the adoption of strategies to manage peak demand. According to International Energy Agency [1] statistics, the world is expected to experience an annual growth rate of 2.1% in power demand until 2040, with even more rapid growth projected in African countries, ranging from 4.5% to 8.5% [1]. However, several nations must maintain a reliable electricity supply, particularly when facing persistent power outages [2].
Grid stability, a fundamental requirement for a well-functioning power system, relies on aligning the electricity demand with the supply [3]. Utility providers traditionally focus on addressing peak demand, which is defined as the period of maximum concurrent electricity consumption by consumers [4]. Peak demand imposes a substantial burden on both utility operators and generation resources. Therefore, to meet demand, utilities often activate high-cost “peaking plants” that rely on expensive fuels and emit higher carbon dioxide levels.
Utility providers employ supply-side management (SSM) strategies to manage unpredictable demand and grid stability, including capacity expansion, power plant optimization, and enhanced transmission infrastructure [5]. Demand-side management (DSM) has emerged as an efficient short-term alternative to SSM, focusing on reshaping load patterns and optimizing grid performance [6]. DSM encompasses load adjustment, peak demand reduction, energy conservation, and the integration of renewable energy sources, offering various benefits such as cost savings, enhanced grid reliability, reduced greenhouse gas emissions, deferred infrastructure investments, and increased renewable energy utilization [6].
DSM initiatives encompass load control, electrification, targeted conservation, novel applications, and market price adjustments. Notably, energy efficiency (EE), spinning reserves, and demand response (DR) are gaining significant attention within the realm of DSM because of their shorter implementation timelines, cost-effectiveness, effectiveness in reducing peak load, and mutual benefits for consumers and grid operators [7]. Implementing effective DSM programs is pivotal for mitigating peak electricity demand, enhancing grid stability, and achieving sustainable and efficient energy management.
The residential sector in Sierra Leone faces a multifaceted challenge concerning access to electricity, reliability, and disparities in electrification rates across regions. Sierra Leone, a West African nation with a GDP ranging from four to ten billion United States dollars and a land size of 71,740 km2, is experiencing an acute energy crisis, and despite its vast potential, only approximately 20% of the population has access to electricity [8]. This limited access is compounded by an inadequate electricity generation capacity of 116 MW, which serves a population of 7,533,567 [8]. The residential sector is one of the largest electricity consumers in the country and is steadily growing compared with other sectors in Freetown. In recent years, there has been massive rehabilitation and expansion of the distribution grid in Freetown. The expansion of the distribution network increased the number of residential communities that were initially not connected to the grid. Although this seems to be a milestone, it also poses a substantial burden on generations, which, in the case of Freetown and across the country, is underdeveloped. The existing generation capacity falls significantly short of meeting the current and growing electricity demand, resulting in persistent power outages and an unreliable grid infrastructure.
To address this pressing issue and enhance electricity accessibility, the Sierra Leone government has developed an ambitious energy development plan targeting a 60% increase in power generation by 2023 [9]. This government’s agenda aligns with the United Nations’ Sustainable Development Goal 7, which aims to ensure access to affordable, reliable, sustainable, and modern energy. Although Freetown, the capital city, has a relatively high electrification rate of approximately 82%, not all of these consumers are fed simultaneously because of its low generation capacity, cable capacity restrictions, and network expansion to new residential communities, which has increased the demand for electricity by residential consumers. This stark disparity in access to electricity exacerbates the challenges faced by residents, hindering economic progress, impacting food production and preservation, limiting access to quality healthcare services, and affecting the quality of education. These challenges directly contradict several of the United Nations’ Sustainable Development Goals, including SDG 1 (no poverty), SDG 2 (zero hunger), SDG 3 (good health and well-being), and SDG 4 (quality education). To mitigate this issue effectively, given the cost and complexity of infrastructure upgrades, it is imperative to leverage the existing capacity and implement load management techniques, particularly DR, to address peak load requirements and enhance the reliable supply of electricity in Sierra Leone’s residential sector. DSM can offer a comprehensive approach to addressing many of the electricity issues faced by the residential sector in Sierra Leone. By optimizing energy use, reducing peak demand, improving grid reliability, and promoting EE, the DSM can contribute to a more sustainable, reliable, and accessible electricity supply for residential consumers in the country.
In DSM studies, it is evident that, although several investigations have been undertaken, there is a notable gap in the literature concerning DR concerning peak load reduction within Freetown’s distribution network in Sierra Leone. Existing research, exemplified by the study conducted by Conteh et al. [8], predominantly emphasizes incentive-based DR strategies and the integration of solar photovoltaics as mechanisms to achieve reductions in peak loads. While incentive-based DR mechanisms hold promise in motivating consumers to shift or curtail their energy consumption, their sustainability in developing countries, characterized by economic instability and dependence on independent power producers, primarily generating electricity from high marginal cost thermal plants, raises concerns. Moreover, the existing body of research, including Conteh et al. [8], needs to comprehensively examine other influential factors that may drive residential consumers in Freetown to voluntarily participate in DR initiatives. These factors encompass the energy security and environmental safety considerations.
- (1)
To assess load usage patterns in the residential consumers
- (2)
To estimate the reduction in peak load via a voluntary DR approach
- (3)
To determine the motivation drivers and willingness level for participation in the DR program
- (1)
Studies of DSM schemes in developing countries pose substantial challenges. Such studies have rarely been conducted because of the prevalent assumptions of inadequate metering infrastructure, limited access to downstream energy usage data, and constrained financial support. Nevertheless, this study not only reveals the immense potential and advantages of DR programs but also serves as an invaluable roadmap for developing nations, such as Sierra Leone, seeking to seamlessly integrate DSM policies into their energy strategies.
- (2)
Our research makes a substantial contribution by not only shedding light on the factors that support the growth of VDR but also by presenting a set of policy recommendations to create a more favorable regulatory framework for VDR initiatives. These recommendations are rooted in a thorough understanding of the practical complexities and opportunities associated with the implementation of VDR.
- (3)
This study provides concrete evidence of how voluntary demand responses (VDR) effectively reduce peak energy demand. This capability can significantly impact Agenda 2063 of the African Union, as it aligns with the optimization of current energy infrastructures to achieve sustainable electrification across Africa by integrating VDR strategies within utility management systems. Moreover, the implementation of DR has the potential to bolster industrial growth by lowering electricity expenses for businesses. This, in turn, can attract investment, stimulate economic development, and generate employment opportunities.
- (4)
This study significantly enriches the existing body of knowledge by providing comprehensive insights into the load variation and utilization factors of commonly used household appliances in Sierra Leone. The data collected through a questionnaire survey, which involved asking respondents about their appliance usage and employing straightforward approximations, filled a critical gap in the literature that previously lacked readily accessible information.
2. Method and Data
2.1. Study Area
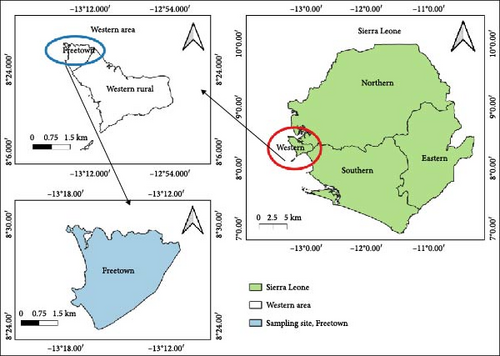
Freetown, located in the western region of Sierra Leone, is the nation’s largest port city. Spanning a total land area of 55 km2, Freetown has a population of 609,174 residents, constituting approximately 8.7% of the total population [10]. The city is divided into three distinct regions: eastern, central, and western regions. Notably, the eastern area experiences greater population density than the central area, whereas the western area registers lower congestion levels than the eastern and central areas. The central area is a business hub that hosts vital government institutions, including the State House and the House of Parliament. Freetown is a home to diverse populations of various ethnic groups. However, it is predominantly inhabited by the Krio people, who form a substantial demographic presence in the city. The city experiences two distinct seasonal variations, characterized by rainy and dry seasons, with periods of equal duration. Figure 1 provides an illustrative study profile for Freetown, offering an overview of the city’s key attributes and characteristics.
2.2. Methodology Framework
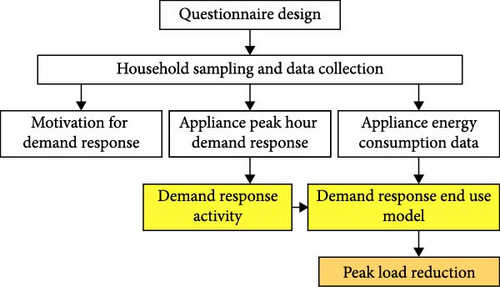
The following flowchart comprehensively depicts the sequential methodology adopted to fulfill the research objectives. An integral aspect of this research involved the meticulous design of questionnaires tailored to gather precise and relevant data, aligned with the specific inquiries addressed by the study. The selection of households for sampling and data collection constituted a fundamental step in identifying representative households within Freetown, thus facilitating the acquisition of pertinent data. Two pivotal input parameters critical for formulating the DR model are the energy consumption patterns associated with household appliances and historical data on DR activities. The motivation underpinning respondents’ voluntary engagement in DR practices constitutes another central facet of this research, serving as a key objective within the overarching thesis framework. A visual representation of this methodological approach is shown in Figure 2, affording a clear and structured overview of the procedural sequence governing data collection and analysis.
2.3. Data Collection
The number of households, N being 152,293, was estimated by dividing the population of Freetown being 609,174, with an approximated average household size of 4.0 [10], with an error margin of 5% [12].
2.3.1. Survey Design
The questionnaire design process was meticulously executed with due consideration of the research objectives and the specific target respondents. Before finalization, the questionnaire was rigorously reviewed by two supervisory faculty members to ensure content validity and reliability. The questionnaire itself was structured into two distinct sections, namely, the energy audit and DR sections, aligning with the focus of this study. The energy audit section is comprehensive and encompasses various facets of household information, building attributes, and electricity consumption patterns. The energy audit section explores household-related variables including household size, household members’ average age, income levels, and educational backgrounds. Building characteristics are also scrutinized and include parameters such as house type and number of living and bedroom spaces. Additionally, this section delves into the specifics of electricity consumption, including the types of appliances used, their respective energy consumption levels, and the daily activity patterns associated with these appliances. Conversely, the questionnaire’s DR section of the questionnaire focuses on motivations and preferences related to DR actions. It solicits information regarding respondents’ appliance preferences for participating in DR programs, the specific types of DR actions they are inclined to undertake, and their preferences concerning motivation factors, including electricity price, energy security, and environmental concerns. The distribution of the questionnaires was proportional to each area, considering their respective divisions. Specifically, the west and east encompassed three divisions, allocating 150 questionnaires to each region. In contrast, the central area, comprising of two divisions, received 100 questionnaires. Of the distributed questionnaires, 250 were completed accurately and comprehensively, constituting 62.5% of the initially disseminated surveys. These 250 completed questionnaires encapsulated a diverse cross-section of households, reflecting a spectrum of demographic, socioeconomic, and energy consumption characteristics representative of Freetown’s residential landscape. The data collection process was facilitated by collaboration with students pursuing electrical and electronics engineering degrees at the University of Sierra Leone, Fourah Bay College. The selection of these students was deliberate and driven by the alignment between the survey’s subject matter and their field of study, thus ensuring their familiarity with the survey’s technical aspects. A descriptive statistical analysis was systematically executed to provide a quantitative summary of household appliance data, providing valuable insights into the collected dataset, as shown in Table 1.
| Variables | Count | Unit | Mean | Standard dev. | Minimum | Maximum | Mode |
|---|---|---|---|---|---|---|---|
| Light | 250 | Nos. | 7.84 | 2.867 | 2 | 18 | 9 |
| Television | 215 | Nos. | 1.7 | 0.873 | 1 | 5 | 1 |
| Fan | 179 | Nos. | 1.82 | 0.838 | 1 | 6 | 2 |
| Electric iron | 196 | Nos. | 1.18 | 0.414 | 1 | 3 | 1 |
| Computer | 124 | Nos. | 2.39 | 1.131 | 1 | 5 | 2 |
| Freezer | 156 | Nos. | 1.46 | 0.646 | 1 | 4 | 1 |
| Refrigerator | 93 | Nos. | 1.4 | 0.61 | 1 | 4 | 1 |
| Washing machine | 57 | Nos. | 1.23 | 0.423 | 1 | 2 | 1 |
| Air condition | 77 | Nos. | 2.39 | 1.289 | 1 | 8 | 2 |
| Microwave | 85 | Nos. | 1.13 | 0.338 | 1 | 2 | 1 |
| Water heater | 141 | Nos. | 1.18 | 0.441 | 1 | 4 | 1 |
| Rice cooker | 79 | Nos. | 1.08 | 0.267 | 1 | 2 | 1 |
| Household size | 250 | Persons | 5.65 | 2.796 | 1 | 20 | 6 |
2.4. DR Model
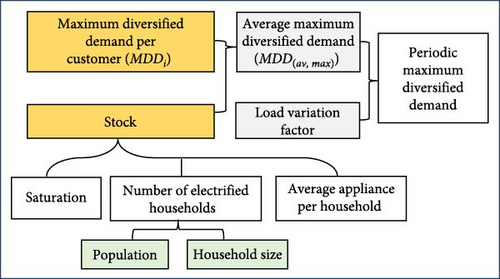
This approach, commonly called the end-use model, adopts a bottom-up methodology initially pioneered by Gönen in 1940 [13]. It aims to estimate residential load profiles, particularly in cases where actual data are scarce or unavailable, as highlighted by Diawuo et al. [14]. This model relies on conducting energy audits within households to project peak load reductions resulting from DR initiatives. The strategy is grounded in the consumption patterns of various household appliances, recognizing that homes typically do not simultaneously use all the electrical equipment within their systems. These factors affect the diversity of similar loads and the noncoincidence of peak demand periods among different load types. This method is prized for its effectiveness and precision in modeling residential DR, offering a meticulous breakdown of the electrical load on a component-by-component basis. Under the diversified demand method, a load curve encompassing the entire residential customer class can be devised if a specific location can statistically represent a broader residential customer base. This streamlined approach leverages statistical correlations to scrutinize appliance behavior across a group of residential customers. By considering a representative location for the entire customer base, a load curve can be constructed, accommodating the reality that households typically do not operate all their electrical appliances simultaneously or at maximum capacity. The development of such a load curve depends on accurate load saturation and demand diversity data. A flowchart of the modified model is shown in Figure 3.
2.4.1. Maximum Diversified Demand
2.4.2. Periodic Maximum Power Demand (PMPD)
The hourly variation factor αt reveals appliance usage behavior features and depends on the living habits of persons in a specific location. These habits are influenced by socioeconomic factors such as the number of people in different families, age, and income [15].
2.4.3. Achievable Demand Reduction (ADR)
2.4.4. Emission Savings (ES)
2.5. Model Implementation
The model was analyzed using an Excel spreadsheet. The steps followed the sequential equations presented in Section 2.4.
2.5.1. Maximum Diversified Demand
The maximum diversified demand for an appliance per customer, MDDi, and the average maximum diversified demand for a group of customers were estimated using Equations (2) and (3). The sum of the individual appliances used to determine MDD was estimated by multiplying the total power rating of an appliance type by its utilization factor. The appliance utilization factor is the ratio of the number of operating hours of an appliance in a day to the total hours in a day. This factor helps determine the demand contribution of individual appliances. This was determined by asking respondents the duration of use of their appliances and making an assumption of the operating hours based on the responses received from the survey. Table 2 shows the respective parameters used to determine the value of MDDi for each appliance type. The stock is defined by Equation (4), which is the product of appliance saturation (Si), average appliance per household (AAi), and the number of households in Freetown (HHi). The number of electrified households (HHF) is the product of the population, household size of Freetown, and electrification rate in Freetown. The data used for both population and household size were extracted from the midterm census 2021 report [10]. The saturation rates for each appliance were secured from the research survey conducted, since national data are not readily available. The estimated number of households was multiplied by an assumed electricity rate (β) of 75% for Freetown. This assumption considers both households that are connected to the grid but are on a power supply rotation schedule, and 25% of the households are not connected to the grid. The value for HHF derived after considering a 75% access rate was 114,220.
| Appliance | Saturation (Si) | Average appliance per household | Sum of maximum power demand (kW) |
Stock (δi) | MDDi (kW) |
MDD(av,max) (MW) |
|---|---|---|---|---|---|---|
| Light | 1.00 | 7.84 | 6.58 | 895,939.72 | 0.026 | 23.60 |
| Television | 0.86 | 1.46 | 3.93 | 143,807.23 | 0.016 | 2.26 |
| Electric fan | 0.72 | 1.30 | 0.65 | 106,315.74 | 0.003 | 0.28 |
| Electric iron | 0.78 | 0.93 | 5.31 | 83,100.81 | 0.021 | 1.77 |
| Computer | 0.50 | 1.18 | 0.73 | 67,077.15 | 0.003 | 0.20 |
| Freezer | 0.62 | 0.91 | 13.23 | 64,716.00 | 0.054 | 3.43 |
| Refrigerator | 0.37 | 0.52 | 10.93 | 22,094.67 | 0.044 | 0.97 |
| Washing machine | 0.23 | 0.28 | 2.63 | 7,291.79 | 0.011 | 0.08 |
| Air condition | 0.31 | 0.74 | 24.74 | 25,892.25 | 0.099 | 2.56 |
| Microwave | 0.34 | 0.38 | 1.64 | 14,912.53 | 0.007 | 0.10 |
| Water heater | 0.56 | 0.67 | 3.44 | 43,032.52 | 0.014 | 0.59 |
| Rice cooker | 0.32 | 0.34 | 0.85 | 12,271.77 | 0.003 | 0.04 |
2.5.2. Load Variation Factor (LVF)
The LVF is a metric that characterizes the fluctuations in the load demand over each hour during a typical day. This factor plays a pivotal role in shaping the load curve, which is crucial for understanding electricity consumption patterns. In the context of this study, the computation of the LVF was conducted by soliciting responses from survey participants, who were tasked with specifying their appliance usage patterns across a 24-hr timeframe. The LVF calculation process involved aggregating households that reported the utilization of a given appliance during each hour of the day. This aggregated figure is then expressed as a percentage of the total number of households possessing the respective appliances. Consequently, the corresponding LVF value was determined every hour of the day. Subsequently, these LVF values were used with the average maximum diversified demand (MDD (av,max)), as detailed in Equation (3) in Subsection 2.4.1. The product of the LVF and MDD provided the basis for deriving the periodic maximum load demand.
2.5.3. Achievable Demand Reduction (ADR)
The weight values attached to the three indicators based on the order of the highest likelihood that an appliance is in use during the peak hour were 0.33, 0.66, and 1. Tables 3 and 4 show the estimated values of DRAP for both evening and morning peak loads.
| Appliance | Appliance for DR participation | Seldom | Sometimes | Often | Likelihood of usage (%) | DR at evening peak hour (%) | Demand response appliance participation (%) |
|---|---|---|---|---|---|---|---|
| Electric fan | 100 | 7 | 70 | 23 | 72 | 48 | 34 |
| Electric iron | 115 | 17 | 34 | 64 | 80 | 61 | 49 |
| Freezer | 125 | 0 | 29 | 96 | 92 | 68 | 62 |
| Refrigerator | 81 | 1 | 17 | 63 | 92 | 72 | 66 |
| Washing machine | 18 | 3 | 14 | 1 | 62 | 78 | 49 |
| Air condition | 79 | 2 | 27 | 50 | 87 | 62 | 54 |
| Microwave | 43 | 3 | 27 | 13 | 74 | 61 | 45 |
| Water heater | 94 | 9 | 44 | 41 | 78 | 63 | 49 |
| Rice cooker | 28 | 7 | 21 | 0 | 58 | 52 | 30 |
| Appliance | Appliance for DR participation | Seldom | Sometimes | Often | Likelihood of usage (%) | DR at evening peak hour (%) | Demand response appliance participation (%) |
|---|---|---|---|---|---|---|---|
| Electric fan | 71 | 4 | 33 | 34 | 80 | 30 | 24 |
| Electric iron | 55 | 25 | 28 | 2 | 52 | 70 | 36 |
| Freezer | 109 | 1 | 35 | 73 | 88 | 63 | 56 |
| Refrigerator | 63 | 0 | 12 | 51 | 94 | 63 | 59 |
| Washing machine | 13 | 5 | 8 | 0 | 53 | 93 | 50 |
| Air Condition | 70 | 7 | 22 | 41 | 83 | 46 | 38 |
| Microwave | 57 | 9 | 29 | 19 | 72 | 84 | 60 |
| Water heater | 81 | 18 | 49 | 14 | 65 | 75 | 48 |
| Rice cooker | 46 | 12 | 24 | 10 | 65 | 75 | 49 |
2.5.4. Emission Savings (ES)
The EF used to estimate the CO2 ES was obtained from the International Renewable Energy Agency statistic team’s published data on the energy and emission situation in Sierra Leone. The EF published and used in this study for Sierra Leone is 514 tCO2/GWh for 2021[16].
2.6. DR Motivation
| Motivation level | 1 | 2 | 3 | 4 | 5 |
|---|---|---|---|---|---|
| Value | Value | Value | Value | Value | |
| Incentive | 22 | 18 | 30 | 25 | 155 |
| Power stability | 10 | 14 | 19 | 44 | 163 |
| Environmental safety | 11 | 37 | 71 | 49 | 82 |
3. Results and Discussion
This section analyzes the results obtained from the energy audit survey and DR model. The analysis was partitioned into several subheadings based on the specific objectives set for this study. The results relating to objectives one, two, and three are discussed in Subsections 3.1, 3.2, and 3.3, respectively. In Subsection 3.4, the policy implications of the DR for policymakers in Sierra Leone are discussed.
3.1. Assessing Load Variation in Residential Sectors
The first objective of this study was to assess the load variation in the residential sector. Therefore, the utilization factor of different appliances was determined to achieve this and the LVF.
3.1.1. Utilization Factor
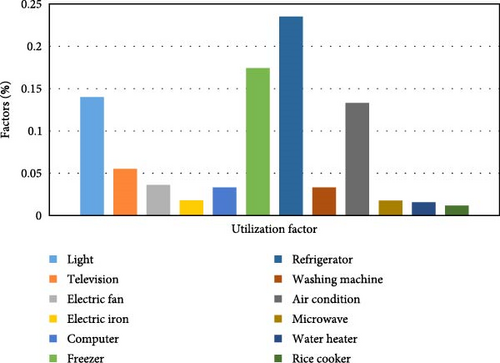
As shown in Figure 4, air conditioning has a utilization factor of 13%, indicating that 13% of the day, a residential customer will run this load. Refrigerators and freezers both have a utilization factor of 24%, also indicating that 17% of the day these loads are in use. This value depicts the maximum use of refrigerators in households as it has the highest utilization factor. Additionally, it was observed that most residential homes either have a freezer or refrigerator as an appliance for cooling and preserving food. It is also noticeable that refrigerators are 11% more in use in the residential sector in Freetown than air conditioners. The variation among the air condition, freezer, and the refrigerator indicates the variability in their load demand. Microwaves, water heaters, rice cookers, and electric iron had an equal load utilization factor of 2%, indicating that such loads are rarely used during the day per consumer premise. These results reveal that most residential consumers consume much of their electricity using four major appliances, air conditioning, freezers, refrigerators, and lighting during the day, with light having a utilization factor of 14%. The utilization factor of an appliance can change over time because of changes in consumers’ living patterns. It is also reasonable to consider that these factors largely reflect a typical weekday rather than a weekend. Therefore, it is also possible that some variations in the variation factors may exist if weekends and seasonal times are actively considered.
3.1.2. Hourly Load Variation Factor (LVF)
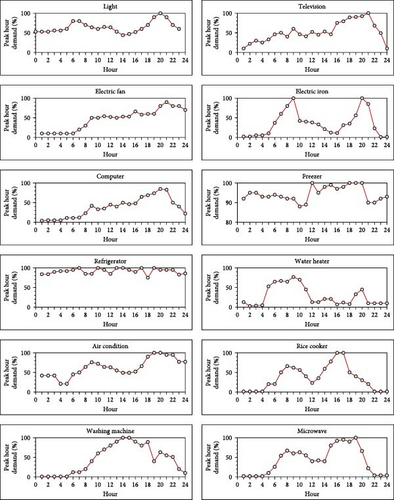
The periodic LVF recorded from the survey indicated the demand for each appliance per hour. It is the percentage of the maximum power demand of each appliance per hour. The results showed that the hourly demand for lighting, refrigerators, freezers, and electric fans at midnight was 53%, 85%, 92%, and 1% of their maximum demand, respectively. This implies that freezer consumes 92% of its maximum demand from the four appliances referenced at midnight. This can also be interpreted as more freezers being used by residential consumers at midnight than other appliances. Considering the load variability of computers at 6 am and 6 pm, residential consumers utilize twice the maximum demand of computers at 6 pm than at 6 am. This also indicates that all respondents claimed to have had their computers operated at 6 pm than at 6 am. The load curve for electric iron shows that the consumption of electricity occurs in both the early morning and evening hours of the day. This can be attributed to the fact that more residential consumers use appliances for ironing in the morning and evening. The appliance LVF can vary from one consumer to another and from one geographical locality to another. A stack of all the individual appliance profiles is shown in Figure 5. The aggregated curve in Figure 6 shows how all individual appliances contribute to forming the load curve of residential consumers.

3.1.3. Load Curve
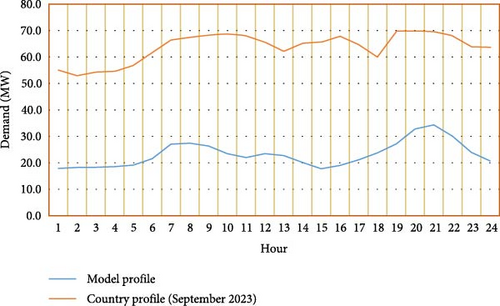
The load model was validated by comparing the derived load curve to the combined load profile of Freetown recorded by operators at the bulk supply point at 161 primary substations for September 2023. The country load profile describes the present generation situation of the city and supply restrictions on the distribution network. This explains the number of connected consumers under load rotation or shedding. The load aggregates two supplies: Karpowership and the country hydropower plant Bumbuna. Furthermore, it comprises all the industrial, commercial, and residential customers connected to it. However, the load profile of the city accounted for the suppressed load for Freetown. Finally, another factor could be attributed to the need for measured household energy consumption data.
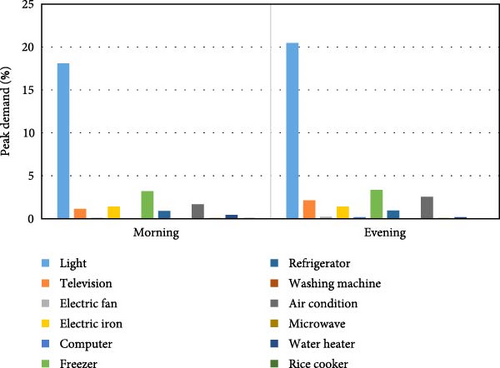
Nevertheless, the derived curve resembles Freetown’s load profile and is comparable to a typical residential load curve, as shown in Figure. The curve indicates two peaks: a low peak from 6 am to 8 am and a high peak in the evening from 6 pm to 8 pm. The curve shape is a function of the LVF, which is influenced by the time and usage rate of each appliance. An average peak load of 26.95 and 31.42 MW was obtained from the model for both the morning and evening peaks, respectively. The morning peak is influenced by the simultaneous use of appliances, as residential customers rise from sleep, getting to work, and attending activities. Evening peaks are influenced by the presence of consumers in their respective homes as they return from schools, offices, and other duties. The highest contributors to the morning peak demand were light, freezers, air conditioners, and electric iron in their respective order, accounting for approximately 84.34% of the peak loads. Light, freezers, air conditioners, televisions, and electric iron in their respective order account for approximately 94.91% of the peak loads, as shown in Figure 7. Furthermore, Figure 8 shows the average demand contribution of each appliance to the peaks.
3.2. Assessing Peak Load Reduction
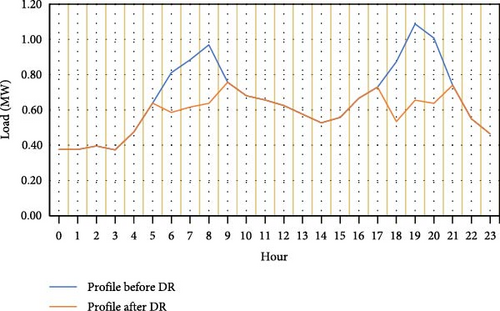
The resulting load profile after implementing the DR is shown in Figure 9. The blue plot represents the load profile obtained prior to DR implementation. A brown plot was obtained after implementing the DR on the model load profile. The two valleys in the brown plot demonstrate the effect of DR on peak demand. After implementing the DR model, an average peak load reduction of 4.19 MW, representing 15.56% of the morning peak demand, and 3.54 MW, representing 11.26% of the morning peak demand, were achieved. These findings align with existing research and further substantiate the tangible effects of VDR. A relevant case study conducted by Gyamfi and Krumdieck [17] in Christchurch, New Zealand, demonstrated that VDR initiatives resulted in notable reductions in morning and evening peak loads, with decreases of 10% and 7%, respectively.
These results were consistent with the observations of the present study. Furthermore, this study correlates with a similar investigation conducted by Diawuo et al. [14], where the analysis encompassed a range of scenarios spanning 2018–2050. Their research yielded an average daily peak load reduction ranging from 65 to 406 MW, corresponding to a 2%–14% reduction. These findings highlight the potential impact and effectiveness of DR measures in diverse contexts. In a study done by Fulhu et al. [18], they found that sending a VDR signal for 2 hr to 25% of the people in Fenfushi village island, Maldives, led to a 10% reduction in fuel usage for generators during the busiest times. Their study also validates the importance of the VDR and is in line with this study. In addition, this study also compares to a similar study carried out by Conteh et al. [19] on the Freetown distribution network using the time of use (ToU) and direct load control (DLC) techniques independently. Their work resulted in 6.5% and 6.39% load reductions for ToU and DLC, respectively.
3.2.1. Emission Savings (ES) Analysis
The ES obtained from the morning peak and evening average load reductions were 0.001952 million CO2 and 0.001649 million CO2, respectively. The emitted CO2 emissions from electricity and heat in 2021 are 0.18MCO2. Although the CO2 emission level is considerably low and has no contributing factor to the global emission rate, there are several environmental challenges Sierra Leone faces resulting from climate change issues.
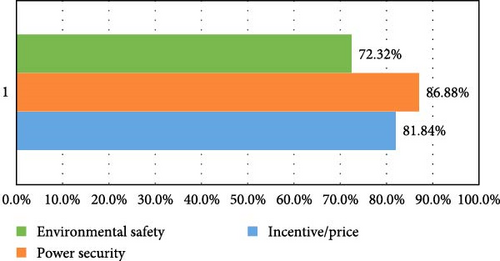
3.3. DR Motivation
Figure 10 visualizes the cumulative percentages for each DR indicator. The figure shows that power security had a top percentage score of 86.88%. This result signifies that residential consumers are more likely to voluntarily participate in DR based on power security than to experience power outages and load-shedding situations resulting from power insecurity. The incentive signal had the second highest score of 81.84%, indicating that price incentives can also play a leading role as drivers of VDR in the residential sector, as the influence factors were slightly below power security. This is because residential electricity consumers prefer a moderate tariff structure over an expensive one. The environmental safety score is 72.32%. Although the influence score on environmental security was least considered a motivational drive by residential consumers, its influence score is relevant. Thus, it is a perfect fit to enhance the VDR in the residential sector. This study’s result agrees with that of Diawuo et al. [14], considering the preference placed on the indicators. However, these values were higher than those reported in their studies. Therefore, all three indicators in Sierra Leone have equal chances of driving VDR. However, environmental safety will have strength in Ghana based on the 1% preference placed on it by the respondents in their study compared to the 72% preference recorded in this study. However, this agrees with the investigation by Gyamfi and Krumdieck [20] that a well-informed audience on price, the environment, and power security can fuel the interest of VDR.
3.4. Policy Considerations
Although the study has been able to deduce the benefit of DR in reducing peak load, its implementation, in reality, faces many challenges in most African countries, and Sierra Leone is not an exception. One leading challenge is policy drafting and implementation. The relevance of this research is not only limited to assessing the potential of peak load reduction through DR but also to highlight policy considerations that may drive the DR in Sierra Leone. For a DR to thrive in any nation, the following should be considered: policy framework, smart grid or metering infrastructure, public sensitization and education of the benefit of DR, and market structures.
3.4.1. Developing Policy Framework
All energy frameworks in Sierra Leone integrate renewable energy into the energy mix, EE, and grid expansion. However, these frameworks must support DR as an instrumental solution to the current and future energy crises. The Government of Sierra Leone, the Ministry of Energy, the Sierra Leone Electricity Water Regulatory Company, and all bodies responsible for drafting policies must consider drafting policy frameworks that are flexible and adaptable to driving DR. The Government of Sierra Leone should drive apparent and supportive regulations that encourage utilities to integrate DR into their operations. This may include setting standards, tariffs, and incentives for utilities and consumers to participate in DR programs.
3.4.2. Smart Grid Development
The lack of smart grid infrastructure in Sierra Leone is an impeding factor in DR. An intelligent grid system allows power utilities to collect real-time data on the electricity consumption, grid conditions, and equipment performance. With this capability, utilities in Sierra Leone may be able to monitor network operations efficiently, thereby hindering their ability to assess demand patterns and respond effectively to changing conditions. A smart grid has two elements: an advanced metering infrastructure (AMI) and an asset management system (AMS), which maintain DR in countries with smart grid systems. AMI is a crucial component of smart grids that includes the installation of smart meters on consumer premises. These meters provide real-time data on electricity use and enable remote monitoring and control. The Electricity Distribution Supply Authority in Sierra Leone has introduced AMI to industrial customers, and extending this technology to residential and commercial users could significantly enhance DR capabilities. Smart grids incorporate AMS that help utilities monitor and maintain the grid equipment efficiently. This proactive approach minimizes downtime and reduces technical losses. With such a system, utilities can promptly address equipment failures, leading to inefficiencies in distribution networks. Investment in improving the grid to be “smart” is crucial. This may involve upgrading the infrastructure, deploying smart meters for residential and commercial customers, and implementing data analytics and control systems. Such investments can be paid off through reduced energy losses, improved grid stability, and more effective DR programs. Therefore, the lack of smart grid infrastructure in Sierra Leone presents a significant barrier to implementing effective DR initiatives. Investment in smart grid technologies, including AMI and AMS, can help power utilities better manage their networks, engage consumers, and address the challenges faced by transmission and distribution networks. This, in turn, can lead to improved EE and sustainability.
3.4.3. Public Sensitization and Engagement
In Sierra Leone, most of the population may need to be made aware of the concept of DR or the benefits it can offer, as observed during the survey. EE, which is closely related to the DR, may also be a foreign concept. To address this issue, there is a need for comprehensive sensitization campaigns aimed at educating the public about EE, DR, and their potential benefits. These campaigns should target a broad audience, including both rural and underserved communities. Collaboration between government agencies, utilities, nongovernmental organizations, and international partners can be crucial in launching effective sensitization campaigns. These partnerships can pool the resources and expertise to develop and implement educational programs. Therefore, government policies and regulations can promote EE and DR. The government should consider implementing policies that incentivize consumers and businesses to adopt energy-efficient practices.
3.4.4. Market Structure and Incentives
The absence of a well-defined market structure and adequate incentives presents a significant obstacle to the effective implementation of DR in Sierra Leone. There must be a competitive market environment that encourages consumers and utilities to actively engage in DR initiatives. This deficiency limits the potential benefits derived from optimized energy consumption patterns. The pivotal role of the Sierra Leonean government in implementing DR must be balanced, particularly given the current state of the power sector, which lacks comprehensive deregulation, notably within the distribution sector. Therefore, deregulation is an important requirement. Market-oriented policies play a crucial role in fostering active engagement in the electricity market. The liberalization of the electricity market catalyzes the effective adoption of incentive-driven strategies to implement DR successfully. An essential component of this endeavor involves privatizing the power sector to instigate healthy competition, shifting from monopolistic models to retail competition, empowering consumers to select their energy providers, and thus enhancing market dynamics [14]. Introducing financial and nonfinancial incentives is vital for motivating utilities and consumers to embrace DR. Financial incentives such as reduced tariffs during off-peak hours or government grants for implementing DR technologies can encourage consumers to shift their energy usage. Providing incentives such as tax breaks or revenue-sharing opportunities based on successful DR programs can be instrumental in promoting active participation. Moreover, fostering collaboration and partnerships between the government, private sector, utility providers, and civil society is essential. These entities can design and implement effective policies that align with the country’s energy goals and facilitate the integration of DR into the energy landscape.
4. Conclusion
Considering climate change vulnerabilities and the increasing depletion of fossil fuel resources, DR is expected to be essential for maintaining a balance between energy supply and demand. Owing to a lack of pertinent information on consumer behavior, household energy consumption data, and extensive economic analyses for implementing such programs, opportunities from residential voluntary DR are virtually untapped in Sierra Leone and most African countries. In this thesis, the Freetown distribution network was used as a case study to examine the impact of DR measures in lowering peak demand using a bottom-up end-use model, known as the maximum diversified demand, with household energy audit data to assess residential DR potential. An aggregated load curve showing two peaks indicates that more loads are consumed in the early morning of the day, spanning 6 am to 8 am, and a critical peak occurs in the evening at approximately 6 pm to 8 pm. Various appliance utilization factors and individual hourly load profiles were obtained, indicating the utilization of various appliances in the commercial sector. Peak load reduction of 4.19 and 3.45 MW was achievable for both peaks. This shows that VDR can leverage the peak burden on the network if residential consumers are adequately oriented, communicate, and actively participate in VDR. Price, environmental issues, and power security will fuel Sierra Leone’s residential sector to embrace and actively participate in the VDR with price security. This study did not use actual measurements of energy consumption data. The use of measured data would provide more accurate readings of appliance consumption than using the power ratings and approximated utilization factors to determine the maximum load demand of the appliance recommended for future researchers. The work could not capture the economic benefit of DR and the possible barriers to its implementation in Sierra Leone. Future researchers can consider looking at the financial viability of the DR in Sierra Leone and the potential barriers that impede its implementation in the country.
Conflicts of Interest
The authors disclosed that they have no conflict of interest.
Authors’ Contributions
All authors agree to be accountable for the content and conclusions of the article. Joseph Kugbea Rogers contributed to conceptualization, methodology, investigation, software, formal analysis, and writing, original draft preparation. Felix Amankwah Diawuo contributed to methodology; formal analysis; writing, review and editing; validation; and supervision. Martin Kyereh Domfeh contributed to formal analysis; writing, review and editing; validation; and supervision.
Acknowledgments
They authors express their sincere gratitude to the World Bank for providing scholarship assistance through the African Centres of Excellence (ACE) Impact project, facilitated by the Regional Centre of Energy and Environmental Sustainability (RCEES) at the University of Energy and Natural Resources, Sunyani, Ghana.
Open Research
Data Availability
The data that support the findings of this study are available from the corresponding author upon reasonable request. The authors confirm that the data supporting the findings of this study are available within the article in Tables 2.1, 2.2, 2.3, and 2.4 in the Method and Data section. The data can also be shared upon reasonable request.


