Experimental Measurement and Modeling Analysis of the Heat Transfer in Graphene Oxide/Turbine Oil Non-Newtonian Nanofluids
Abstract
Heat transfer characteristics of graphene oxide (GO)/turbine oil as a non-Newtonian nanofluid are assessed both experimentally and numerically in this paper. To do so, 0.2, 0.3, 0.5, and 1 mass percent (wt%) of GO is homogeneously dispersed in the base liquid. First, the specific heat capacity, thermal conductivity, viscosity, and density of the synthesized nanofluids are measured using standard laboratory methods. After that, constants of the shear stress equation are determined through the nonlinear regression of the rheology data on the power law model. Finally, the heat transfer from turbine blades with a constant surface temperature to the coolant nanofluid is investigated using mathematical modeling. The results suggest that while the nanofluid density, viscosity, and thermal conductivity increase by increasing the nanoparticle concentration by 0.57%, 7.07%, and 18.89% in succession, respectively, and its specific heat capacity decreases by 0.54%. Moreover, both the convective heat transfer coefficient and the temperature profile in the considered nanofluids depend on the average velocity and Reynolds number. Furthermore, the convective heat transfer coefficient increases by 5.5%, 9.5%, 14%, and 17% in exchange for 0.2, 0.3, 0.5, and 1 wt% of GO nanoparticles in the base liquid, respectively.
1. Introduction
Since most gas turbines in oil and gas industries are geographically located in the southern regions of Iran, the temperature of entering air to compressors and their outlet stream is very high during the hot months of the year. This increase in the temperature is reported to damage the turbine blades and reduce efficiency [1]. So, to prevent potential damage to compressors or turbines, the flow rate of entry air should be controlled. Generally, the inadequate manipulation of compressors imposes some undesirable effects on the operation of the gas turbine and decreases its production capacity [2]. Moreover, since gas compressors usually incompletely perform their duty, more gas burns in the flares (burners of gas booster plants), and the liberated gas from oil decreases.
The literature survey confirms that the heat transfer in turbines and the efficiencies increase by adding nanosized particles to the operating fluid [3, 4]. This fluid not only reduces the friction factor and lubricates the moving parts of turbines [5], but also effectively dissipates the produced heat for cooling down the turbines. Thermal conductivity is another important nanoparticle property that has attracted much attention [6, 7]. Since solid metals and their oxides and carbon-based structures have higher thermal conductivity than lubricating oils, their addition to the oil can improve thermal performance [8–11].
Nanofluid is a widely used expression to refer to a homogeneous dispersion of either nonmetallic [12, 13], solid metal [14, 15], or hybrid [16, 17] nanoparticles in a base fluid. Choi and Eastman introduced the concept of nanofluid and reported that nanosized particle addition to a base fluid is due to intensification of the convective heat transfer rate [18]. Thus, various researchers have concentrated on the nanofluid’s behavior in laminar and turbulent flows for different geometries [19, 20]. Investigation of forced, natural, and mixed convection of nanofluids is among the hottest research topics [21–24].
Depending on the type of the base liquid, nanofluids behave as either Newtonian [25] or non-Newtonian [26]. Shear stress is linearly related to the shear rate in Newtonian fluids, while this relationship is nonlinear in non-Newtonian fluids [27]. Moreover, some researchers reported that a non-Newtonian behavior may also be observed when adding nanoparticles to a Newtonian fluid [28].
Few researchers have focused on non-Newtonian nanofluids, and significant parts of their physical characteristics are still unknown. Compared with the Newtonian nanofluids, this is true about heat transfer, too. In a horizontal pipe and the state of forced convection, the heat transfer in nanofluids was numerically studied by Behroyan et al. using computational fluid dynamics methodology [29]. They also compared the accuracy of single-phase non-Newtonian and Newtonian methods with other available two-phase approaches. The results showed that the two-phase Eulerian–Lagrangian and the single-phase Newtonian models are the most meticulous tools for prediction. The mixed convection state for the non-Newtonian nanofluids in a rectangular channel under a magnetic field is simulated using the Boltzmann lattice and finite difference methods [30]. The results state that the heat transfer performance of nanofluids is mounted by enhancing Richardson and Hartmann’s number alongside the power law index. Mahmoudpourfard investigated the influence of the magnetic field to determine the thermal behavior of magnetized non-Newtonian fluids inside the vertical rectangular channel for a base fluid with electrical conductivity using a two-phase mixed model [31]. The results show that the Nusselt number for the considered fluid is comparable with Newtonian fluid. The space between two perpendicular plates was used by Hatami and Ganji for the numerical calculation of natural convection in a nanofluid with a non-Newtonian base fluid [32]. The velocity profile is compared with the temperature profile of copper- and silver-based nanofluids. It was confirmed that the former has a higher temperature and velocity than the latter. Moraveji, Haddad, and Darabi relied on a single-phase approach to study the heat transfer of a non-Newtonian nanofluid in the state of forced convection inside a level pipe where the heat flux was constant [33]. The results confirmed that the convection heat transfer coefficient decreases as the nanoparticle diameter mounts. In addition, a dimensionless equation for the Nusselt number is also presented. Researchers investigated the heat transfer performance [34] and rheological behavior [35, 36] of carbon nanotube–based (CNT-based) nanocomposites and nanofluids. It was summarized that the wall area affects the convective heat transfer coefficient, and this goes back to the non-Newtonian behavior of the CNT-based nanofluid. Grag et al. experimentally investigated the ultrasonication impact on the viscosity as well as the heat transfer performance in water-based nanofluid comprising multilayer CNTs inside a horizontal pipe [37]. They observed the increase in both conduction and convection heat transfer coefficients inside the pipe by the Reynolds number. It is also claimed that the CNT-based nanofluid exhibits a pseudoplastic behavior. Graphene [38, 39] and graphene oxide (GO) are other carbon-based nanostructures that are widely used in the literature [40]. Their layered structure can improve heat transfer performance [41] and reduce wear in mechanical parts [42].
To the best of our knowledge and according to the literature reviews, no study has been available to cater to the heat transfer evaluation in GO/turbine oil as a non-Newtonian nanofluid. Hence, the purpose of this study is to monitor the influence of homogeneous dispersion of exfoliated GO nanoparticles (at different mass percentages) in a non-Newtonian base fluid (i.e., HB-80 oil) on the thermophysical characteristics of the synthesized nanofluids and their heat transfer behavior. Since no study has been performed on this non-Newtonian nanofluid, this work first measures the specific heat capacity, thermal conductivity, viscosity, and density experimentally. Then, constants of the shear stress equation are reaped using a nonlinear regression. The final step is to offer a model for the heat transfer behavior of the nanofluids according to the experimental findings.
2. Materials and Methods
2.1. Experimental Stage
2.1.1. Materials
HB-80 oil, the base fluid of the current experimental study categorized as turbine oil, is produced by Behran Company (Iran). This oil is made from paraffinic base oil obtained from refining crude oil using a hydrogenation process (full hydro finishing) and suitable additives. According to the catalog provided by the company, specifications of the HB-80 oil are reported in Table 1.
| Material type | Parameter | Value | Unit |
|---|---|---|---|
| Base fluid: Industrial oil HB-80 | Kinematic viscosity | 46 | Centistokes (cSt) |
| Viscosity index | 95 | — | |
| Density | 875 | kg/m3 | |
| Flash point | 205 | °C | |
| Pure point | −6 | °C | |
| Graphene oxide nanoparticles | Cas no. | 5-42-7782 | — |
| Purity | 99.2 | % | |
| Color | Gray-brown | — | |
| Density of particles | 2.1 | g/cm3 | |
| Thermal conductivity | 1240 | W/m.K | |
| Heat capacity | 1.63 | kJ/kg.K | |
The required GO nanoparticles were synthesized using the modified Staudenmaier method [43]. Properties of the synthesized nanoparticles are also marked in Table 1.
2.1.2. Nanofluid Preparation
Non-Newtonian nanofluids are synthesized by dispersing a desired deal of GO nanoparticles in the HB-80 base oil. The nanoparticle concentration drastically affects the performance of synthesized nanofluids. Previous studies confirmed that high doses of nanoparticles result in nanoparticle agglomeration, their deposition in equipment, increasing friction, and surface damage [44, 45]. On the other hand, the performance of nanofluids with a low nanoparticle’s concentration is not good enough than the base fluid [46]. The literature survey reveals that although different nanoparticle dosages can be added to base fluids (i.e., 0.01%–5% by weight), 0.1 to 1 wt% of nanoparticle concentrations have shown better performances. Moreover, some researchers reported that this range is the optimum concentration of nanoparticles in base fluids [47, 48]. Therefore, the impact of the concentration of GO nanoparticles on the heat transfer behavior of nanofluids is checked in four levels of 0.2, 0.3, 0.5, and 1 wt% in this study.
2.1.3. Apparatus and Measurement Methods
A mechanical agitator is utilized to disperse GO nanoparticles in the HB-80 base oil. To do so, the nanoparticles are added to the base fluid and stirred continuously by a magnetic stirrer for 6 h. The stable nanofluids can be synthesized by subjecting the samples to ultrasonic waves by the SinapTec Lab750 (France) apparatus with cycle 0.5 and amplitude 70% for one hour.
This study measures the density of the synthesized nanofluids by the high-precision hydrometer (850–900 hydrometer made by Brannan, UK) at 25°C. The length of this equipment is 270 mm, and it has a maximum error and maximum measurement accuracy for specific gravity of 0.0006 and 0.001, respectively.
Viscosity as a contributing factor in fluid behavior is essential to determine. Because the kinematic viscosity is a function of time only and can be measured easily and accurately, its values were also measured in the experimental stage of our study. A viscometer (model T2280, Azmayesh Abzar Company, Iran) was employed to measure the kinematic viscosity. This study investigates the effect of dosages of GO nanoparticles (i.e., 0.2, 0.3, 0.5, and 1 wt%) at two temperature levels of 40°C and 100°C on the kinematic viscosity of the nanofluids by the ASTM D-445 standard test.
The thermal conductivity of nanofluids is often measured in a vast majority of experimental studies using the transient hot wire as an accurate method. In this research, a thermal analyzer apparatus (Decagon company, KD2) is applied to monitor the thermal conductivity of the homogeneous dispersion of GO in HB-80 oil. The thermal conductivity is determined by placing the device probe in the nanofluid sample. This measurement is done in three steps for each nanofluid sample. The thermal conductivity measurement using the transient hot wire apparatus distorts. A five-minute interval between three measurements is considered since this method distorts the thermal equilibrium after each step.
The heat capacity of the base fluid and nanofluid are measured using the 5E-C5500 calorimeter (made by FPJ Company, Iran) according to the ASTM D5865 standard test. For this purpose, 1 g of fluid sample is placed in the apparatus chamber, and an increase in its temperature is monitored as a result of a certain amount of heat.
2.2. Mathematical Stage
2.2.1. System Geometry and Modeling Assumptions
One of the most essential points in the operation of modern gas turbines is the internal cooling of the turbine blades. The high temperature of the fluid in the turbine may exceed the melting point of the blades’ material. Cooling systems currently exist in gas turbines for all stationary and moving parts, usually using turbine oils for this purpose [49]. The energy balance must be applied to check the impact of GO nanoparticles on heat transfer in gas turbine blades. Since the distance between surfaces in contact is smaller than their radius of curvature, the system geometry can be considered a two-dimensional cartesian coordinate (see Figure 1). The channel length (H) is 20 cm, and the distance between the plates (L) is 2 cm. The fluid temperature at the channel’s entrance (Tin) is 40°C. The left and right plates have 40°C and 100°C temperatures, respectively.
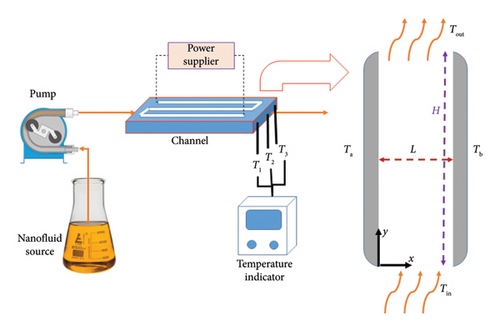
Heat transfer in the turbine blade is experimentally studied in a rectangular channel (20 × 10 × 2 cm) similar to the turbine blade, as illustrated in Figure 1. The blade temperature is monitored by applying several thermocouples at the channel’s beginning and end. There are three thermocouples at the end of the channel: one in the center and two others at a distance of 2 cm from the edge of the channel. The electric heater is employed to fix the wall temperature at 100°C and 50°C. The non-Newtonian fluid flow is passed through the channel by a peristaltic pump. The fluid flow velocity must be small to reach a low Reynolds number. For this purpose, the non-Newtonian fluid flow rate is fixed between 0.5 and 1.5 lit/hr.
- 1.
Fluid is incompressible.
- 2.
A homogeneous model is applied to explain the nanofluid’s behavior. This model assumes that the velocity of nanofluids equals the fluid velocity since their size is small. This means that no difference exists between the fluid’s velocity and suspended nanoparticles.
- 3.
The system has a two-dimensional geometry.
- 4.
Steady state flow.
- 5.
Laminar flow.
- 6.
Fully developed flow.
- 7.
All the pipes and ducts are fully isolated, and the heat loss is negligible.
Also, the effect of nanoparticles on the governing equations is considered in physical parameters such as density, viscosity, and shear stress parameters. In addition, according to the assumption of the homogeneous model, the presence of nanoparticles does not create an excess term in this equation.
2.2.2. Mass Conservation Law
2.2.3. Newton’s Second Law (Momentum Equation)
Therefore, pressure is a function of the y direction only and is constant in the x direction.
2.2.4. Energy Conservation Law
Velocity and temperature profiles can be obtained through the solution of equations (6) and (8), respectively. Since the right-hand side of equation (6) is constant, the velocity profile in terms of x can be simply obtained using a double integration process. The energy equation is a partial differential equation that depends on the temperature and velocity. The discretization of the energy equation results in a system of equations for determining the temperature profile inside the nanofluid. The reported equations in Table 2 are obtained using the procedure mentioned above. These equations are employed to determine the required variables for modeling the velocity and average velocity of the fluid, pressure changes versus the Reynolds number, a system of equations for determining the temperature profile in the fluid, the bulk temperature of the outlet stream, local and average convection heat transfer coefficients, and local as well as average Nusselt numbers. Values of these parameters are often a function of n, which depends on the type of the non-Newtonian fluid.
| Parameters | Equation | Number |
|---|---|---|
| Velocity profile | v = [(1/m)(dp/ dy)](1/n)(n/n + 1)(L/2)(n + 1/n)[|2x/L − 1|(n + 1/n) − 1] | (10) |
| Average velocity | V = vmax((3n + 1)/(2n+1)) = [1/m(dp/ dy)](1/n)(n/n + 1)(L/2)(n + 1/n)((3n + 1)/(2n + 1)) | (11) |
| Reynolds number | Re = ρnfV(2L)/μnf⟶V = (Reμnf/2ρnfL) | (12) |
| Pressure gradient | (13) | |
| Temperature | Ti+1,j − (2 + (vi,j∆x2/αnf∆y))Ti,j + Ti−1,j = −(vi,j∆x2/αnf∆y)Ti,j−1 | (14) |
| Bulk temperature | (15) | |
| Local convective heat transfer coefficient | hy = (ρnfCpnfVL/(Ts − Tm))(dTm/ dy) | (16) |
| Average convective heat transfer coefficient | (17) | |
| Local Nusselt number | Nuy = hy(2L)/knf = (2ρnfCpnfVL2/knf(Ts − Tm))(dTm/ dy) | (18) |
| Average Nusselt number | (19) |
3. Results and Discussion
3.1. Experimental Characterization
3.1.1. Characteristics of Nanoparticles
The full description of the synthesis procedure and complete characterizations of GO nanoparticles are available in our previous study [43]. The characterization results of the synthesized GO nanoparticles (SEM and TEM images and XRD) are presented in the supporting information to avoid repetition (see Figure S1). The nanofluid stability was investigated by imaging for a period of 24 h. The imaging results for nanofluid with maximum nanoparticle concentration (1.0 wt%) show no change in the nanofluid during 24 h; therefore, it has acceptable stability (see Figure S2).
3.1.2. Measurement of Physical Properties of Nanofluid
The measured density for HB-80 base fluid and nanofluids containing different mass concentrations of GO nanoparticles (i.e., 0.2, 0.3, 0.5, and 1 wt%) is reported in Table 3. Since the mass ratio of the base liquid to nanoparticles is high, the diversity of nanofluid density with the concentration of nanoparticles is very small. Also, since the density ratio of nanoparticles to the base liquid is more than two, the nanofluid density mounts by mounting the nanoparticles’ concentration.
| Measured parameter | Unit | Nanoparticle concentration (wt%) | ||||
|---|---|---|---|---|---|---|
| Base fluid | 0.2 | 0.3 | 0.5 | 1.0 | ||
| Density | (g/cm3) | 0.876 | 0.877 | 0.877 | 0.878 | 0.881 |
| Viscosity at 40°C | (cSt) | 48.49 | 48.59 | 49.02 | 50.56 | 51.22 |
| Viscosity at 100°C | (cSt) | 6.93 | 6.92 | 7.00 | 7.28 | 7.42 |
| Thermal conductivity | (W/mK) | 0.133 | 0.143 | 0.150 | 0.155 | 0.158 |
| Heat capacity at 25°C | (kJ/kg.K) | 1.588 | 1.587 | 1.587 | 1.585 | 1.580 |
| Heat capacity at 65°C | (kJ/kg.K) | 1.839 | 1.836 | 1.836 | 1.834 | 1.829 |
| m | (Pa.sn) | 0.139 | 0.1453 | 0.1547 | 0.1611 | 0.1847 |
| n | — | 0.7413 | 0.7130 | 0.6937 | 0.6702 | 0.6294 |
The influence of the nanoparticles’ concentration and temperature on the viscosity of the base fluid and nanofluids should be investigated experimentally. To do so, the kinematic viscosity of HB-80 oil and its nanofluids containing 0.2%, 0.3%, 0.5%, and 1% by weight of GO nanoparticles at 40°C and 100°C is measured and reported in Table 3. The results state that nanofluids’ viscosity is directly related to the nanoparticle weight fraction. It can be observed that the nanofluids’ viscosity is enhanced by increasing the nanoparticles’ concentration for both 40°C and 100°C. These findings were also reported by other researchers and reported in different literatures [29, 44].
The thermal conductivity of nanofluids containing diverse GO concentrations (i.e., 0.2, 0.3, 0.5, and 1 wt%) and the base oil is experimentally measured to assess the influence of the nanomaterial on the thermal behavior of nanolubricants and reported in Table 3. Clearly, the thermal conductivity of lubricants improves by mounting the dosage of nanoparticles. Taken together, by increasing the nanoparticles’ concentration, the thermal conductivity of nanofluids continuously mounts. These results are in complete agreement with the findings of other researchers [51].
Specific heat capacity has an essential influence on heat transfer by fluids. A calorimeter with an accuracy of 0.001°C was applied to measure the specific heat capacity of both nanofluids and the base fluid in this research. Table 3 exhibits the results obtained for base fluid and nanofluid with various weight fractions of nanoparticles at both 25°C and 65°C. The specific heat capacity of nanofluids has been proven to decrease by increasing the concentration of nanoparticles. This could be associated with the lower heat capacity of GO nanoparticles (about 0.716 kJ/kg.K) than the base fluid (1.713 kJ/kg.K on average).
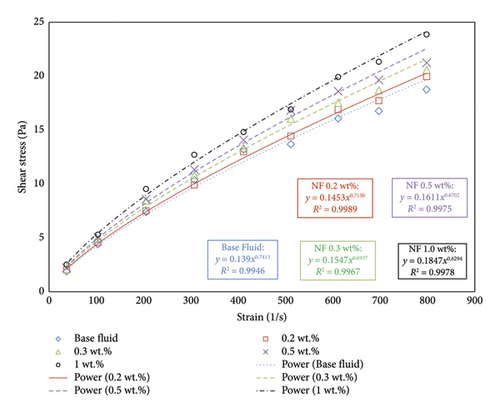
Rheology data were utilized to determine the constants of the shear stress equation (i.e., m and n). For doing so, the experimental values of shear stress versus strain are plotted first. Then, the nonlinear regression technique is employed to fit τ = m(∂v/∂y)n on the experimental data and estimate both m and n constants (see Table 3).
If the shear stress changes linearly by the strain (i.e., n = 1), the nanofluid will be Newtonian. The findings of this analysis are shown in Figure 2. For a constant shear stress, the strain decreases by increasing the nanoparticle concentration based on the figure. This could be rooted in the increase in the nanofluid viscosity by increasing the nanoparticle concentration.
3.2. Modeling Results
This section aims to validate the results achieved through modeling with the experimental data. The validation is done utilizing the output and average temperatures of the channel. Considering the physical specifications of the utilized nanofluids, the flow rate was set so that Reynolds numbers of 5, 10, and 15 are achieved. The channel outlet temperature at distances of 4, 10, and 16 mm from the examined blade and their average has been obtained from the experimental and modeling results. These temperatures are presented in Table 4 with T1, T2, and T3 notations. It can be seen that the average temperatures obtained by the modeling and experimental analyses are close enough. Indeed, the modeling results have an outstanding agreement with the experimental data, that is, the relative error of 7%, 2%, and 2.1% for the Reynolds numbers 5, 10, and 15, respectively.
| X/L | Temperature (°C) | Re = 5 | Re = 10 | Re = 15 | |
|---|---|---|---|---|---|
| Experimental | 0.2 | T1 | 40.0 | 40.0 | 40.0 |
| 0.5 | T2 | 45.9 | 43.1 | 41.0 | |
| 0.8 | T3 | 82.1 | 66.9 | 60.2 | |
| Tm | 56.0 | 50.0 | 47.1 | ||
| Modeling | 0.2 | T1 | 40 | 40 | 40 |
| 0.5 | T2 | 42 | 40 | 40 | |
| 0.8 | T3 | 98 | 73 | 57 | |
| Tm | 60 | 51 | 45.7 | ||
| Relative error for Tm (%) | 7.14 | 2.0 | −2.97 | ||
- Note: Tm is the bulk temperature. This variable is used to validate the modeling results.
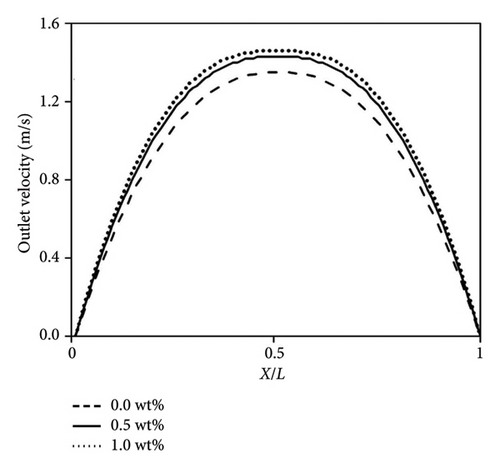
The heat transfer performances of synthesized nanofluids are tried to be investigated after determining their physical properties. The fluid velocity profile inside the channel can be obtained by solving Table 2 equation (10) considering a fully developed flow condition. This profile for the outlet flow from the channel is shown in Figure 3. Obviously, the velocity profile has a parabolic shape that corresponds to a laminar flow inside the channel. It should be mentioned that the pressure gradient term in Table 2 equation (10) is determined using Table 2 equations (11) and (12) for Re = 10.
The bulk temperature as a function of channel length obtained by solving Table 2 equation (14) is exhibited in Figure 4. As the thermal boundary layer expands, the bulk temperature of fluid increases inside the channel. Moreover, Figure 4 shows that the increase in nanoparticles’ concentration led to the rise of the bulk temperature of nanofluids. Indeed, increasing the nanofluids’ thermal conductivity by augmenting the dosage of nanoparticles is perceived as the primary cause for this observation. Increasing thermal conductivity finally decreases the thermal resistance and increases the bulk temperature in nanofluids. The bulk temperature is different at various points along the channel because the heat transfer coefficient varies by location. Therefore, an average bulk temperature can be defined for the entire length of the channel (in the y direction).
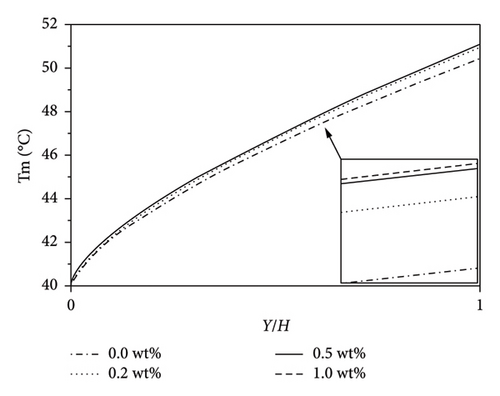
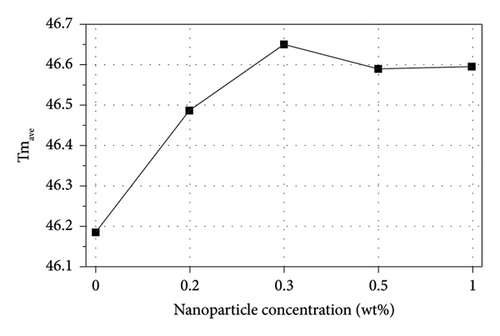
Figure 5 depicts the average bulk temperature of nanofluids along the channel for different weight fractions of GO nanoparticles. From this figure, the bulk temperature along the channel increases by increasing the dosage of nanoparticles. Moreover, the nanoparticle concentration impact on the bulk temperature decreases from 0.2 to 1 wt%, and there is little difference between their values at high concentrations. Since the velocity profiles at high concentrations of nanoparticles (i.e., 0.5 and 1 wt%) are relatively similar, the difference between the numerator of Table 2 equation (14) for two nanofluids is very small. Another critical point to consider is that other physical specifications of nanofluids in these concentrations are also very close. Hence, the velocity profile and average velocity are the main influential factors.
The profile of the local convection heat transfer coefficient is illustrated in Figure 6(a) for the considered nanofluids. It can be observed that the growth of the thermal boundary layer decreases the convection heat transfer coefficient. It could be due to the decrease in the temperature gradient between the plate and the fluid. Moreover, the local convective heat transfer coefficient continuously improves by increasing the nanoparticles’ dosage in the base liquid. The phenomenon could be observed more clearly in Figure 6(b). This figure exhibits the ratio of the convection heat transfer coefficient of the nanofluid to the base liquid. It can be simply seen that the increase in the concentration of nanoparticles from 0.2 to 1 wt% significantly improves the convection heat transfer coefficient from 5.5% to 17%, respectively. Our results match the experimental findings of other scholars [52].
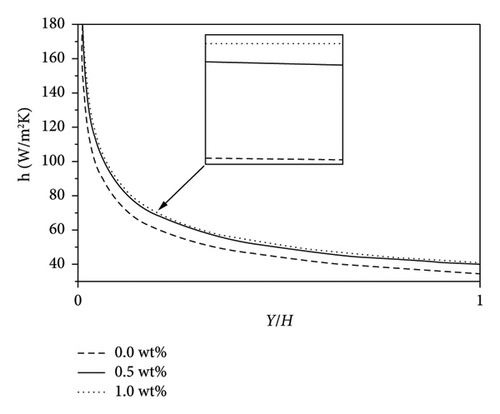
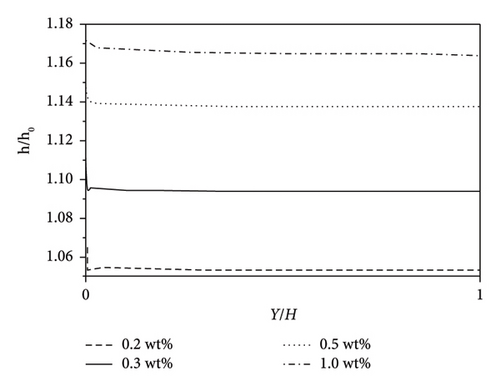
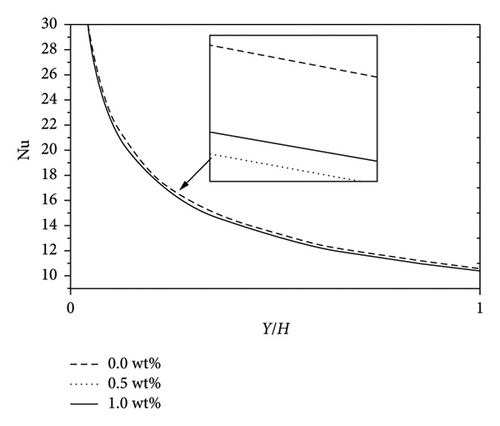
Figure 7 presents the changes in the local Nusselt number for nanofluids containing various weight fractions of GO nanoparticles on the right plate. Based on this figure, the convection heat transfer coefficient along the channel decreases the Nusselt number. Decreasing the temperature gradient between the plate and fluid, which reduces the driving force of heat transfer, is responsible for this result. Another notable point is that the local Nusselt numbers for nanofluids containing 0.5 and 1 wt% of nanoparticles are similar. This behavior, which was also previously seen for the bulk temperature, can be justified by the proximity of the velocity profiles in these two nanofluids.
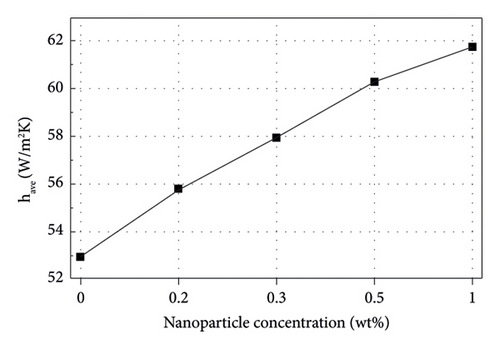
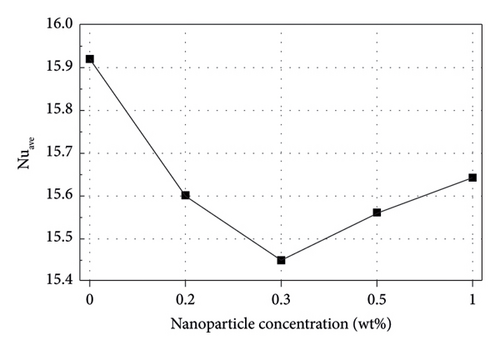
Figures 8(a) and 8(b) show the average values for the convection heat transfer coefficient and Nusselt number of nanofluids with various weight fractions of nanoparticles, respectively. Enhancing the mass concentration of nanoparticles in nanofluids continuously increases the average value of the convection heat transfer coefficient; therefore, the thermal resistance decreases. In addition, increasing the mass dosage of nanoparticles in nanofluids increases their thermal conductivity and decreases thermal resistance. Therefore, the decrease in the thermal resistance of conduction is higher than convection heat transfers up to 0.3 wt% of nanoparticles according to the definition of the Nusselt number. On the other hand, this behavior is inverted for 0.5 and 1 wt% of nanoparticles in nanofluids, and the decrease in the thermal resistance of convection heat transfer would be superior. It finally results in the lowest value for the Nusselt number in 0.3 wt% of nanoparticles in nanofluids.
According to the above explanations, the average velocity is regarded as a crucial item in both the temperature profile and convection heat transfer coefficients. Accordingly, the following sections investigate the influence of the Reynolds number (i.e., 5, 10, and 15) on heat transfer parameters. Due to the nanofluids’ high viscosity and non-Newtonian behavior, increasing the Reynolds numbers to more than 15 in the given geometry was challenging. Since the modeling results for 0.5 and 1 wt% of nanoparticles in nanofluids were almost similar, there is no need to study both; only the former was investigated.
Figure 9(a) depicts the temperature profile at the outlet and across the channel. According to the figure, the fluid temperature increases in the right direction. Moreover, the fluid close to the left plate has the same temperature as the entry fluid, and no temperature gradient exists. This figure illustrates that increasing the Reynolds number increases the temperature gradient close to the hot plate and that the high portions of the channel width experience a zero gradient. This phenomenon can be justified by the decrease in the thickness of both thermal and velocity boundary layers with the increase in the Reynolds number near the hot plate. Considering the theory of the boundary layer in the laminar flow, the thickness of velocity and the thermal boundary layers is inversely related to the Reynolds number. Figure 9(b) indicates the temperature profile inside the channel for diverse Reynolds numbers. This figure states that the boundary layer thickness in each section, alongside the expansion of the temperature gradient, decreases with increasing the Reynolds number (Figure 9(b)). This finally decreases the bulk temperature. To provide readers with a better understanding of the fluid temperature variation inside the channel, its profile for different Reynolds numbers is depicted in supporting information (i.e., Figure S3).
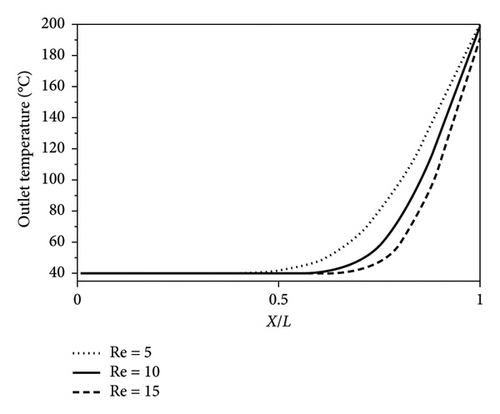
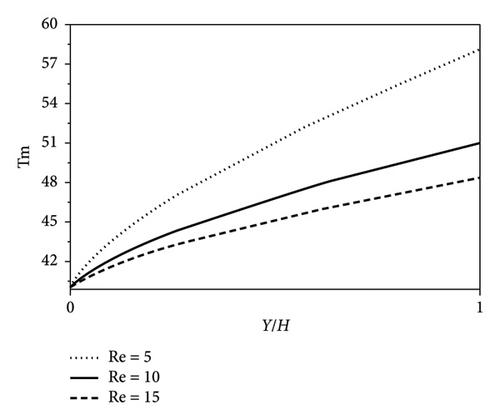
Figure 10(a) depicts the nanofluids’ convection heat transfer coefficient, including 0.5 wt% of GO nanoparticles inside the channel in three different Reynolds numbers (i.e., 5, 10, and 15). Increasing the Reynolds number increases the convection heat transfer coefficient as a result. Table 2 equation (16) justifies that the nanofluid’s convection heat transfer coefficient with a specific nanoparticle concentration has a direct relation with the average velocity (V) and gradient of bulk temperature along the channel (dTm/ dy). On the other hand, it indirectly relates to the temperature difference between the plate and bulk (Ts − Tm). Increasing the Reynolds number increases the fluid’s average velocity and decreases the bulk temperature gradient along the channel (see Figure 9(b)).
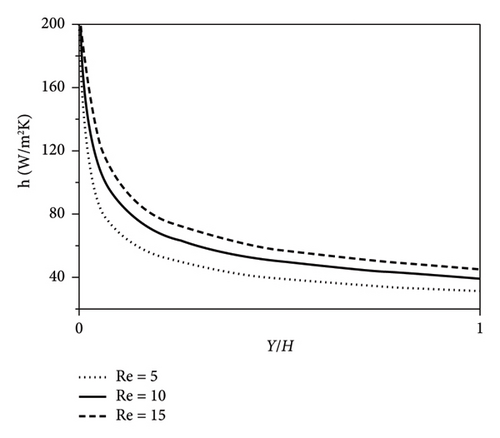
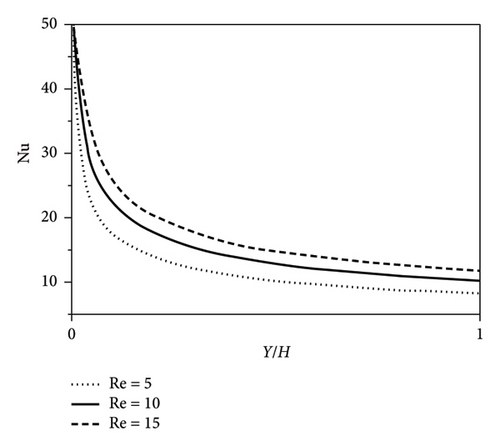
Additionally, the differing temperature between the fluid and plate lessens in each section by increasing the Reynolds number. A variation in these three terms by the Reynolds number intensifies the convection heat transfer coefficient. This analysis justifies the significant effect of average velocity on the convective heat transfer coefficient. It can be concluded from Figure 10(b) that since the Nusselt number depends on the convective heat transfer coefficient, their behaviors are almost similar. It is worth noting that since the concentration of nanoparticles is constant, the conduction resistance of nanofluid also remains constant. Therefore, only the convection resistance changes by the Reynolds number.
3.3. Comparison of Results With the Literature
Unfortunately, we cannot find any research on GO nanoparticles and turbine oil as base fluid. In the literature, there is much research about the heat transfer of common nanoparticles such as metal oxides and carbon-based nanoparticles in water, ethylene glycol, engine oil, and diesel oil. In Table 5, some of these research studies are compared with the results of this work. It seems that the results of this work agree with similar systems.
| Nanoparticle | Base fluid | Geometry | NP wt% | Main result | Ref. |
|---|---|---|---|---|---|
| Graphene | Engine oil | Plate | 0–0.04 | Nuavg = 1.163–1.277 | [53] |
| MWCNT | Turbine oil | Tube | 0.01–0.1 | hnf/hbf = 1.17 − 1.48 | [54] |
| MWCNT | Thermal oil | Vertical rectangular enclosure | 0.1–1.0 | hnf/hbf = 0.78 − 0.99 | [55] |
| MWCNT | Diesel oil | Tube | 0.05–0.5 | hnf/hbf = 1.08 − 1.077 | [56] |
| Graphene | Diesel oil | Tube | 0.05–0.5 | hnf/hbf = 1.074 − 1.22 | [56] |
| Graphene oxide | Turbine oil | Plate | 0–1.0 | hnf/hbf = 1.02 − 1.17 | This work |
4. Conclusion
Heat transfer performances of the GO–oil non-Newtonian nanofluids were investigated both experimentally and theoretically in this study. The required GO nanoparticles were synthesized using a modified method called Staudenmaier. Since neither the physical nor chemical characterizations of the considered nanofluids were studied in the literature, this work measures their specific heat capacity, thermal conductivity, viscosity, and density experimentally. 0.2, 0.3, 0.5, and 1 wt% of GO nanoparticles were selected to be added to the HB-80 oil in this study.
Findings are then used to determine the required physical properties for analyzing the heat transfer of the nanofluids. Finally, mathematical modeling was employed to study heat transfer between two flat plates with constant but unequal temperatures. The results show that increasing the convection heat transfer coefficient in the base fluid up to 17% is possible using GO nanoparticles in the Re = 5, 10, and 15. In addition, the convective heat transfer coefficient increases by 5.5%, 9.5%, 14%, and 17% in exchange for 0.2, 0.3, 0.5, and 1 wt% of GO nanoparticles in the base liquid, respectively. It was also found that the Reynolds number has an eye-catching effect on the heat transfer coefficient and temperature profile along the channel. Moreover, while the nanofluid density, viscosity, and thermal conductivity increase by increasing the nanoparticle concentration by 0.57%, 7.07%, and 18.89%, its specific heat capacity decreases by 0.54%. Future works in this field may utilize regression methods, machine learning techniques, and computational fluid dynamics to analyze the thermophysical and rheological characteristics of the synthesized non-Newtonian nanofluids in the current study.
Conflicts of Interest
The authors declare no conflicts of interest.
Author Contributions
S. H. Esmaeili-Faraj: writing–original draft preparation, conceptualization, methodology, project administration, supervision.
M. J. Bijhanmanesh: writing–original draft preparation, investigation, visualization.
A. H. Alibak: writing–review and editing, data Curation, resources.
T. Pirhoushyaran: writing–review and editing, validation.
B. Vaferi: writing–review and editing.
Funding
No funding was obtained for this study.
Supporting Information
Additional supporting information can be found online in the Supporting Information section.
Open Research
Data Availability Statement
All data generated or analyzed during this study are included in the article and supporting information.


