Optimum Allocation of Microgrid and D-STATCOM in Radial Distribution System for Voltage Profile Enhancement Using Particle Swarm Optimization
Abstract
The integration of microgrid (MG) and distribution static synchronous compensator (D-STATCOM) controller in power system has become crucial for enhancing voltage profiles, improving system reliability, and minimizing power losses in radial distribution networks. This study presents an innovative approach for the optimal allocation of MG and D-STATCOM within a radial distribution system (RDS), aimed at significantly improving voltage profiles. Particle swarm optimization (PSO), a powerful and efficient metaheuristic algorithm, is utilized to determine the optimal sizing of MG and D-STATCOM controllers. The loss sensitivity factor (LSF) technique is employed to find the optimal position for D-STATCOM, and the voltage stability index (VSI) is used to determine the optimal location for MG. To validate the effectiveness of the PSO-based approach, simulations are conducted on a standard IEEE 30 bus RDS. The results indicate that the strategic placement of MGs and D-STATCOMs markedly enhances the voltage profile across the distribution network, leading to improved power quality and reduced technical losses.
1. Introduction
Currently, electrical consumption of energy is growing, yet investments in conventional transmission and distribution systems and the usage of fossil fuels are steadily declining [1]. The power supply companies are then encouraged to face unprecedented problems in terms of meeting load requirements, consumer satisfaction, and environmental considerations. Numerous investigations have shown that 13% of power generation is ineffective in the entire power system because of the higher energy loss values [2]. Due to variations in radial topologies and voltage levels, distribution systems have higher losses than transmission networks [3]. The electrical energy distribution in the range of 10–15 KV is average in the Ethiopian context; however, lower voltage levels are utilized for operational purposes [3]. Radial topology is used in distribution networks to lower investment costs in conductors and protection elements. One significant issue is that it results in a large proportion of energy losses [4].
In the Ethiopian distribution system, energy losses from the electric system range between 1.5% and 2.5% of the net energy produced. However, the energy loss in networks with average voltage varies from 5% to 18% [5, 6]. Less than 10% of networks experience loss, which is partially attributed to legal regulations and the fact that maintenance is performed. Many approaches to reducing technical loss in distribution networks are demonstrated in the literature. Hence, the integration of microgrid (MG) [7], reconfigurations of primary feeders [8], connections of shunt capacitors, and Flexible Alternating Current Transmission System (FACTS) devices [9, 10] are considered.
In particular, distribution systems with a long power supply distance and a weak network structure benefit greatly from the use of MGs. These benefits include shifting peak loads, lowering network losses, boosting system reliability, improving voltage profiles, and so on [11]. However, a few factors need to be taken into account, including the number and size of MG units, the best location, and the bus configuration [3]. The optimal location and size of MG in distribution networks have been investigated in the literature from different perspectives.
First, from the viewpoint of MG modelling, most of the research studies consider nondispatchable MG such as photovoltaic (PV) and wind turbines (WTs), whose outputs are indeterminate and hard to designate due to the volatility and intermittency of environmental influences (e.g., solar insolation and wind speed) [12]. This causes a variation in voltage profiles and an increment in power losses which can increase power quality issues [13].
The uncertain outputs of MG which impact power quality issue are modelled using artificial intelligence algorithms and stochastic theory [6]. To solve the power quality issues, fixed capacitor banks and synchronous condensers have been in use for several years [14]. Nevertheless, such compensation of reactive power has certain disadvantages that comprise high losses, slow response time, rigidity, high cost, and large dimensions. In addition, they may cause overvoltage or resonance problems and introduce harmonics into the system, and they may not be effective for long-distributed loads. To confront the operational challenges associated with monitoring, processing, and control of power systems, FACTS devices were habituated and established [15]. The most regularly used converter in the FACTS family due to its fastest response in reactive power compensation is the distribution static synchronous compensator (D-STATCOM). Using D-STATCOM, power quality problems are compensated [16]. D-STATCOM is used for reactive power compensation, which in turn minimizes power losses and voltage disturbances [17]. The optimal solution is obtained after solving several power flow solutions corresponding to a specified set of consumer demands [18]. The importance of the optimum size and location of MG in the radial distribution system (RDS) is described in [19]. Power loss and voltage disruption in a distribution system are the main important factors for RDS [20].
Second, regarding optimization objectives, previous investigations have concentrated on distinct targets based on different planning circumstances. In [11], the objective function for determining the most suitable MG and D-STATCOM allocation scheme and the entire investment cost, operational cost, and maintenance (O & M) costs, as well as network losses, are fully taken into consideration in [14]. A power outage has been converted into a reliability cost and added to the objective function [21]. In [22], MG and D-STATCOM allocation in a RDS for mitigation of overloading of lines, quality, reliability, and power losses have been presented. However, optimal MG and D-STATCOM allocation (i.e., location and sizing) are the stimulating issues to advance system efficiency by decreasing power losses and by enhancing the voltage reliability and security of the network [23].
Third, the optimization models of both MG and D-STATCOM management are always solved using mathematical techniques, intelligence search methods, and review from the perspective of solution algorithms. Mathematical approaches are extra reliable in catching universal optimal solutions; however, they are always not directly pertinent for MG and D-STATCOM development problems due to the complexity and nonconvexity of optimization models. To simplify the model and facilitate its mathematical solution, a piecewise linear approximation is employed [24].
Intelligence search methods are easy to use and constantly proficient for solving upsetting optimization models, but they are time-consuming and easily lead to locally optimal solutions instead of globally optimal solutions. Genetic algorithm (GA), particle swarm optimization (PSO), GA-PSO hybrid algorithm, honey bee mating optimization (HBMO), and ant colony optimization (ACO) are, respectively, utilized in [23–26].
Almost all the reviewed studies focused on modelling MG and D-STATCOM for integration in the network for the optimum operation of the system. However, additional techniques to increase system accuracy were not utilized. In this study, the PSO algorithm is developed with supplementary techniques such as voltage stability index (VSI) and loss sensitivity factor (LSF) for solving the optimal location and sizing of D-STATCOM and MG in the distribution networks. The most suitable location for installing MG in the distribution system is determined by VSI, and the optimal location of D-STATCOM is determined by the LSF method. The framework of this document is as follows. The research methodology is described in depth in Section 2, the simulation findings and discussions are presented in Section 3, and the study’s conclusion is presented in Section 4.
2. Methodology
2.1. Power Flow Analysis
The current and voltage measurements of the network in each bus and the active and reactive power flows in each line are analyzed using the power flow analysis method. The power flow equations derived depend on the conventional power flow algorithm, which is essentially significant in transmission networks yet irrelevant for RDSs because of its inherent characteristics (low reactance to resistance ratios (X/R)) [14]. Thus, the conventional power flow strategies, for example, Gauss–Seidel, Newton–Raphson, and so forth, are not effective for the distribution system. The single-line diagram of simple RDS is depicted in Figure 1 [15].

2.2. Direct Load Flow (DLF) Analysis in RDS
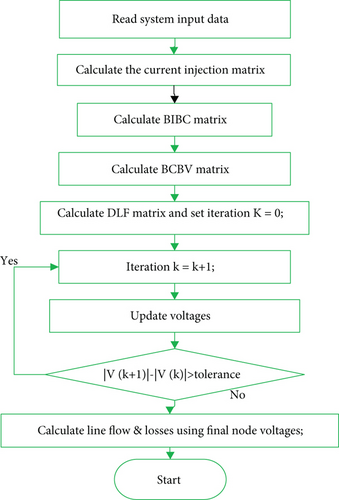
A feeder carries power from the substation to load in the RDS. To govern the total power loss of the system or each feeder branch, the maximum voltage deviation (VD) is resoluted by performing load flow. Hence, a DLF technique is used to find the voltage profile and the total power loss of RDS. In this distribution power flow algorithm, bus injection to branch current (BIBC) matrix and branch current to bus voltage (BCBV) matrix power flow techniques are developed. Based on the DLF analysis, the complex power flow (Si) of bus i can be expressed in [27].
The BIBC matrix provides an easy relationship between node current injections and branch currents.
The RDS power flow algorithm flow chart is given in Figure 2.
2.3. D-STATCOM
D-STATCOM is a shunt system capable of injecting and absorbing real or reactive power on the bus, thereby eliminating the sag in bus voltages [30]. It is a voltage-source inverter with a DC energy storage unit or a DC link capacitor for constant DC voltage delivery [31]. The bus voltage and power factor are regulated and corrected by D-STATCOM since it acts as a synchronous source of voltage. The modelling, working principle, and block diagram of D-STATCOM are detailed in [32].
2.4. MG Configuration and Modelling
2.4.1. MG Configuration
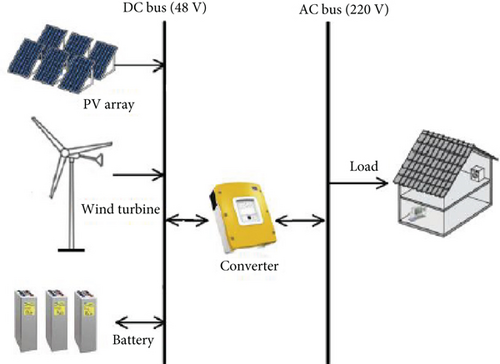
The MG uses PV and wind energy sources to provide power during regular operation and to operate it in grid-connected mode. A storage device is required to provide electric power to the load during lean times since solar radiation and wind speed are erratic and seasonally dependent. The whole MG setup for this study is illustrated in Figure 3.
2.4.2. Component-Wise Modelling
2.4.2.1. Modelling of Solar PV
2.4.2.2. Modelling of WTs
Fixed-speed and variable-speed WT generators (WTGs) are the two main types of WTGs utilized as DERs in MGs. A squirrel cage induction generator operating in the fixed speed category is the most basic type of WT [35]. Another important type is the permanent magnet synchronous generator (PMSG) [36]. Even though double-fed induction generators (DFIGs) are the most often utilized WTGs, their variable-speed operation is in sync with the grid frequency [37]. The multitude of events that are involved in induction/asynchronous generator modulating, such as the dynamics of the stator and rotor flux, core losses, magnetic saturation, and skin effect, contribute to the modulation’s extreme complexity.
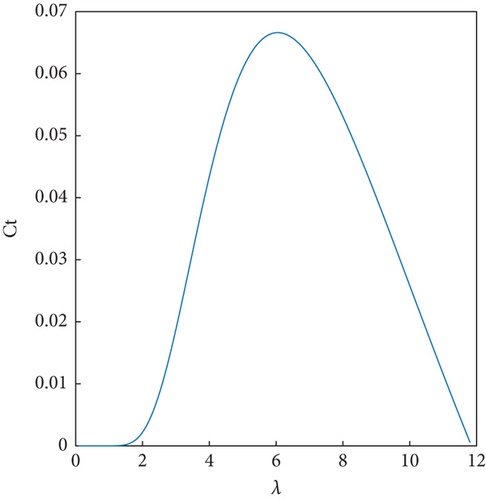
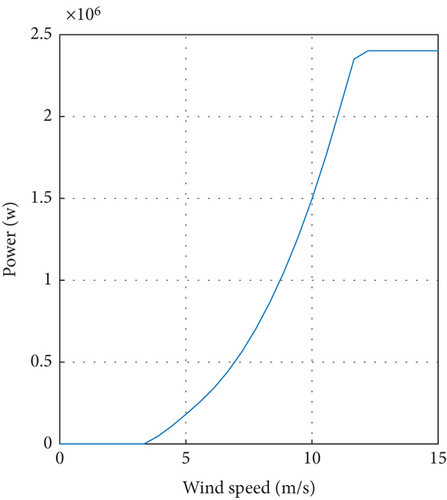
Cp is a power coefficient, which varies with the tip speed ratio of the WT (λ), pitch angle (β), and air density (ρ = 1.225 kg/m3). Based on the equations driven above, the MATLAB-simulated characteristics of a WT are given in Figure 4. Figure 4(a) shows the characteristics of a WT as a function of lambda and power coefficient, and Figure 4(b) illustrates the wind speed and extracted mechanical power relationships. From Figure 4, the extracted mechanical power depends on wind speed. When the wind speed is 10 m/s, the output power reaches 1.5 MW, while 2 MW is generated at the wind speed of 12 m/s.
2.5. VSI
A variety of voltage and power stability indices, including the VSI, power stability index (PSI), and LSF, are available in the literature and can be used to identify the power system security level. VSI, as described in [24], can be used in this investigation to identify the voltage-collapsed nodes. Equation (12) has been used to determine the VSI at each node.
By using the PSO algorithm, the optimal size of the MG at RDS buses is estimated.
2.6. LSF
LSFs are determined at each bus based on Equation (13), and the buses are ordered in descending order. Higher bus LSF values increase the likelihood of placing D-STATCOM. The PSO algorithm is used to estimate the D-STATCOM size of candidate buses.
2.7. Real Power Loss Equation
2.8. VD
2.9. Objective Function
2.9.1. Power Balance Constraint
2.9.2. Voltage Limit Constraint
2.9.3. Real Power Limits of Generation
2.9.4. Reactive Power Limits of Generation
2.9.5. Reactive Power Compensation Constraint
2.10. PSO
2.11. Step by Step Algorithm
The optimal placement and sizing of MG and D-STATCOM in an RDS using PSO for reduction of power losses along with voltage profile improvement takes the following steps.
Step1: Get the input data (i.e., bus data, line data, real, and reactive powers).
Step 2: Compute total power losses and bus voltage using distribution load flow based on the DLF method.
Step 3: Set the bus count C = 2.
Step 4: Set the generation count j = 0.
Step 5: Generate an initial population randomly with random positions and velocities.
Step 7: Check the bus voltage whether it lies within the limits or not. If the bus voltage does not lie on the limit, then the particle is infeasible.
Step 8: Compare the objective value with the individual Pbest value of the particle.
Step 9: Choose the particle associated with the lowest individual Pbest of the entire particles and set the value of Pbest as the present overall best “Gbest.”
Step 10: Update the position and velocity of the particle using Equations (23) and (24).
Step 11: Go to Step 12 if the generation number reaches the maximum limit or set the generation index to j = j + 1, and go back to Step 5 if the generation number has not reached the maximum limit.
Step 12: If the bus counts the maximum limit, go to Step 13, otherwise set the bus count to C = C + 1 and go back to Step 4.
Step 13: Print out the optimal solutions.
3. Result and Discussion
- i.
Scenario 1: Base caseload flow results.
- ii.
Scenario 2: Base case with MG and D-STATCOM.
In this test system, the distribution system is connected to a 12.66 KV voltage at the secondary side of the transformer. The active and reactive power loaded in the system are 3.75 MW and 2.33 MVAR, respectively. The bus and line data for the IEEE 30 bus system have been taken in [45].
3.1. Scenario 1: Base Case Power Flow Results in RDS
The base-case power flow analysis is performed using the DLF analysis algorithm without integrating MG and D-STATCOM in the distribution network. The voltage profile results of all buses, as well as active and reactive losses in the distribution system, are computed and presented in Table 1.
| Bus number | Voltage profile (p.u.) | Active power losses in (p.u.) | Reactive power losses in (p.u.) |
|---|---|---|---|
| 1 | 1 | 1 | 0.65571 |
| 2 | 0.9974 | 0.652 | 0.4896 |
| 3 | 0.9852 | 0.361 | 0.266 |
| 4 | 0.9791 | 0.2807 | 0.17678 |
| 5 | 0.9731 | 0.1507 | 0.1248 |
| 6 | 0.9683 | 0.232 | 0.15771 |
| 7 | 0.9583 | 0.2275 | 0.1269 |
| 8 | 0.9500 | 0.212 | 0.1253 |
| 9 | 0.9438 | 0.2042 | 0.0749 |
| 10 | 0.9382 | 0.2009 | 0.1209 |
| 11 | 0.9373 | 0.20071 | 0.1056 |
| 12 | 0.9359 | 0.14205 | 0.0849 |
| 13 | 0.9298 | 0.13741 | 0.06494 |
| 14 | 0.9276 | 0.1219 | 0.0538 |
| 15 | 0.9262 | 0.1004 | 0.03241 |
| 16 | 0.9248 | 0.1028 | 0.03829 |
| 17 | 0.9228 | 0.066 | 0.0142 |
| 18 | 0.9222 | 0.0529 | 0.0265 |
| 19 | 0.9969 | 0.0497 | 0.00818 |
| 20 | 0.9933 | 0.0288 | 0.01783 |
| 21 | 0.9926 | 0.02765 | 0.0197 |
| 22 | 0.9919 | 0.2112 | 0.11894 |
| 23 | 0.9816 | 0.2011 | 0.10774 |
| 24 | 0.9749 | 0.013947 | 0.01526 |
| 25 | 0.9716 | 0.1325 | 0.1125 |
| 26 | 0.9571 | 0.2159 | 0.21685 |
| 27 | 0.9556 | 0.2553 | 0.2115 |
| 28 | 0.9486 | 0.2549 | 0.2115 |
| 29 | 0.9438 | 0.2591 | 0.21327 |
| 30 | 0.9436 | 0.2231 | 0.2109 |
As it can be noted in the table, the voltage profile of buses from Bus 9 to Bus 18 and from Bus 28 to Bus 30 is below the standard voltage limits (0.95–1.05 p.u.), and this infers that the far-end customers frequently suffer from under-voltage problems. The base-case active and reactive power losses of the system are also calculated and presented in Figure 5. In general, the power losses are significant in magnitude, as shown in Table 1 and Figure 5. Also, the voltage profile of the system is tremendously poor, which in turn marks the performance of the distribution system very weak.

3.2. Scenario 2: Optimal MG and D-STATCOM Integration
The IEEE 30 bus test system is used in this study to verify the applicability of the suggested optimal allocation technique. In the base-case simulation, the optimal real and reactive power losses are 0.209814 MW and 0.12464 MVAr, respectively, as shown in Table 2. The minimum voltage is 0.9222 p.u. in Bus Number 18, and the VSI in this bus is 0.7864 p.u.
| Case 1 | Case 2 | |
|---|---|---|
| Optimal size and location of MG | — | 3.2 MW at Bus 18 |
| Optimal size and location of D-STATCOM | — | 1.5 MW at Bus 17 |
| Vin (p.u.) | 0.9222 | 0.9680 |
| VSImin (p.u.) | 0.7864 | 0.9108 |
| Optimum real power loss (MW) | 0.209814 | 0.063532 |
| Optimum reactive power loss (MVAR) | 0.12464 | 0.052341 |
| Real power loss reduction (%) | — | 69.72 |
| Reactive power loss reduction (%) | — | 58 |
In Scenario 2, MG and D-STATCOM are sized and integrated at optimal places in the distribution network using LSF and VSI-based PSO algorithms. Hence, the simulation is conducted, and the results are presented in Table 2. 3.2 MW MG and 1.5 MVAr D-STATCOM are placed at Bus 18 and Bus 17, respectively. The optimal active power loss of the system is 0.063532 MW. In this scenario, the minimum voltage is 0.9680 p.u., which has been improved compared to the base-case value (0.9222 p.u.). Similarly, the minimum VSI is 0.9108 p.u., which is also improved as compared to the base-case value (0.7864 p.u.). Figure 6 shows the comparison of voltage profiles before and after MG and D-STATCOM integrations using PSO.
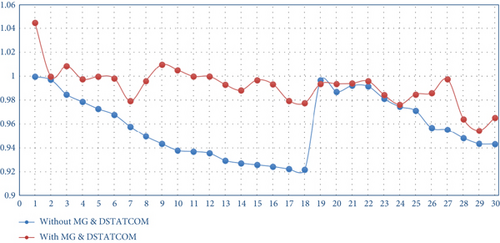
As shown in Table 2, the voltage profile of the system is boosted while the real power losses are decreased after the integration of MG and D-STATCOM. It is also observed that all bus voltages are within the IEEE standard acceptable limit (0.95–1.05 per unit). Figure 7 shows the comparison of voltage profiles before and after MG and D-STATCOM integrations. Before the integration of the MG and D-STATCOM, the lowest voltage was 0.9222 p.u. at Bus 18 which is below the acceptable limit, whereas all the voltage profiles at each bus were above the limit bus voltage standards after integration of the MG and DSATCOM.
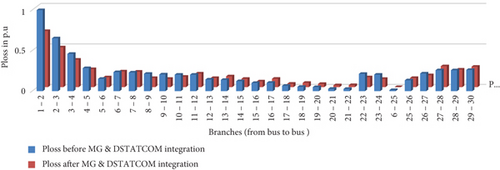
Figure 7 presents the real power loss comparison before and after the placement of the MG and D-STATCOM at their respective optimal locations. It can be inferred that the real power losses before and after the placement of the MG and D-STATCOM are different. The change in real power loss is mainly due to the placement of the MG and D-STATCOM which increased real power and decreased reactive power, respectively.
4. Conclusion
This paper presents the best size and optimal placement of MG and D-STATCOM using the PSO technique to boost the voltage profile and reduce the real power losses. The LSF method is utilized to find a suitable location for D-STATCOM, and the VSI is utilized to determine the suitable location for MG. The PSO algorithm is mainly employed to find the optimal sizing of MG and D-STATCOM in RDSs. A constrained nonlinear problem was applied to the IEEE 30 bus RDS to authenticate its validity. Finally, the results proved that both the MG and D-STATCOM sizes, as well as placement using the PSO algorithm, have a critical inspiration in reducing real power losses and boosting the voltage profile of the network.
Conflicts of Interest
The author declares no conflicts of interest.
Funding
The author received no specific funding for this work.
Open Research
Data Availability Statement
The data used to provision the findings of this work are accessible from the corresponding author upon request.


