Probabilistic Energy Management of DGs and Electric Vehicle Parking Lots in a Smart Grid considering Demand Response
Abstract
In this paper, a novel model of an energy management system (EMS) for a microgrid (MG) under uncertain conditions is proposed. The MG consists of renewable photovoltaic and wind sources along with electric vehicle parking lots. Hence, the model incorporates the uncertainties of renewable DGs, parking lots, and also load. In this study, the MG operation cost and voltage stability index are considered objective functions. A novel combined algorithm (hMOPSO-HS) is proposed for microgrid energy management. The hMOPSO-HS algorithm is a combination of the mutant multiobjective particle swarm optimization (MOPSO) algorithm and the harmony search (HS) algorithm. The simulations are performed in two parts, with and without considering the uncertainty. The comparative analysis involves evaluating the optimization outcomes achieved by the hMOPSO-HS algorithm in contrast to various other metaheuristic algorithms for multiobjective optimization. The simulation findings validate the superior efficacy of the hMOPSO-HS algorithm compared to other approaches. Also, the simulation results showed that in the conditions of uncertainty, the operating cost is 6.1% higher and the microgrid stability index is 6.8% lower. Also, considering the uncertainty has caused the penalty for energy not supplied (ENS) and demand response program (DRP) costs to increase by 3% and 4%, respectively.
1. Introduction
Energy management in microgrids (MGs) is a crucial aspect of power system studies. It encompasses various objectives, including cost reduction, emission reduction, enhanced reliability, and improved power quality. A microgrid typically comprises key components such as power sources, electrical storage, and loads. The DGs in a microgrid can be renewable, such as photovoltaic (PV) arrays and wind turbines (WTs), or nonrenewable sources as well as microturbines. Additionally, electrical energy storage can be achieved through battery storage banks or electric vehicle (EV) parking lots (PLs). Smart parking lots integrated into the microgrid provide various functionalities, including improvements in system power quality and also reliability, maintaining voltage stability, minimizing losses, and increasing profitability for EV owners [1]. Maximizing profitability and enhancing reliability are crucial aspects of smart parking utilities, particularly in their significance. To achieve these objectives, a comprehensive scheduling approach is required for EV charging and discharging programming. In recent years, a plethora of research investigations has been carried out in the domain of EMS, delving into diverse concepts and methodologies [2].
In [3], a novel approach is presented for coordinating the EV charging in the MG. The method aims to improve MG reliability by minimizing the charging costs of EVs. To achieve this, it considered the electric energy price uncertainty in the market and the charging time of EVs. In [4], a daily energy management model is introduced to enhance MG reliability in the context of a substantial number of electric vehicles (EVs) being present. The model allows vehicle owners to manage energy consumption during their travels through effective energy management techniques. In [5], a simulation technique utilizing probabilistic indices is employed to enhance the reliability of MGs with DG sources and EVs, particularly in island mode. In [6], an efficient objective function is put forth to diminish the operational costs of an MG with a significant number of EVs and DGs. In [7], the study focuses on the calculation details of MG reliability that incorporates both DG sources and EVs. [8] presents an economic-based optimization approach for EVs in the MG, specifically considering cogeneration, while also taking into account MG reliability indexes as operational constraints. In [9], the energy not supplied criterion (ENS) and the time of MG connection to the network are utilized to evaluate MG reliability. [10] investigates both economic and reliability aspects of the MG, using real-time pricing for power exchange transactions of the MG and parking lots (PLs) and employing a probabilistic method to calculate network reliability with and without DG sources and EVs. [11] proposes an energy management system for EV charging in the power system through a DRP, aiming to reduce operation costs and enhance MG reliability, with customer participation encouraged for effective energy management. [12] employs a DRP to improve distribution network characteristics, leveraging EV charging stations to enhance network reliability, with simulation results showing a significant reduction in ENS value through load response programs and scheduled EV charging. [13] introduces an intelligent algorithm based on neural networks for the microgrid EMS, highlighting the impact of DR on MG power exchange and EV charging/discharging. [14] proposes an optimal EMS approach for a MG incorporating PV panels, EVs, and responsive loads, considering load uncertainty and indicating a cost reduction of about 2.5% with the use of DR programs. [15] focuses on MG energy management with peak load management, aiming to reduce operating costs using time of use (TOU) pricing, incorporating an error function to calculate uncertainty in different scenarios. [16] defines demand response programs (DRPs) as changes in electricity consumption patterns in response to time-varying prices, including incentive payments to reduce consumption during high-price or reliability issue periods. [17] explores DRPs through pricing methods that incentivize consumers to shift their electricity demand away from peak times, highlighting the advantage of avoiding expensive peak-time power plant construction. In [18], a demand DRP is introduced for grid-connected EVs. The primary aim of this study is to conduct a comparative analysis of different approaches for managing EVs in the day-ahead scenario.
In [19], the study addresses the optimal scheduling of electric vehicle (EV) charge and discharge, taking into account uncertainty in electricity prices. The objective function is designed to maximize network profitability. [20] focuses on microgrid (MG) energy management with EVs and DG sources, aiming to improve MG reliability indices while considering uncertainties associated with DGs. [21] presents an optimal EV charge and discharge strategy considering uncertainties in EV and DG operations, with the objective function aimed at cost reduction and pollution mitigation based on probabilistic behaviors of EV and wind turbine charging and discharging. [22] introduces a scheduling method for optimizing the utilization of MG infrastructure during nonpeak times for EV charging, considering environmental and economic factors to effectively integrate a significant number of electric vehicles (EVs) into the network accounting for their uncertainties. In [23], a novel approach to microgrid EMS is proposed, considering the presence of electric vehicles (EVs), aiming to achieve maximum profitability in the standard 33-bus power system by reducing generation costs considering uncertainties in energy market prices and EV charging times. In [24], an energy management system is proposed that takes into account the uncertainties associated with electric vehicles and wind turbines.
- (i)
Assess the probabilistic EMS of EV parking lots and renewable DGs with the objectives of cost reduction and enhancement of system voltage stability
- (ii)
A novel weighted objective function is introduced, which takes into account the probability of scenario occurrence
- (iii)
A new innovative hybrid multiobjective algorithm with high accuracy is proposed
2. Problem Formulations
For an MG study, there is an essential need to provide a suitable model of the MG to consider the uncertainties. Various goals such as cost reduction, improved voltage stability index, reliability, and power quality are desired and are considered for MG energy management. Ensuring the provision of electrical energy at the lowest cost while minimizing the occurrence of blackouts is of utmost importance [25]. In the subsequent sections, we present the formulation of objective functions for the EMS problem in a MG under uncertain conditions.
2.1. Proposed Objective Functions
The initial objective function pertains to the MG cost with the PL.

2.2. Constraints
2.2.1. Generation and Load Balance Constraint
2.2.2. DG Constraints
2.2.3. Power System Constraint
2.2.4. Parking Lot Constraints
In equations (13) and (14), Ω and Ψ denote the maximum charging and discharging rates of the nth electric vehicle (EV) battery, respectively. The energy stored in the EV batteries must satisfy predetermined lower and upper limits, as expressed in equations (13) and (14).
3. Uncertainty Modeling
3.1. The Proposed Model Incorporates Uncertainties
Given the increasing trend of MG privatization and the dynamic nature of load and production, managing uncertainties is crucial for ensuring the power system’s reliability, operation, and control. The MG uncertainty emerges due to the absence of accurate data on the MG parameters. The primary sources of the MG uncertainty include variations in parameters over time, unanticipated dynamics, and measurement errors.
3.1.1. Electrical Demand Uncertainty
3.1.2. Irradiation Uncertainty
3.1.3. Wind Turbine Model
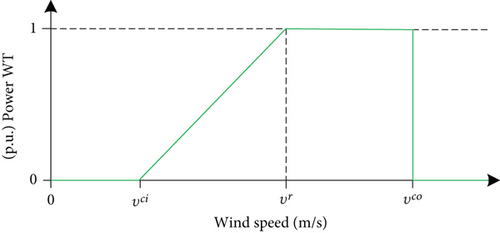
3.1.4. The PL Uncertainties
| Arrival | K | Ω |
| 18.91 | 5.90 | |
| Departure | μ | σ |
| 2.21 | 0.30 |
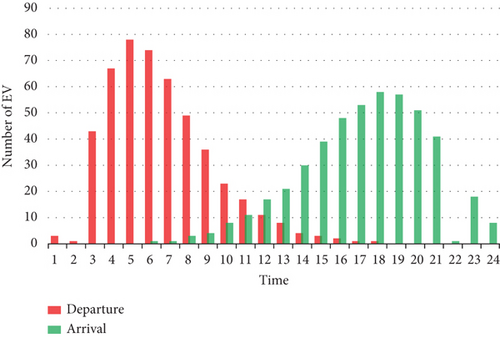
Figure 3 illustrates the amount of EV arrivals and their departures, based on the parameters of the probability density functions (PDFs) [35].
The initial conditions of battery charging are influenced by several factors, such as distance traveled, kind of the EV battery, and its efficiency. Due to the variations in these parameters across EVs, the remaining energy in the batteries can be calculated probabilistically. This study encompasses three modes of charging and discharging ratio. The initial battery charge and the nominal charging and discharging ratios are selected based on the obtained scenario from Figure 4 PDFs. The scenario distribution curves presented in this approach are categorized into three zones for the initial SOC and five zones for the charge/discharge ratio.
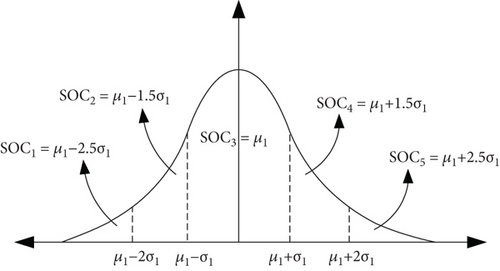
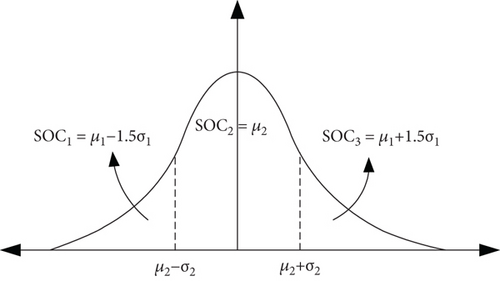
It is worth mentioning that the PDF curve is estimated using the information provided in Table 2.
| SOC | Maximum charge\discharge rate | ||
|---|---|---|---|
| Discharge mode | Discharge mode | ||
| Mean | 72 | 26 | 10 |
| μ | 2.6 | 1.7 | 1.1 |
| SOC | Charge and discharge ratio | (πs) | |
|---|---|---|---|
| S1 | μ1 − 2.5σ1 | μ2 − 1.5σ2 | 0.0035 |
| S2 | μ1 − 1.5σ1 | μ2 − 1.5σ2 | 0.0182 |
| S3 | μ1 | μ2 − 1.5σ2 | 0.0966 |
| S4 | μ1 + 1.5σ1 | μ2 − 1.5σ2 | 0.0182 |
| S5 | μ1 + 2.5σ1 | μ2 − 1.5σ2 | 0.0035 |
| S6 | μ1 − 2.5σ1 | μ2 | 0.018 |
| S7 | μ1 − 1.5σ1 | μ2 | 0.0936 |
| S8 | μ1 | μ2 | 0.4936 |
| S9 | μ1 + 1.5σ1 | μ2 | 0.0936 |
| S10 | μ1 + 2.5σ1 | μ2 | 0.018 |
| S11 | μ1 − 2.5σ1 | μ2 + 1.5σ2 | 0.0035 |
| S12 | μ1 − 1.5σ1 | μ2 + 1.5σ2 | 0.0182 |
| S13 | μ1 | μ2 + 1.5σ2 | 0.0966 |
| S14 | μ1 + 1.5σ1 | μ2 + 1.5σ2 | 0.0182 |
| S15 | μ1 + 2.5σ1 | μ2 + 1.5σ2 | 0.0035 |
In this equation, πEV represents the probabilities associated with the charging and discharging ratio. Additionally, πSOC denotes the probability of the initial SOC in scenarios.
3.2. Monte Carlo Simulation
In this research, the Monte Carlo simulation (MCS) is employed to generate the required scenarios for energy management within the microgrid.
The MCS is a stochastic approach employed to predict the behavior of components within the MG. The following are the essential stages involved in estimating uncertainty using the MCS [38, 39]:
Step 1. Develop the mathematical representation of the measurement.
Step 2. Assign PDFs to the inputs.
Considering the PDFs for the input (Xi), the inputs are independent.
Step 3. Obtain the PDFs for the outputs.
A significant random value (M) is generated for each input based on its respective distribution function. These generated random values for each input are subsequently fed into the mathematical model of the measurement system. By employing the mathematical models, the corresponding M value is obtained as the output variable. Ultimately, by utilizing the computed values, the probability density function of the output variable can be determined.
Step 4. Estimate the uncertainty of the measurement.
During this stage, the PDF of the output quantity (Y) is utilized to calculate the mathematical expectation of Y (estimated value of the output quantity). The standard deviation of Y is determined as a measure of the standard uncertainty associated with the output variable. Additionally, the certitude distance, taking into account Y, is determined to specify the probability.
- (i)
No knowledge of the exact value of the transfer function f is required in the MCS to calculate Y. This allows the problem to be treated as a black box that accepts samples and produces the corresponding output
- (ii)
The MCS performs effectively in complex and high-level systems
- (iii)
The MCS accommodates various types of probability density functions
- (iv)
The MCS is simple and easy to implement
4. Proposed Optimization Algorithm
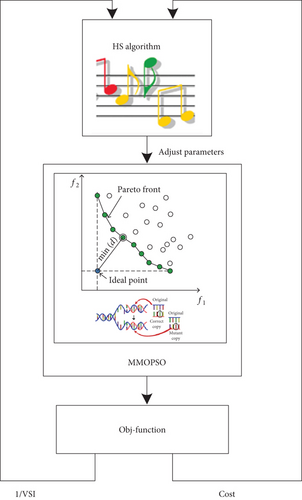
The proposed hMOPSO-HS algorithm is a combination of the MOPSO and HS algorithms. In the proposed algorithm, genetic mutations are applied to the MOPSO algorithm and subsequently, during each iteration of the algorithm, the parameters are effectively fine-tuned using the harmony search algorithm. The mechanism of the proposed algorithm is shown in Figure 5.
- (1)
If xk(t + 1) dominates , then
- (2)
If the current dominates xk(t + 1), then
- (3)
If no clear dominance exists among the solutions, a random selection is made to determine the from the available options
In the same way, all variables of a harmony are created and then the value of that harmony is calculated according to the objective function, and they are compared with the worst harmony in the matrix memory. If it is better than the worst harmony in the matrix memory, the new harmony is replaced with the previous one. The condition for stopping the algorithm is to achieve maximum iteration. The schematic diagram illustrating the MOPSO-HS algorithm is depicted in Figure 6.
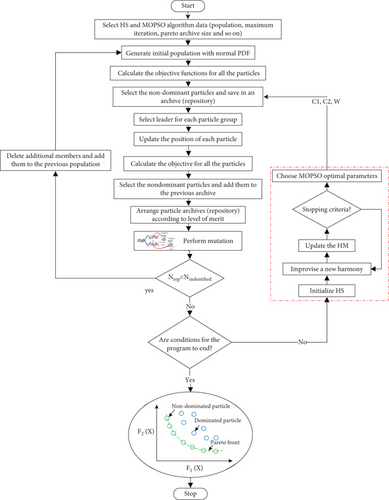
The pseudocode of the proposed hMOPSO-HS algorithm is given in Algorithm 1.
-
Algorithm 1: The pseudocode of the proposed hMOPSO-HS algorithm.
-
Start
-
• Select the hMOPSO-HS algorithm parameters
-
• Initialize the HS population. (Select randomly C1, C2 and ω)
-
• While Iter1< Maximum Iteration
-
• For all HS populations do
-
• Initialize the MOPSO population.
-
• Calculate objective functions for all the particles.
-
• Select non-dominated populations and store them in the repository.
-
• Choose the best result.
-
• While Iter2< Maximum Iteration
-
• For all MOPSO particles do
-
• Update C1, C2, ω.
-
• Update MOPSO population positions.
-
• Choose a non-dominated population and update the repository.
-
• Find the best result.
-
end for
-
• Iter2=Iter2+1;
-
• end while
-
• Improvise new harmony
-
• Update HM
-
• end for
-
• Iter1=Iter1+1;
-
• end while
-
End
5. The Understudy Microgrid
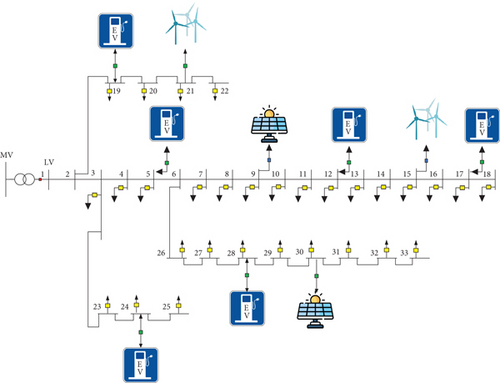
Figure 7 illustrates the test system employed as a microgrid (MG) in this study [41–43]. The understudy microgrid incorporates two 500 kW WTs located at bus 15 and bus 21, as well as two 500 kW PV arrays situated at buses 9 and 30. Furthermore, the MG includes six 500 kW parking lots positioned at buses 5, 12, 17, 19, 24, and 28. The wind velocity and irradiation data utilized in the analysis are obtained from the McHenry precinct of the North Dakota region [44]. Moreover, the load flow calculations are carried out using the forward-backward sweep (FBS) method.
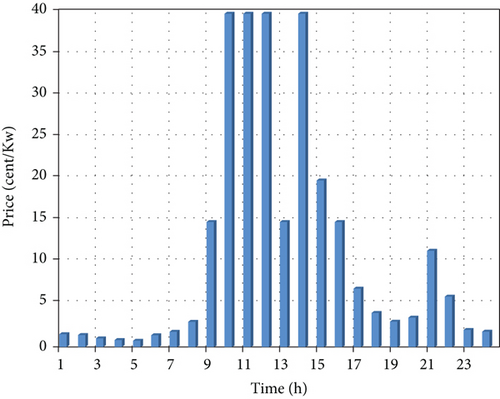
An energy management period of 24 hours is carried out to facilitate the charging and discharging operations of EVs. The power exchange between PLs and the MG involves a total of 500 EVs. These EVs are assumed to be of the Chevrolet model, based on the technical specifications provided in [44]. Each EV has a battery capacity of 16 kWh, and the maximum charging and discharging power for each EV is set at 5 kW. The electricity prices procured from the upstream network for each hour are illustrated in Figure 8 [45].
6. Simulation Results Analysis
The simulations are performed in three parts. Firstly, the performance of the hMOPSO-HS algorithm is assessed by conducting optimization on several benchmarks. In the second part, the simulation is done regardless of the uncertainties and with the predicted definite data, and in the third part, the uncertainty is considered by selecting 15 scenarios from the MCS. To achieve the optimal energy management of MG in two cases, multiobjective particle swarm optimization (MOPSO) algorithm, nondominated sorting genetic algorithm (NSGAII), multiobjective differential evolution (MODE), multiobjective gray wolf optimization (MOGWO), and also the hMOPSO-HS algorithm is used.
6.1. First Section of the Simulation Results (Algorithm Performance Evaluation)
In this part, the hMOPSO-HS performance is assessed by conducting optimization on the CEC′09 benchmark functions [46]. The optimization process covers both unconstrained test functions UF1–UF10 and constrained test functions CF1–CF7 using the hMOPSO-HS algorithm. The acquired outcomes are subsequently contrasted with diverse multiobjective algorithms. The performance assessment is based on the calculation of the inverse generational distance (IGD). Smaller values of the IGD index indicate a smaller discrepancy between the values of the actual Pareto front and the Pareto front obtained through the optimization algorithm. After solving UF1-UF10, the corresponding IGD values were calculated and presented in Table 4.
| UF1 | UF2 | UF3 | UF4 | UF5 | UF6 | UF7 | UF8 | UF9 | UF10 | |
|---|---|---|---|---|---|---|---|---|---|---|
| hMOPSO-HS | 0.005743 | 0.004373 | 0.048562 | 0.053022 | 0.071675 | 0.062543 | 0.05348 | 0.061612 | 0.057973 | 0.180345 |
| MOPSO | 0.006115 | 0.005784 | 0.043003 | 0.049105 | 1.930803 | 0.610471 | 0.008268 | 0.236419 | 0.175671 | 0.526617 |
| MOABC [47] | 0.00618 | 0.00484 | 0.0512 | 0.05801 | 0.077758 | 0.06537 | 0.05573 | 0.06726 | 0.0615 | 0.19499 |
| MOEAD [47] | 0.00435 | 0.00679 | 0.00742 | 0.06385 | 0.18071 | 0.00587 | 0.00444 | 0.0584 | 0.07896 | 0.47415 |
| GDE3 [47] | 0.00534 | 0.01195 | 0.10639 | 0.0265 | 0.03928 | 0.25091 | 0.02522 | 0.24855 | 0.08248 | 0.43326 |
| MOEADGM [47] | 0.0062 | 0.0064 | 0.0429 | 0.0476 | 1.7919 | 0.5563 | 0.0076 | 0.2446 | 0.1878 | 0.5646 |
| MTS [47] | 0.00646 | 0.00615 | 0.0531 | 0.02356 | 0.01489 | 0.05917 | 0.04079 | 0.11251 | 0.11442 | 0.15306 |
| LiuLi algorithm [47] | 0.00785 | 0.0123 | 0.01497 | 0.0435 | 0.16186 | 0.17555 | 0.0073 | 0.08235 | 0.09391 | 0.44691 |
The lower values of IGD indicate the superior performance of the proposed hMOPSO-HS algorithm in finding optimal solutions. Figure 9 displays the Pareto front for UF1 to UF3.
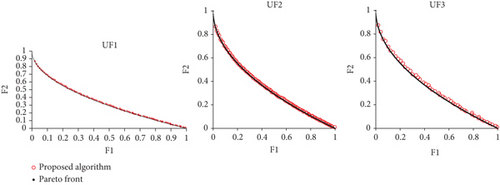
As depicted in Figure 9, the Pareto front obtained by the hMOPSO-HS algorithm exhibits minimal deviations from the actual Pareto front. Subsequently, the proposed MOGOA-BES algorithm was employed to optimize the constrained test functions (CF1-CF7), and the corresponding IGD index values are calculated and presented in Table 5.
| CF1 | CF2 | CF3 | CF4 | CF5 | CF6 | CF7 | |
|---|---|---|---|---|---|---|---|
| hMOPSO-HS | 0.005743 | 0.004373 | 0.048562 | 0.053022 | 0.071675 | 0.062543 | 0.05348 |
| MOPSO | 0.006115 | 0.005784 | 0.043003 | 0.049105 | 1.930803 | 0.610471 | 0.008268 |
| MOABC [47] | 0.00992 | 0.01027 | 0.08621 | 0.00452 | 0.06781 | 0.00483 | 0.01692 |
| GDE3 [47] | 0.0294 | 0.01597 | 0.1275 | 0.00799 | 0.06799 | 0.06199 | 0.04169 |
| MOEADGM [47] | 0.0108 | 0.008 | 0.5134 | 0.0707 | 0.5446 | 0.2071 | 0.5356 |
| MTS [47] | 0.01918 | 0.02677 | 0.10446 | 0.01109 | 0.02077 | 0.01616 | 0.02469 |
| LiuLi algorithm [47] | 0.00085 | 0.0042 | 0.1829 | 0.01423 | 0.10973 | 0.01394 | 0.10446 |
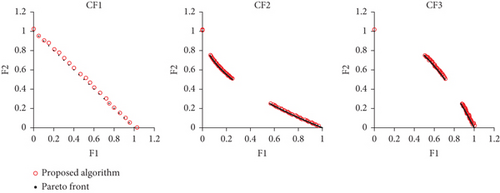
The lower values of the IGD index in solving CF problems validate the higher accuracy and suitable dispersion of the solutions obtained by the proposed algorithm in comparison to other algorithms. Figure 10 illustrates the Pareto fronts of the proposed algorithm and the actual Pareto fronts for CF1, CF2, and CF3.
6.2. Second Section of the Simulation Results (Regardless of Uncertainty)
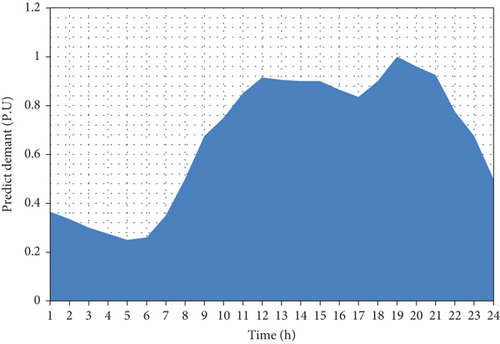
For the first part of the simulation, uncertainty is not considered, and definite data are used to perform the optimization. The predicted electrical demand by customers is shown in Figure 11.
The projected values of irradiation and wind speed are illustrated in Figure 12. The PV system unit has the capability to generate electricity between 8 am and 6 pm, while no power generation occurs during the remaining hours due to insufficient solar irradiation. The wind speed in the specified area fluctuates between 6 m/s and 11 m/s [47].

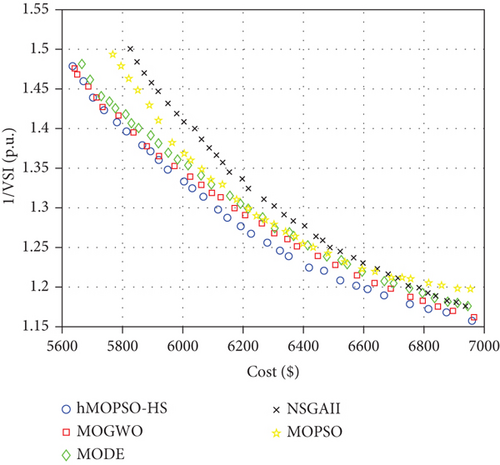
The Pareto fronts for the optimization algorithm are depicted in Figure 13.
To assess the optimization outcomes, the S-metric index is computed to gauge the dispersion of the dominating particles, and its representation can be observed in Figure 14. A smaller amount of the mean metric distance signifies that the Pareto particles are more scattered, and zero values of the S-metric distance mean that all the dominant particles are distributed at the same Pareto distance.
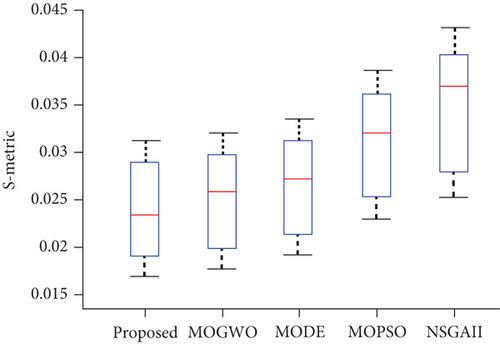
The best result is selected from the dominant particles. Also, the fuzzy mechanism is used for the best results selection. The optimal outcomes for the optimization algorithms are presented in Table 6.
| NSGAII | MOPSO | MODE | MOGWO | hMOPSO-HS | |
|---|---|---|---|---|---|
| Cost ($) | 6269 | 6235 | 6234 | 6230 | 6203 |
| 1/VSI (p.u.) | 1.321 | 1.287 | 1.287 | 1.282 | 1.274 |
Based on the findings presented in Table 6, it can be observed that the hMOPSO-HS algorithm outperformed other metaheuristic algorithms in terms of performance. The final cost for the hMOPSO-HS is $6203 and the voltage stability index in the MG is 1.274 p.u. Figure 15 shows the operating cost of the MG separately.
To better analyze the performance of the hMOPSO-HS optimization algorithm on MG operation costs, the share of each component in the final cost is shown as a percentage in Figure 16. About 48% of the MG operation cost is allocated to the purchase of electricity from the upstream network, while the share of distributed generation and parking lots from the final cost of operation is 16% and 22%, respectively. The DR share is equal to 8%, and the ENS fine share is about 6% of the final cost.
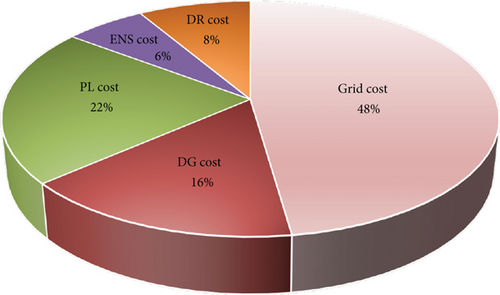
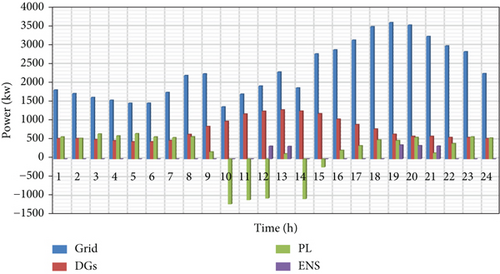
Figure 17 shows the generation capacity of each part of the MG components for 24 hours after optimization by the proposed hMOPSO-HS algorithm.
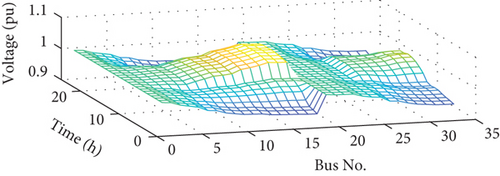
In this case, the MG voltage profile in 24 hours is shown in Figure 18. The voltage amplitude in all buses for 24 hours is more than 0.94 p.u.
6.3. Third Section of the Simulation Results (considering Uncertainty)
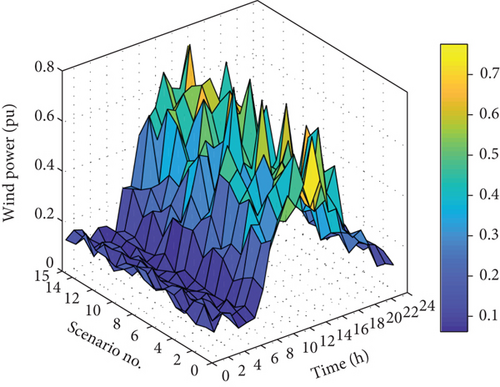
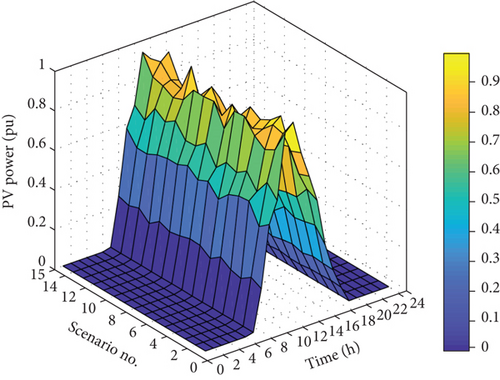
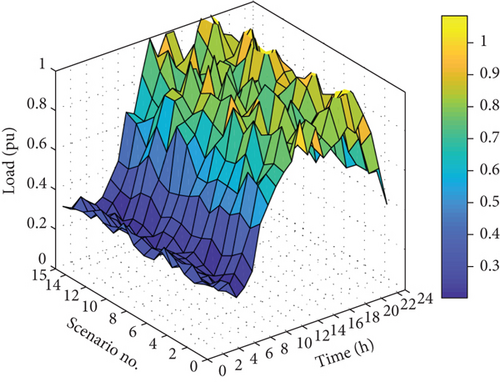
In the second section of the simulations, demand and generation uncertainties as well as parking lot uncertainties are considered. Fifteen scenarios are chosen by the MCS, and the per-unit values of wind power, PVs and charge in these scenarios are shown in Figure 19.
The Pareto fronts for the optimization algorithms in the second part are shown in Figure 20.
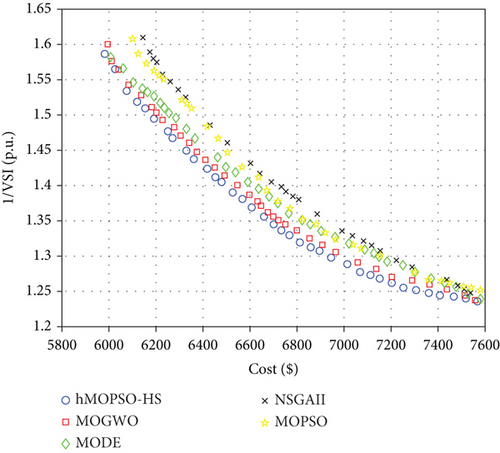
Similar to the first section, for better evaluation, the S-metric index is calculated for the algorithms which is shown in Figure 21.
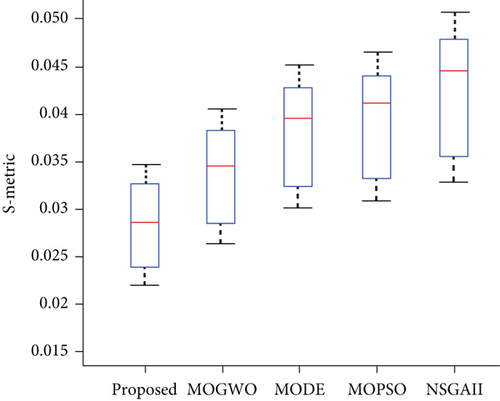
Considering the uncertainty, the S-metric index results reveal an increase in the dispersion of the outcomes compared to the first section. A lower mean value of the S-metric index means scattering with a uniform distribution of dominant particles of the proposed hMOPSO-HS. The MG cost and the voltage stability function for the selected particles are given in Table 7.
| NSGAII | MOPSO | MODE | MOGWO | hMOPSO-HS | |
|---|---|---|---|---|---|
| Cost ($) | 6684 | 6673 | 6623 | 6646 | 6605 |
| 1/VSI (p.u.) | 1.412 | 1.388 | 1.391 | 1.371 | 1.367 |
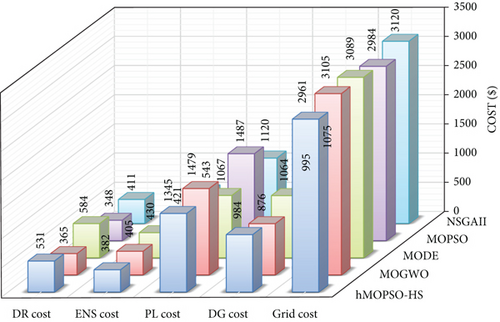
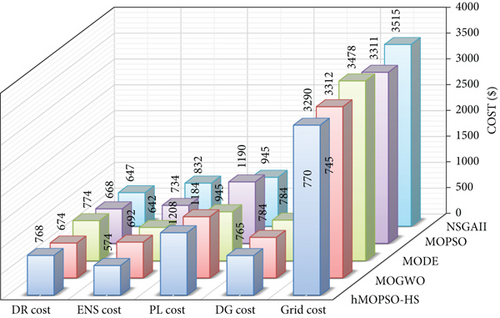
In this section, the MG operation cost and 1/VSI index are the lowest when the proposed hMOPSO-HS is used for MG energy management. The operation cost is $6605, and 1/VSI is 1.367 p.u. for the MG optimized by the hMOPSO-HS. In Figure 22, the MG component cost is shown as a separate bar chart. The results show that considering the uncertainty in MG, it increases the purchasing energy cost from the power grid and the penalty for not supplying energy. Also, the demand response program has played an important role in reducing operation costs.
In Figure 23, the share of each part in the final cost is shown by percentage.
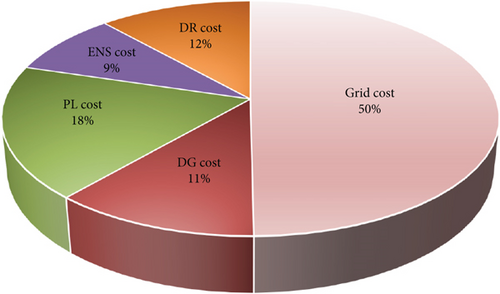
In this part of the simulation, the percentage of the cost from a power system is about 50% and it has increased by 2% compared to conditions without considering uncertainty. Also, the share of ENS and DR has increased. The DR share of total cost is 12%, and the ENS share is 9% for this section. But, the share of PL costs and DG production costs has decreased to 18% and 11%, respectively. The MG voltage is shown in Figure 24.
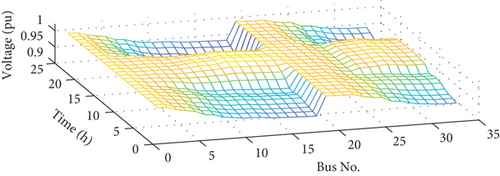
The voltage profile shows that in the case of uncertainties, the voltage amplitude has decreased compared to the conditions of the previous section. The minimum voltage amplitude is 0.93 p.u.
7. Conclusion
In this paper, a novel energy management system based on uncertainty for MG energy management is proposed. The MG selected for the simulation consists of PV and wind sources along with EV parking lots. The renewable source generation powers, PL, and load consumption uncertainties are considered in the simulation and other sources of uncertainty are omitted. The operation cost and voltage stability index (VSI) are considered objective functions, and an innovative hybrid algorithm called hMOPSO-HS is proposed for solving the optimization problem. The hMOPSO-HS algorithm is a combination of the mutant version of MOPSO and harmony search (HS) algorithms. Simulations are done in two different cases. In the first case, the uncertainty is neglected and, in the second part of the simulation, the uncertainty is considered. The optimization results of the proposed hMOPSO-HS algorithms are compared with several multiobjective algorithms for two cases of simulations and also the S-metric index is calculated for all of them. The simulation results indicate better performance of the hMOPSO-HS algorithm than all other algorithms. The simulation results also showed that if uncertainty is considered, the cost of the demand response program and the cost of purchasing energy from the upstream network will increase to reduce the impact of uncertainty on the sources of distributed generation and parking of EVs. For future studies, new electrical energy storage technologies such as compressed air storage (CAS) or power to gas (PtG) can be added to the microgrid and the impact of the presence of these storages can be investigated. Indeed, the studies presented in this paper can be replicated and applied to real-world systems. By conducting similar experiments on real systems, researchers can verify the effectiveness and applicability of the proposed approaches in practical scenarios.
Abbreviations
-
- DG:
-
- Distributed generation
-
- DR:
-
- Demand response
-
- DRP:
-
- Demand response program
-
- ENS:
-
- Energy not supply
-
- EMS:
-
- Energy management system
-
- EV:
-
- Electric vehicles
-
- hMOPSO-HS:
-
- Hybrid MOPSO-HS algorithm
-
- HSA:
-
- Harmony search algorithm
-
- MCS:
-
- Monte Carlo simulation
-
- MG:
-
- Microgrid
-
- MOPSO:
-
- Multiobjective particle swarm optimization
-
- NLP:
-
- Nonlinear programming
-
- PDF:
-
- Probability density functions
-
- PL:
-
- Parking lot
-
- PV:
-
- Photovoltaic
-
- RTP:
-
- Real-time pricing
-
- SOC:
-
- The state of charge
-
- VSI:
-
- Voltage stability index
-
- TOU:
-
- Time of use
-
- WT:
-
- Wind turbine.
Parameters
-
- α, β, and γ:
-
- Constant values for the DG
-
- :
-
- Charging cost
-
- :
-
- Discharging cost
-
- :
-
- Loss of supply probability
-
- :
-
- Unwanted power interruption punishment
-
- πh:
-
- Probability of each sample
-
- Nh:
-
- Number of random samples of operation conditions
-
- :
-
- PV generated power
-
- :
-
- WT generated power
-
- PDG-max:
-
- Maximum production capacity of DG
-
- PDG-min:
-
- Minimum production capacity of DG
-
- u:
-
- Binary variable
-
- Bt,n:
-
- Binary variables that show discharge mode
-
- :
-
- Maximum charge rate of nth EV
-
- :
-
- Maximum discharge rate of nth EV
-
- :
-
- EV remaining energy
-
- :
-
- EV traveling energy consumption
-
- :
-
- Charging efficiency
-
- :
-
- Discharging efficiency
-
- :
-
- Mean of load power
-
- :
-
- Variance of load power
-
- si:
-
- Radiation intensity
-
- Apv:
-
- Size of the PV panel
-
- ηpv:
-
- Efficiency of the PV panel
-
- Gt,h:
-
- Solar irradiation
-
- GSTC:
-
- Standard irradiation
-
- Tt,h:
-
- Panel temperature
-
- TSTC:
-
- Standard temperature
-
- Pr:
-
- WT rated power
-
- sit,h:
-
- A random variable representing the intensity
-
- μυ:
-
- Mean of wind data
-
- συ:
-
- Variance of wind data
-
- υ(t):
-
- Wind speed
-
- υcut-in:
-
- Cut-in speed
-
- υcut-out:
-
- Cut-off speed
-
- υr:
-
- Nominal speed
-
- νk:
-
- Velocity of particle
-
- Dd:
-
- Damping coefficient
-
- w:
-
- Weighting factor
-
- Rep:
-
- Repository
-
- PM:
-
- Percent of mutation
-
- HM:
-
- Harmony memory
-
- :
-
- The energy exchanged to the network
-
- Pgrid-max:
-
- Maximum power exchanged with the network
-
- At,n:
-
- Binary variables that show charge mode.
Conflicts of Interest
The authors declare that they have no conflicts of interest.
Open Research
Data Availability
The data used to support the findings of this study are included within the article.


