Enhancement of the Performance of Switched Reluctance Generators in Low Wind Speed Conditions Using Advanced Tracking Techniques
Abstract
This paper presents a tracking method to improve the performance of switched reluctance generators in areas with low wind speeds. The main contribution of this work is the proposal of an advanced control system that employs dynamic tracking techniques to optimize the energy efficiency and response of the switched reluctance generators under various operating conditions. The methodology encompasses the construction of the generator, the development of a wind turbine model, and the coupling of the turbine with the switched reluctance generators. Simulations are conducted using real wind speed data to evaluate the use of switched reluctance generators in wind energy generation. The performance of the switched reluctance generators is improved by applying a tracking technique that operates on the converter’s turn-off angle, which controls the generator’s switching. The tracking and optimization techniques implemented in this work maximize the performance of switched reluctance generators in wind energy generation, both in standalone and self-excited operations. The results demonstrate that satisfactory wind energy generation can be achieved using the SRG, with wind speeds of 5.40 m/s producing approximately 1.5 kW without optimization and around 1.65 kW with optimization, reaching about 70% efficiency with a custom-built generator. This makes the technology viable for regions characterized by low wind speeds.
1. Introduction
The search for environmentally sustainable energy sources, such as wind energy, is increasing, with significant investments in wind parks. According to the Global Wind Energy Council report, in 2022, 77.6 GW of wind capacity was added, totaling 906 GW globally. Predominant technologies include permanent magnet synchronous generators and doubly fed induction generators. The switched reluctance generator (SRG) is also being explored as an alternative [1, 2, 3]. Optimization and control studies aim to maximize SRG efficiency, including adjustments to switching angles and excitation voltage, as well as the use of maximum power point tracking algorithms (MPPT) [4]. The modeling and simulations of SRGs, as in the study by Eddine et al. [5], highlight their ability to operate at low rotation speeds, eliminating or reducing the need for gearboxes and providing higher energy efficiency. The continuous development of algorithms and techniques is required to maximize the output and efficiency of SRG electrical power, contributing to the advancement of wind energy.
Araújo et al. [3] propose techniques to optimize the efficiency of the SRG system by using maximum power point tracking and an optimized proportional–integral–derivative (PID) controller. The results indicate an efficiency increase of over 10% when applied in conjunction with the PID controller. This methodology is applicable to wind power generation with excitation provided by photovoltaic systems [3, 4]. They evaluate the performance of SRG in variable speed wind turbines. They propose two control strategies: one for low and medium speeds using pulse width modulation and another for high speeds using single-pulse control. Simulations and experimental tests validate the efficiency of the system, providing adequate control of current and reactive power, thus increasing energy generation [4, 6]. They model and simulate SRG in small-scale wind generation systems, validated with a prototype. They use the finite element method to calculate flux and torque, and the control adjusts the switching angles to obtain maximum power. SRG efficiently generates energy over a wide range of speeds, reaching a nominal power of 180 rpm [6].
Barros et al. [7] explore the use of a switched reluctance generator (SRG) in wind generation systems at variable wind speeds. Hysteresis current control is applied at low speeds, while single-pulse control is used at high speeds. When comparing sliding mode controllers (SMC) with proportional–integral (PI) controllers, SMC demonstrates superior performance across a wide speed range. The smooth transition between control modes improves energy utilization. Reis et al. [8] optimize SRG switching angles using a genetic algorithm, maintaining stability with a PI controller. Their results show an increase in the mechanical power required by the SRG and a reduction in excitation power, contributing to overall system efficiency. Bernardeli et al. [9] model an SRG with a 6 × 4 geometry and a load-parallel capacitor. Simulations and experiments confirm its effective performance at low speeds, making it suitable for wind power generation.
Fernandes et al. [10] propose controlling SRG in wind generation systems using the MPPT technique. Hysteresis soft-chopping current control regulates phase currents, while MPPT optimizes the turbine tip speed ratio by adjusting rotation speed. Simulation results demonstrate the effectiveness of the method, highlighting the viability of SRG in wind generation. Namazi et al. [11] use MPPT adjustment with passivity-based control to stabilize the output voltage of SRG in wind generation systems. Rahmanian et al. [12] apply MPPT, neural networks, and fuzzy logic to control the rotation speed of the wind turbine, achieving greater accuracy with neural networks. SRG offers advantages such as simplified construction, high mechanical resilience, and a wide speed range, although its application is still in the early stages compared to other technologies. Its use can eliminate or reduce the need for gearboxes, despite the complexity of the drive system [3]. The generation of energy from renewable sources, especially wind, is relevant given the environmental impacts. This proposal is justified by the need for solutions that provide comprehensive models of wind generation systems, including modeling of wind profiles, wind turbines, coupling, and SRG.
The primary hypothesis of this work is that applying a specific tracking method for switched reluctance generators (SRG) can improve system performance under low wind speed conditions. The proposed method focuses on tracking the converter’s turn-off angle, optimizing SRG commutation to maximize energy efficiency at low rotations. This method, combined with optimization techniques, aims to reduce torque oscillations and enhance SRG operational stability, resulting in more efficient energy generation in low-wind scenarios. The main objective of this work is to design and manually construct a custom SRG and develop a computational model of the wind generation system that includes the turbine and coupling. In addition, the proposed tracking method will be integrated into the system to optimize the performance of SRG under conditions of low wind speed. The specific objectives include the following: (i) designing and constructing an SRG with independent excitation (SRGIE) and self-excitation (SRGSE), (ii) determining the optimal switching angles for each operating speed, (iii) employing a maximum power point tracking (MPPT) algorithm to maximize energy generation, and (iv) simulating regions with low, medium, and high wind speeds, mapping the generation.
The originality of this work lies in the integration of the proposed tracking method with the custom-built SRG, utilizing independent and self-excitation strategies. The evaluation of these models is based on real wind speed data collected from various regions. The proposed method for maximum power point tracking and system efficiency, achieved through the converter’s turn-off angle combined with optimized PID control of the generator’s output voltage, represents innovative and significant approaches for SRG studies in generation systems. Before implementing any generation system, preliminary studies are necessary to assess the generation potential on the site and the feasibility of the project. The simulations presented in this work can serve as preliminary studies for potential implementations of real wind generation systems using SRG, as the simulated parameters are derived from the custom-designed and hand-made machine.
The present work is structured as follows: Section 2 addresses the theoretical foundation; presents concepts of the system, model, and optimization; and describes the wind generation system model, the deterministic optimization process, and the switched reluctance generator. These elements are fundamental to understanding the methodology and results. Section 3 outlines the proposed methodology for developing the model of the wind generation system, highlighting the main steps taken to achieve the results, including tests and validation. The results obtained are presented in Section 4. Finally, Section 5 provides the conclusion of the paper.
2. Theoretical Background
This section covers the concepts of the wind generation system and modeling, including a brief introduction to the turbine–generator coupling. The section also discusses the model, characteristics, and intrinsic challenges of the switched reluctance generator.
2.1. Wind Generation System and Model
Systems interact beyond the individual capacities of their elements. The science of systems, which studies these interactions, postulates universal principles, emphasizing the systemic nature that allows a system to be composed of parts of others while maintaining its totality [13, 14]. The functional and structural hierarchy is another systemic characteristic. Universal properties include totality, composition, and internal and external organization. These systems, composed of basic units such as elements or parts, interact and exchange information, with their behavior emerging from these interactions [13]. Models are simplified representations of interactions that seek to approximate the behavior of the real system [15]. They should be simpler but detailed enough to generate valid values comparable to the real system [16]. Validation occurs when the same set of inputs generates the same results in both the system and the model. Various representations are possible depending on the designer’s experience and the purpose of the model [14].
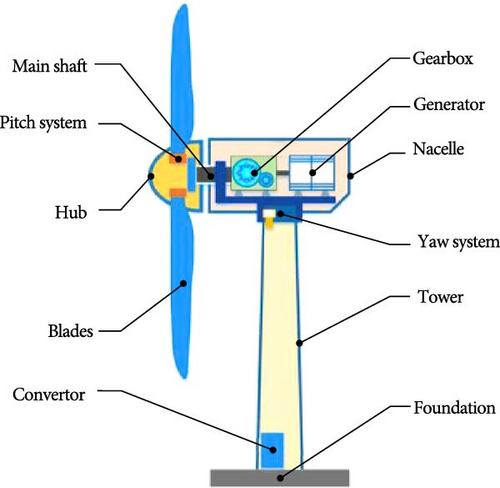
2.2. Turbine–Generator Coupling
Various electrical generator technologies are employed for wind power generation, each with distinct advantages and disadvantages [21]. Induction generators operate at higher speeds, while permanent magnet generators function at lower speeds with high torque. Switched reluctance generators offer a broad operating speed range. Because the turbine rotor speed ωt is much lower than the synchronous generator speed, gearboxes are often used to increase the transmission ratio. The commonly used models include the two-mass model illustrated in Figure 3, adapted from Hansen and Butterfield [22].

In Figure 3, Tt represents the wind turbine torque; Tg is the generator torque; Jt is the turbine inertia; Jg is the generator inertia; ωt and ωg are the rotational speeds of the wind turbine and the generator, respectively; Ks is the shaft stiffness; and Ds is the damping constant. The gearbox increases the rotational transmission ratio, converting ωt to a higher speed suitable for the operation of the generator. However, this transmission process incurs power losses [23].
2.3. Modeling of the Switched Reluctance Generator
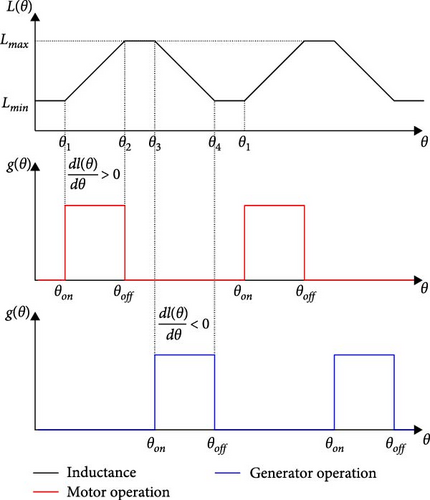
In Figure 4, when the actuation of g(θ) from the asymmetric half-bridge (AHB) converter occurs at positions where the inductance of the coils L increases (represented by the red curve), the torque is positive, and the machine operates as a motor. In contrast, when the actuation of g(θ) from the AHB converter occurs at positions where the inductance of the coils L is decreasing (represented by the blue curve), the torque is negative, and the machine operates as a generator.
The inherent requirement to determine the position of the rotor makes the SRG drive complex. Since the 1970s, advances in power electronics and microprocessors have made it possible to optimize the performance of SRGs [25]. There are two ways to excite the SRG: (i) with an independent fixed voltage source or (ii) with self-excited operation [26]. The converter commonly used to drive the SRG, regardless of the excitation strategy, is the AHB [3]. Figure 5(a), adapted from Araújo et al. [3], illustrates this converter to drive the SRG with an independent excitation source (SRGIE). Each phase of the converter, composed of two series-connected switches Q with the coil and two diodes D, allows individual current control, enabling the magnetization of one phase while the other demagnetizes. Figures 5(b) and 5(c) illustrate the operating cycle of one phase.
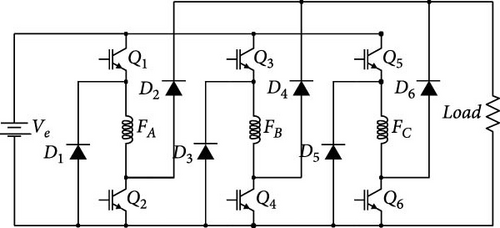
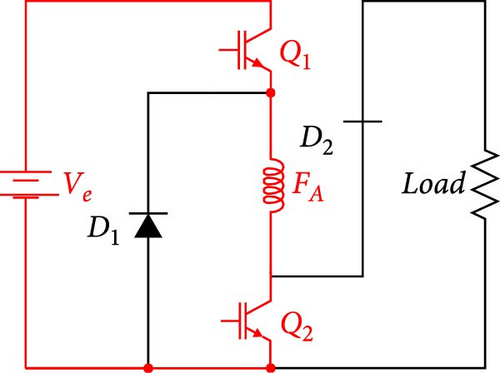
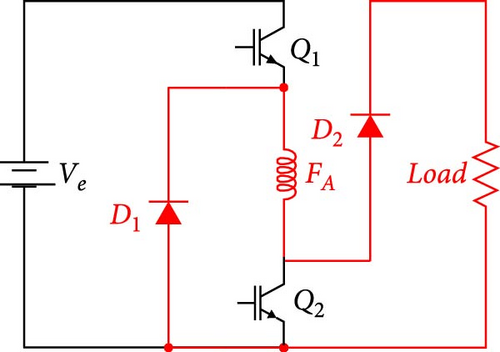
In the SRGIE, the excitation of the AHB converter keeps the switches Q1 and Q2 on, connecting the voltage Ve to the phase coil. The current flows from the positive terminal of the source Ve through the switch Q1, the coil, the switch Q2, and finally through the negative terminal of Ve. In the subsequent generation stage, the switches Q1 and Q2 are turned off, allowing the electromotive force generated in the coil to keep the current flowing through the diodes D1 and D2. Thus, there are two driving stages for each phase. After excitation, freewheeling occurs, an intermediate stage when the current circulates through the switch Q2 and the diode D1. During this phase, the concatenated flux remains constant, but the current continues to increase due to the electromotive force of the coil, producing zero voltage [27].
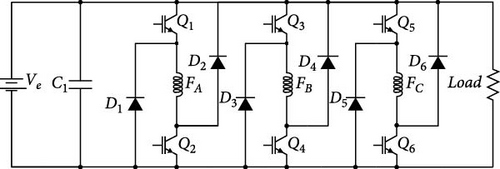
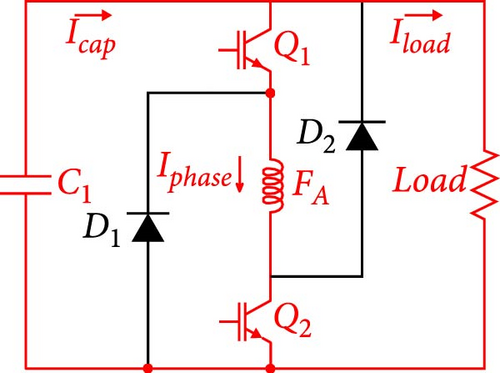
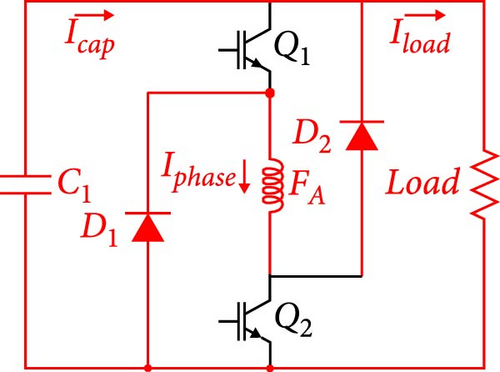
In the case of SRGSE, self-excitation cannot be generated directly, but it is possible to add permanent magnets to the stator to generate magnetic flux for self-excitation [28]. However, this strategy has disadvantages, such as (i) increased manufacturing costs, (ii) dependence on speed to produce sufficient flux, and (iii) complications in the manufacturing process [26]. Another approach is to add capacitors in series or parallel to the phase winding and load, using the AHB converter. Figure 6(a), adapted from Touati et al. [26], illustrates the schematic of the AHB converter for the SRGSE drive with a capacitor in parallel with the load. Unlike SRGIE, the excitation bus is the same as the one receiving the generated energy. In this process, initial capacitor charging does not require an external source, as the capacitor starts to excite the phases [29]. Figures 6(b) and 6(c) detail the excitation and generation stages. The capacitor current Icap is divided into two parts: one for excitation Iphase and the other to power the load Iload [9]. After initiating excitation, the phase current increases as a result of the excitation current and the action of the electromotive force. When the switches Q1 and Q2 open, the electromotive force allows the current to circulate through the diodes D1 and D2 [9].
3. Methodology
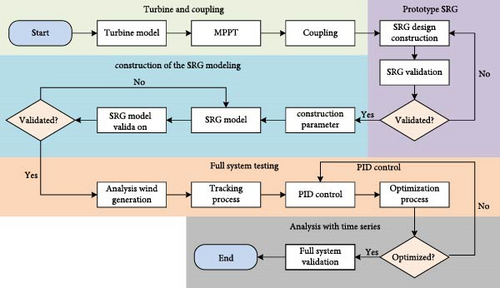
In this section, the SRG design and the handmade construction are briefly described, including the computational experiments for the wind power generation system, which comprises the wind turbine, the coupling, and the SRG. The application of SRG with independent excitation (SRGIE) and self-excitation (SRGSE) in wind power generation systems was evaluated. Based on the wind generation model, the performance of different wind speed profiles vv is assessed. Furthermore, the θoff tracking technique is implemented for each SRG operating speed, with the aim of enhancing the efficiency of the system η and maximizing the electrical output power Ps. The optimization process to find the optimal PID control gains to maintain a constant output voltage Vs is also detailed. Finally, the analysis and validation of the model are described. Figure 7 illustrates the flowchart of the proposed methodology.
3.1. Turbine Model
Turbine modeling is an important step in the proposed wind power generation system. The methodology involves defining input parameters and calculating variables such as the power coefficient CP, the mechanical power of the turbine Pt, and the torque of the turbine Tt. Input constants, such as the diameter of the rotor A, the angle of motion β, and the density of the air ρ, are important for the precision of the model, together with variables such as the wind speed vv and the rotation speed of the turbine ωt. In calculating CP shown in Equation (4), which influences η and turbine efficiency, variations in vv, β, and ωg are considered. Although the theoretical maximum value of CP is 0.59, Betz limit, real turbines typically exhibit lower values, defined as .
Subsequently, Pt in Equation (2) and the turbine torque Tt in Equation (6) are calculated based on the value of CP, considering the variable vv. To ensure precise analyses of SRG performance in wind power generation, real data for vv are collected. Since Pt depends on ωt, the maximum power point tracking (MPPT) method is implemented to determine the optimal tip-speed ratio λ∗ = vv × ωg and optimize η.
3.2. Maximum Power Point Tracking Proposed Approach
Given that the radius of the turbine Rt remains constant, the value of ωt can be determined based on the knowledge of vv. Taking into account the variation in vv over time, finding the value of λ∗ allows for the identification of ωt that achieves and consequently the maximum power Pt that can be extracted, as expressed in Equations (2) and (6).
3.3. Coupling Turbine–Generator
The coupling between the wind turbine and the SRG is modeled to establish the relationship between the wind speed vv, the wind turbine torque, and the generator torque. Given that wind turbines operate at low speeds, a gearbox is commonly used to elevate this speed to values within the generator’s operating range. However, the SRG is uniquely capable of functioning at low rotational speeds, which distinguishes it from other generators used in wind power generation, such as induction generators. This characteristic implies that the gear ratio G for the SRG may be lower than that of other machines. In some cases, this ratio may not even be required, allowing the wind turbine and the generator to operate at the same speed.
The gearbox model requires knowledge of the inertia values Jt, stiffness Ks, and shaft damping constant Ds. Accurately representing these parameters poses challenges, especially given the SRG’s low operating speeds. This characteristic might eliminate the need for a gearbox in some cases. Therefore, the optimal value of G for the proposed model is evaluated based on the nominal speed of the SRG.
3.4. Switched Reluctance Generator Design
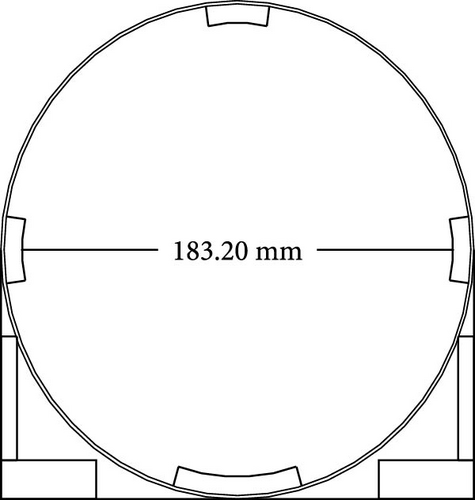
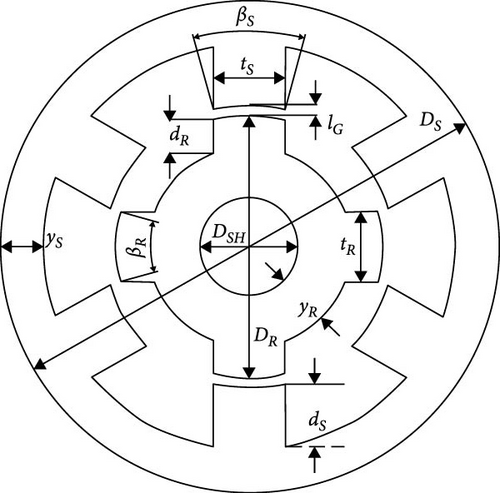
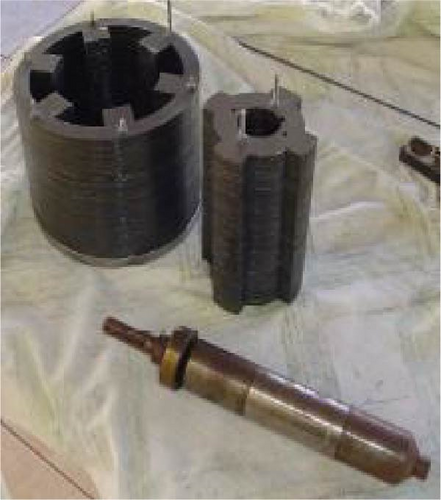
In this design approach, our objective is to extract the actual mechanical and electrical parameters of the SRG through simulations. The SRG is configured as 6 × 4, with its external dimensions shown in Figures 8(a) and 8(b). Our housing design allocates 0.003178 m3 space to accommodate the laminated core. This 6 × 4 configuration allows the SRG to operate at higher speeds, facilitated by a six-switch power converter, making the control more cost-effective. However, the reduction in stator pole count results in more oscillatory torque production by the SRG. Figure 8(c) illustrates the geometric parameters, which are calculated to achieve the desired output parameters.

3.5. Implementation of the Proposed Generator Model
Several important steps are involved in the SRG simulation process, including implementing the mathematical model, defining the inductance profile, specifying the switching logic of the AHB converter, and determining the construction parameters (both electrical and mechanical). Figure 9 outlines the flowchart of this process, showcasing two distinct excitation strategies: SRGIE and SRGSE. Despite their differences in excitation methods, both strategies utilize the same machine model. Once the machine model is established, the simulation process begins by acquiring electrical parameters such as the resistance of the stator coil R and mechanical parameters such as the viscous friction coefficient DA and the moment of inertia Jg. These parameters are integral in computing the state matrix, as given by Equation (12).
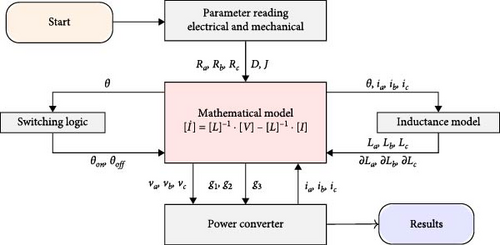
The AHB converter, illustrated in Figure 5(a) for SRGIE and Figure 6(a) for SRGSE, is fundamental for regulating instantaneous phase currents i based on coil voltages v. Its selection is driven by its capability to control individual phase currents, allowing for simultaneous magnetization and demagnetization of phases. The switching logic block, as illustrated in Figure 9, utilizes the instantaneous rotor position θ obtained from the angular position sensor. This position is compared with the angles θon and θoff of the AHB converter switches to generate the switching logic. Each phase of the AHB converter comprises two electronic switches: insulated gate bipolar transistors (IGBT) labeled Q1 to Q6 and fast recovery diodes (FRDs) labeled D1 to D6. The results are thoroughly evaluated to validate the proposed model, with simulations carried out across varying excitation voltages Ve, angles θon and θoff of the AHB converter switches, and generator rotation speeds ωg.
3.6. Analysis of the Wind Power Generation System
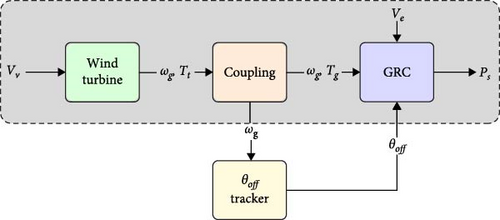
Once real wind speed data are collected and wind turbine, coupling, SRGIE, and SRGSE models are built, the complete model of the wind power generation system is obtained. The flowchart guiding the construction of this model is illustrated in Figure 10, highlighted in the gray region. For each value of vv, the wind turbine block computes ωt and the developed torque Tt. The coupling block connects the wind turbine on the low-speed side with the generator on the high-speed side. The SRG block receives inputs including ωg, torque Tg from the generator, Ve from the AHB converter, and Ps. Once the model is assembled, simulations are executed to observe the behavior of SRGIE and SRGSE for different inputs vv, which facilitates performance evaluation with real data.
3.7. Tracking Process
The optimization process manipulates variables such as Ve, angles θon, and θoff to maximize Ps and η. Our methodology involves fixing Ve and θon while tracking the values of θoff that produce the maximum power throughout the operating speed range of SRGIE and SRGSE. After defining the value of Ve, simulations are performed to determine the optimal value of θon considering Ps and η. Once this is determined, the θoff tracking block is introduced into the model, as illustrated in Figure 10. This block receives ωg from the coupling block and searches for the optimal value of θoff. This search takes into account the Pe, Ps, and Pmec curves, along with the η curve, analyzing them with varying values of θoff and ωg. The proposed methodology for θoff follow-up is illustrated in Figure 11.

At the end of this process, a surface of power and efficiency η is generated, covering the entire range of θoff and ωg. This surface allows for pinpointing the values of θoff that yield the maximum power and efficiency for each speed analyzed. However, the goal extends beyond the identification of these optimal values for specific speeds. The aim is to derive a function that can perform this calculation at any speed. This function can then be incorporated into the simulation within the θoff tracking block, as illustrated in Figure 11, thus generating the θoff reference for the AHB converter.
3.8. Applied Optimization Process
Control of the SRG output voltage Vs is implemented alongside the θoff tracker using a PID controller integrated in the simulation. The manipulated variables to achieve Vs control are (i) Ve, (ii) θon, and (iii) θoff [3]. They evaluated these manipulated variables for Vs control of the SRG. Initially, they searched for the value of θon that contributes to increasing Ps and η and reducing the torque oscillation TR. Under these conditions, the conduction window is kept at θD = 30°, and the value of θon is decreased until the established conditions are met. Following this procedure, the authors applied the optimization process to the analyzed variables. With the optimized values, they performed a sensitivity analysis of the parameters [13], obtaining sensitivity indices [3]. They found θon = −10°to be the optimal value, which is considered fixed.
The normalized minimization of the error area, represented by the integral of the absolute error, the overshoot represented by Vs(tM) − Vs(∞), and the steady-state error represented by , is defined in Equation (18). With optimized gains from the controller, simulations can be performed applying disturbances to the system to verify the performance in controlling Vs.
3.9. Wind Power Generation System Validation
Computational experiments are conducted to analyze and validate the proposed wind power generation model, providing information for decision-making on the use of the SRG. Initially, these experiments involve testing with various values of wind speed vv, starting with constant vv and then introducing fluctuations to assess the system’s response to sudden changes over short periods. Given the variable and dynamic nature of wind, which directly influences power output Ps, it is necessary for the SRG to demonstrate its ability to generate power over a broad spectrum of vv values.
Data for these experiments are sourced from databases that contain information from meteorological stations or wind atlases, providing information on the wind potential of specific regions. Based on these data, locations are selected as potential sites for wind turbine installation. It is important to note that adjustments may be necessary for wind speed data, as measurement heights can vary among meteorological stations. After adapting the data to the relevant heights for analysis, the regions are chosen to encompass low, medium, and high profiles vv.
4. Results
In this section, the results obtained with the proposed methodology are presented. The results of computational experiments on the wind power generation system, MPPT, the θoff tracking process, the optimization of the PID controller, and the prototype SRG are highlighted. Finally, the main results are discussed.
4.1. Wind Turbine Simulation
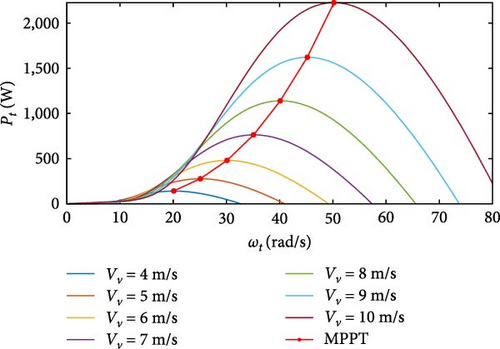
Simulations were performed using a computational model derived from expressions shown in Equations (1), (2), (3), (4), (5), and (6) to analyze the behavior of the wind turbine. The radius of the turbine, Rt, is set at 1.6 m. At a wind speed of vv = 10 m/s, the generated mechanical power, Pmec, reaches 2, 000 W, which is sufficient to meet the power requirements for the switched reluctance generator (SRG). To achieve the maximum power coefficient , the pitch angle of the blade is set to β = 0°. The simulations cover wind speeds ranging from 4 to 10 m/s. Table 1 outlines the characteristics of the wind turbine, while Figure 12 illustrates the behavior of the turbine power Pt, at various wind speeds. It is observed that, as vv increases, Pt also increases. However, the influence on power extraction is not solely dependent on vv. Specific values of ωt allow optimal power extraction in each vv, as illustrated by the ascending red curve in Figure 12.
| Parameter | Value |
|---|---|
| Rt | 1, 6 m |
| ρ | 1, 22 kg/m3 |
| β | 0° |
| 0, 45 |
4.2. Search for the Maximum Power Point and Turbine–Generator Coupling
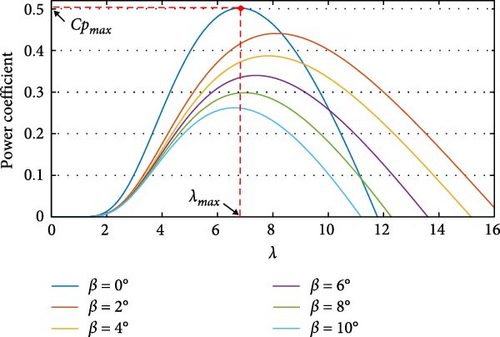
To implement the maximum power point tracking algorithm (MPPT), the pitch angle of the blade, β, is first evaluated. This angle represents the deviation between the turbine blades and the line perpendicular to its axis. When β = 0°, the blades align precisely with the direction of the wind. As β increases, the blades tilt in relation to the direction of the wind. Keeping β = 0°, the value of is determined. With a constant β, the power coefficient, CP, varies as a function of λ. The goal is to find the specific value of λ that yields the maximum . To achieve this, the curve CP in relation to λ is analyzed, as illustrated in Figure 13.
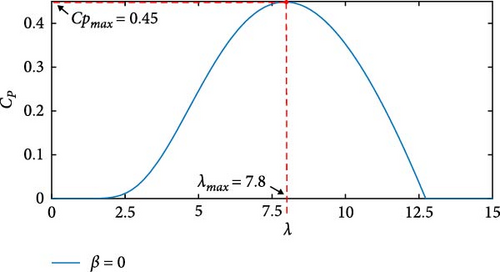
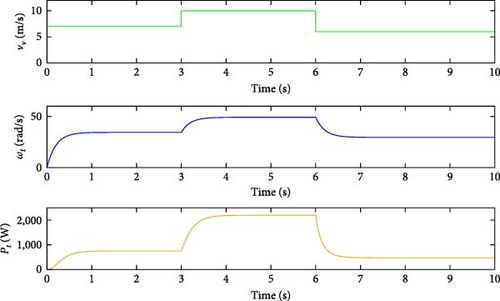
The optimal value of λ∗ = 7.8 was determined, corresponding to . The angular velocity, ωt, for each wind speed, vv, was then calculated using the expression in Equation (13). With the MPPT algorithm in place, simulations were conducted on the wind turbine. The simulation covered wind speeds of vv = [7, 10, 6] m/s, with a 3-s interval. This abrupt variation in vv mirrors real-world wind turbine scenarios. Figure 14 illustrates the response of the turbine to sudden changes in vv. During a total simulation time of t = 10 s, at t = 3 s, vv increases from 7 to 10 m/s, resulting in instantaneous increases in both turbine power Pt and angular velocity ωt. Similarly, at t = 6 s, vv decreases from 10 to 6 m/s, leading to reductions in both Pt and ωt. Thus, the model effectively responds to changes in wind speed.
In the speed ranges where wind turbines typically operate, which are considered low compared to conventional generators, the ideal value of the speed multiplication ratio, G, was established as G = 2. This choice aligns with the switched reluctance generator’s (SRG) ability to function effectively at low rotational speeds. One of the objectives of this study was to evaluate the performance of the SRG in low-speed operations, and selecting G = 2 ensured the lowest feasible value capable of generating energy.
4.3. Machine Parameter Identification
Tests were carried out using the handmade prototype of the switched reluctance generator (SRG) to obtain fundamental parameters for simulation. During the construction of the phase coils, the conductors were extended by equipping the terminals with cables and connecting connector pins to each coil. The resulting phase resistance was 3.25 Ω.
The accuracy of the SRG model depends on the representation of inductances. To achieve this, parametric regression is employed to determine the optimal inductance surface. In the surface analysis of experimental inductance, data were collected at 108 points corresponding to the angular positions of 0°, 6°, 11°, 16°, 22°, 27°, 33°, 39°, and 45° (the position of total misalignment). For each angular position, the coil received a current ranging from 0 A to 6 A, at intervals of 0.5 A. By applying parametric regression, the expression L(θ, i) was derived, and the experimental inductance surface was obtained. This surface significantly contributes to the accuracy of the model while also reducing the simulation time. Refer to Figure 15 for a visualization of the experimental inductance surface of the SRG.

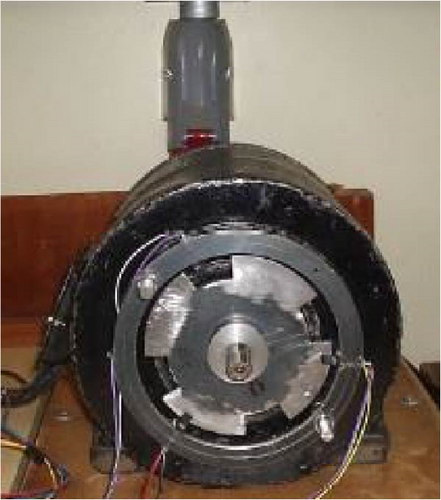
Figures 16(a) and 16(b) provide detailed views of the custom generator prototype. To determine the viscous friction and inertia values, dynamic tests were performed applying varying torque levels and measuring the resulting accelerations. The equation of motion Tg = Jg · αg + DA · ωg was used, where αg represents the angular acceleration of the SRG. Table 2 lists the key electrical, mechanical, and geometric parameters of the constructed SRG.
| Parameter | Value |
|---|---|
| Number of phases | 3 |
| Phase resistance | 3.25 Ω |
| Minimum phase inductance | 31.95 mH |
| Maximum phase inductance | 255.05 mH |
| Nominal voltage | 180 V |
| Nominal current | 3.2 A |
| Number of stator poles | 6 |
| Number of rotor poles | 4 |
| Inertia | 8 × 10⁻³ kg·m2 |
| Viscous friction | 1 × 10⁻⁴ kg·m2 |
| Stator pole piece angle | 30° |
| Rotor pole piece angle | 32° |
| Outer diameter of stator | 183.40 mm |
| Rotor diameter | 100.87 mm |
| Length of blade pack | 120.50 mm |
| Air gap length | 0.6025 mm |
| Stator pole tooth width | 26.42 mm |
| Rotor pole tooth width | 27.80 mm |
| Stator slot depth | 23.49 mm |
| Rotor slot depth | 13.21 mm |
| Stator crown | 17.17 mm |
| Rotor crown | 13.07 mm |
| Shaft diameter | 38.31 mm |
4.4. Simulation of the Switched Reluctance Generator

During the excitation phase, a voltage of approximately 100 V is reached. After IGBTs are turned off, the voltage reverses and reaches approximately 216 V during the generation phase. In this phase, the diodes of the AHB converter are reversed, directing the voltage to the load and maintaining the same current direction, as illustrated in Figure 5. The IGBT command pulse is applied when the inductance is decreasing, allowing the machine to operate as a generator. Specifically, the conduction window occurs between the positions θon = 0° (maximum inductance) and θoff = 30° (minimum inductance), resulting in a conduction window of θD = 30°. This configuration, known in the literature as ideal for 6 × 4 SRG, ensures efficient operation.
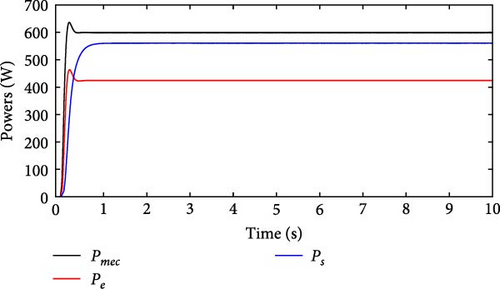
Figure 17 shows the current and voltage behavior in Phase A, with peak values of ia = 15.76 A and va = 97.12 V. During the excitation phase, va reaches 212 V, while in the generation phase, the machine exhibits resilient performance. The power characteristics Pmec, Pe, and Ps are illustrated in Figure 18(a). It is observed that, when an input power is approximately Pe = 400 W, the machine achieves mechanical power Pmec ≈ 600 W and shaft power Ps ≈ 559WPs ≈ 559 W, both exceeding the power consumed by the excitation source. Finally, Figure 18(b) presents the efficiency curve of the simulated SRG, obtained using Equation (17).

4.5. Validation of the Wind Turbine and Switched Reluctance Generator Models
In this study, the models were validated by comparing the simulation results with the experimental data and the simulations of other studies. The focus was specifically on models representing the horizontal axis wind turbine (HAWT) and the switched reluctance generator (SRG). The HAWT model, widely recognized in the literature, has been extensively employed in various studies. Its expression for power calculation, defined in Equation (2), originates directly from physical principles. This expression establishes the relationship between the conversion of kinetic wind energy to mechanical energy and subsequent generation of electrical energy [17]. The precision of this model depends on the precise definitions of the parameters and the calculation of the power coefficient CP. The methods for computing CP rely on the parameters β and λ. The study carried out by Castillo et al. [33] analyzed existing methods, highlighting that the approaches proposed by Ovando et al. [34] and Guo et al. [35] effectively represent the coefficients using expressions Equations (4) and (5).
These methods undergo rigorous validation through simulations and experimental tests. The same approach to calculate the power coefficient CP is used consistently in various studies, including those of [36, 37, 38]. Our wind turbine simulations show that increasing the parameter β leads to a reduction in both the total power Pt and the coefficient CP. Furthermore, this investigation identifies an optimal λ value that maximizes power output. These findings align with the existing literature.
The computational model for the switched reluctance generator (SRG) was developed based on the expressions in Equations (7) to (12). The SRG parameters were experimentally determined and are summarized in Table 2. The accuracy of the model critically depends on how the inductances are represented. In this study, the inductance representation model proposed by Araújo et al. [3] and da Cunha Reis [16], which uses parametric regression, was adopted. The experimental inductance surface, Figure 15, was then compared with the simulated continuous inductance surface (Figure 19), further validating our SRG model.

The SRG was simulated with Ve = 100 V and a rotational speed of ωg = 600 rpm. The voltage, current, voltage pulse, and inductance curves in Figure 17 can be compared with those obtained in previous studies, such as those of Araújo et al. [3] and Barros et al. [7]. Typically, all studies initiate machine excitation with θon = 0° and θoff = 30°, marking the beginning of the generation stage. During this phase, the machine achieves an output voltage greater than the input. In our work, the SRG was reached 216 V during the generation phase with an input voltage of Ve = 100 V, consistent with the results reported in the literature. It is observed that in all simulations, the shaft power Ps exceeded the electrical power Pe, as illustrated in Figure 18(a).
4.6. Simulation of the Wind Generation System
Following the implementation and validation of the wind turbine, coupling and SRG models, each model was successfully interconnected to create a comprehensive wind generation system model, as shown in Figure 10. This integrated model allowed the assessment of SRG performance under real wind conditions, including abrupt changes. In Table 3, the specific parameters adopted for this simulation are presented, while the remaining parameters for the wind turbine and the SRG remain consistent with those listed in Tables 1 and 2.
| Parameter | Value |
|---|---|
| G | 2 |
| Ve | 180 V |
| θon | 0° |
| θoff | 30° |
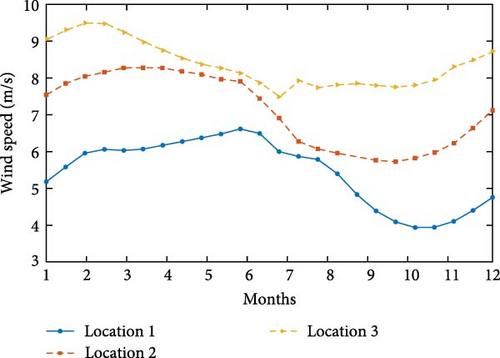
To perform simulations with real vv data, information was obtained from the Weather Spark Platform. This platform offers detailed information on current and historical weather conditions, including comprehensive analyses of various meteorological parameters such as wind speed. Users can explore weather data for specific locations and download relevant information [39]. Using these collected data, the wind energy generation was estimated at each chosen location, allowing the evaluation of the performance of the SRG under different wind speed scenarios. The Weather Spark Platform provides parameters such as the annual average wind speed at various heights, as well as additional measures such as the annual diurnal profile and typical daily variation. Specifically, the arithmetic average of vv recorded at a consistent time throughout the year, at a height of 10 m, defines each hourly value. By analyzing latitude and longitude data for specific locations, the behavior of wind speed over extended periods, such as 12 months, can be studied. In selecting simulation locations, regions with varying wind speed profiles were considered, including classifications of low, medium, and high wind generation potential. Table 4 displays the extrapolated for a height of 100 m for the three chosen locations.
| # | Region | Latitude | Longitude | |
|---|---|---|---|---|
| Location 1 | Deer Lake, Terra Nova/Canada | 49.11°N | 57.22°W | 5.4 m/s |
| Location 2 | Sorocaba, Sao Paulo/Brazil | −22.21°S | −49.94°W | 7.1 m/s |
| Location 3 | Faro, Algarve/Portugal | 38.57°N | −7.90°W | 8.4 m/s |
From the selected locations, daily data series for each city were extracted. Subsequently, the monthly averages for each city were calculated and simulated over 12 months. Figure 20 illustrates the wind speed profiles in the three regions, reflecting the three speed profiles analyzed. The operation of the MPPT algorithm involves increasing ωg to match the increase in vv. However, this leads to a reduction in the excitation time of the generator. As a consequence, Pe decreases, resulting in a corresponding reduction in Pmec. To improve generation efficiency, it is fundamental that Pe increases as ωg grows. To achieve this, the tracking of θoff is implemented. This strategy involves keeping the values of θon and Ve fixed while determining the optimal value of θoff that maximizes the generation.
4.7. θoff Tracking Strategy for SRGIE
In the θoff tracking strategy, the value θon = −10°, as indicated by Araújo et al. [3], was adopted. This choice ensures efficient generation, high efficiency η, and reduced torque oscillation. With a fixed input voltage of Ve = 100 V, the goal was to optimize the system. Simulations were carried out in the range 100 rpm ≤ ωg ≤ 2, 000 rpm and −5° ≤θoff ≤ 30°, as illustrated in Figure 11. By analyzing the power and efficiency curves η, the optimal θoff that maximizes the shaft power Ps can be identified. However, since the SRG relies on an external excitation source, the excitation power Pe, which represents the energy supplied to the excitation system, was also evaluated. Unlike traditional MPPT algorithms, the proposed optimization aims to find the value θoff for each ωg, resulting in the highest achievable Ps and η.
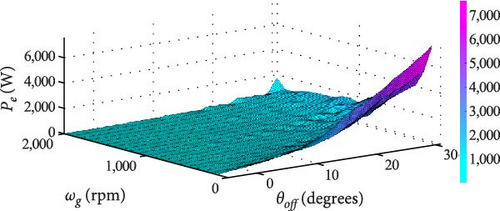
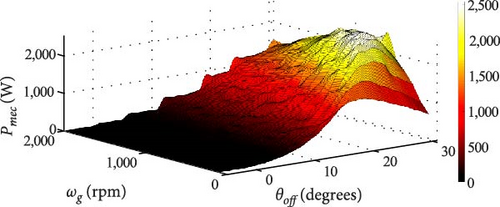
In Figure 21(a), Pe is almost negligible for small angles θoff, particularly in the range −5° to 10°. This behavior arises because the fixed θon = −10° results in a narrow conduction window θD. Consequently, each SRG coil experiences brief excitation periods. Furthermore, Pe remains below 2,000 W for all speeds when θoff < 13°. Beyond this value, Pe reaches its peak when the generation rotation speed ωg = 100 rpm and θoff = 30°. Similarly, Pmec, as shown in Figure 21(b), is also influenced by values of θoff below 15°. Although there is an increase in Pmec as θoff increases, this effect is observed only until ωg ≈ 1, 200 rpm, after which Pmec starts to decrease.
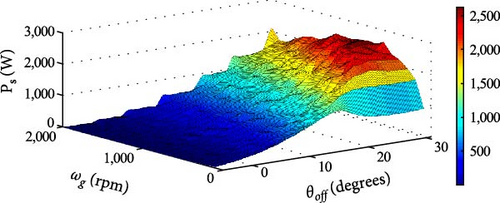
In Figure 22(a), increasing the values of θoff leads to higher Ps. However, the optimal values of θoff vary for each ωg, requiring dynamic adjustment of θoff to achieve maximum utilization of the generation. In addition to Pmec, Pe, and Ps, efficiency η is also considered, as shown in Figure 22(b). The efficiency η is observed to increase with greater ωg. The goal of our optimization process is to find the θoff angles that achieve the highest possible Ps and η for each generator operating speed. This approach considers tradeoffs: the search for values θoff that maximize Ps can lead to a high Pe, resulting in η ≈ 0 and making the operation unfeasible. In contrast, focusing solely on the θoff value that maximizes η could result in Ps ≈ 0, rendering the operation impractical. By analyzing the power surfaces in Figures 21((b) and 22((a) with respect to η, shown in Figure 22(b), the angles θoff that strike the optimal balance between Ps and η can be determined.
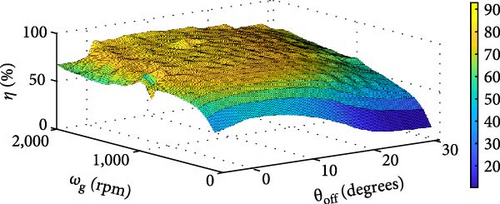
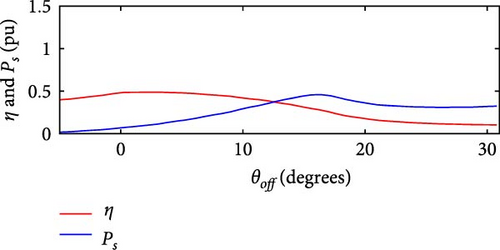
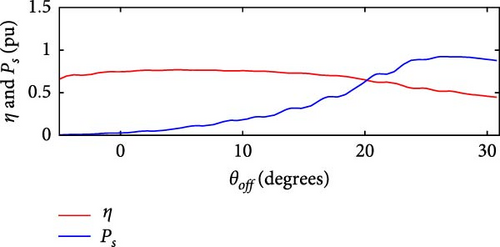
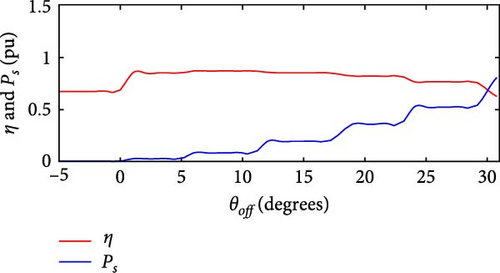
From Figures 23(a), 23(b), 23(c), and 23(d), the relationship between shaft power Ps, efficiency η, and θoff for 100 rpm ≤ ωg ≤ 2, 000 rpm is explored. To aid in visualization, Ps is normalized relative to its base value of 2,626 W. Identifying the θoff values that maximize both Ps and η for each ωg, the optimal θoff for each analyzed speed range can be determined. However, the ultimate goal is to derive a mathematical expression that relates any ωg to θoff. To achieve this, 20 θoff values were initially collected, and an interpolation was performed to obtain 400 data points. Using these interpolated values, a ninth degree polynomial was derived using the least squares method. The resulting polynomial θoff(ωg) is given by the expression in Equation (24):

Through the expression shown in Equation (24), the optimal values of θoff throughout the range of ωg are determined, as illustrated in Figure 24. These values correspond to different wind speed profiles vv from various locations. Consequently, the values of θoff that maximize system operation are obtained. The expression in Equation (24) is then incorporated into the simulation of the wind generation system, with the aim of finding the ideal θoff values and consequently maintaining the optimal λ ratio, resulting in the extraction of maximum Pmec from the wind turbine.

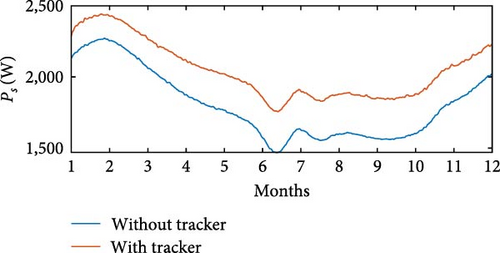
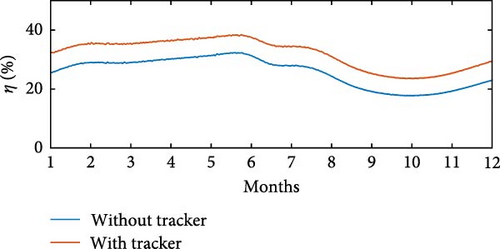
The simulations were carried out using wind speed profiles corresponding to three regions, as listed in Table 4. In the simulation without θoff tracking, a minimum value of Pe = 543 W was observed at Location 3, while the maximum value of Pe = 1, 303 W was recorded at Location 1. In simulation with θoff tracking, the minimum value of Pe = 768 W occurred at Location 3, while the maximum value reached Pe = 1, 134 W at Location 1. The θoff tracker resulted in an increase of 35.27% in Pe at Location 2 and 21.96% at Location 3, which have higher wind speeds. Regarding Ps, in the simulation without the tracker, Ps = 1, 268 W was obtained at Location 3, with the maximum value of Ps = 1, 724 W recorded at Location 1. In the simulation with the tracker, the minimum value of Ps = 1, 551 W occurred at Location 1, while the maximum value reached Ps = 1, 701 W at Location 3. Figures 25(a), 25(b), 25(c), 25(d), 25(e), and 25(f) present Ps and η of the SRGIE with and without θoff tracking.
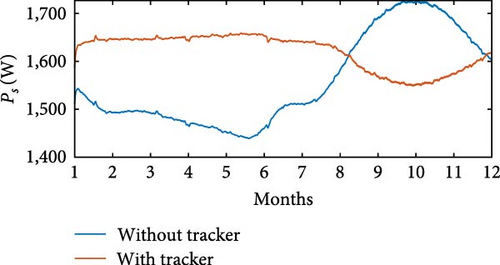
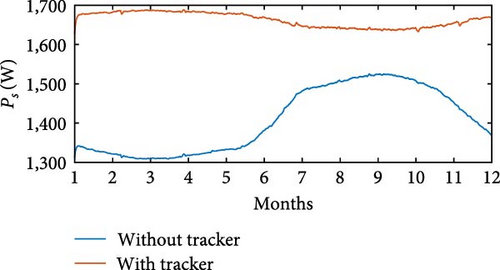
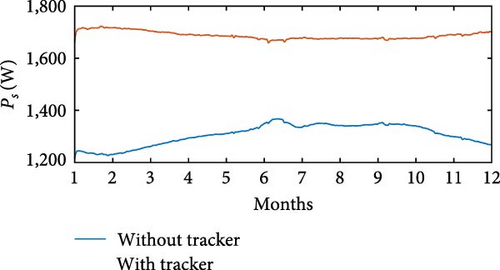
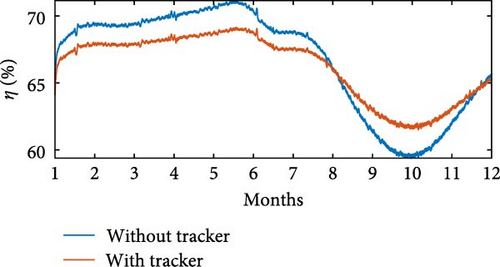
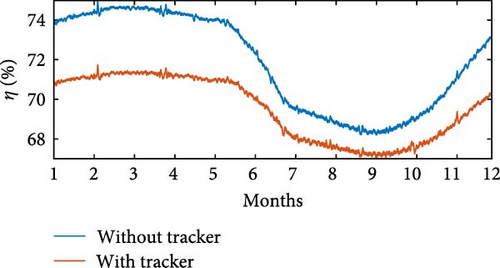
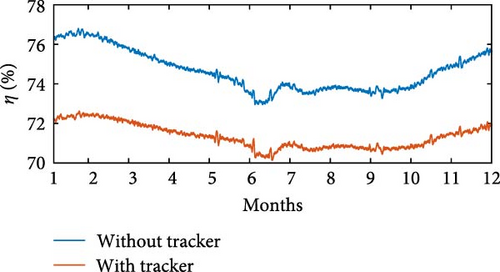
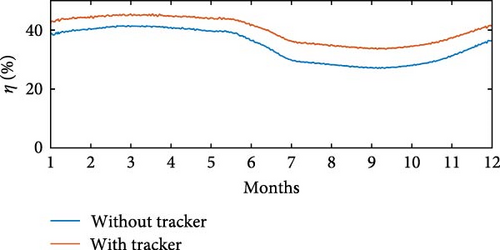
In the simulation without the θoff tracker, the maximum value of Ps was achieved. However, analyzing the complete simulation, a reduction of 67.11% was observed in the variation with the θoff tracker. The θoff tracker demonstrated efficiency in optimizing generation and ensuring maximum utilization. Furthermore, in the simulation with the tracker, the algorithm adjusts θD to prolong the machine excitation time, adjusting to the increase in vv. The influence of vv is also evident in Pmec, as the θoff tracker alters ωg. Consequently, in the tracker simulation, Pmec is higher in regions with elevated vv. Regarding efficiency η, values of approximately 59% ≤ η ≤ 75.6% were recorded in the simulation without tracking and 61% ≤ η ≤ 72% in the simulation with tracking, representing the minimum and maximum values, respectively. Although there was no significant increase in η, the variation was reduced from Δη = 16.6% without tracking to Δη = 11% with tracking.
Table 5 provides the averages of powers Pe, Pmec, Ps, and η under conditions both without and with θoff tracking. An increase in Ps is observed for all three locations when θoff tracking is implemented. Although the simulation without θoff tracking showed a higher overall η, the values of η remained above 65% even with tracking. The θoff values selected during the tracking resulted in a significant increase in Ps for the three locations analyzed and helped to reduce the oscillatory effect by widening the conduction window.
| Location | Pe | Pmec | Ps | η |
|---|---|---|---|---|
| No tracking | ||||
| Location 1 | 903 W | 1,387 W | 1,522 W | 66.13% |
| Location 2 | 679 W | 1,241 W | 1,376 W | 71.05% |
| Location 3 | 574 W | 1,155 W | 1,286 W | 73.67% |
| With tracking | ||||
| Location 1 | 941 W | 1,472 W | 1,600 W | 65.50% |
| Location 2 | 829 W | 1,533 W | 1,640 W | 68.68% |
| Location 3 | 776 W | 1,566 W | 1,655 W | 70.35% |
- The most significant values are highlighted in bold for emphasis.
In Location 1, which has an average wind speed of 5.4 m/s (Table 4), the system without optimization generated 1,522 W, equivalent to ≈1.5 kW. However, by applying the optimization process using the proposed method, energy generation increased to ≈1.6 kW. These results demonstrate the positive impact of the θoff tracking technique on the performance of the SRG, resulting in significant improvements in efficiency and the amount of energy generated, even at relatively low wind speeds. Furthermore, in Location 3, with an average wind speed of 8.4 m/s (Table 4), the optimization process increased the output power from 1,286 W without optimization to ≈1.65 kW, as shown in Table 5. These data indicate the efficiency of optimization under different wind conditions, maximizing energy generation.
4.8. Output Voltage Control of the Generator
To implement the control of the output voltage Vs of the SRG in conjunction with the θoff tracker, a proportional integral derivative (PID) controller was incorporated into the simulation. The value of θon was kept constant at −10°, and the excitation voltage Ve was chosen as the variable manipulated. The PID gains were fine-tuned using the Nelder–Mead simplex algorithm. The reference voltage was set at 180 V and the initial parameters, obtained from prior knowledge of the plant, were kp = 3°/V, ki = 5°/V, and kd = 0.1°/V. The optimization process resulted in gains of kp = 2.3889°/V, ki = 6.6075°/V, and kd = 0.0752°/V, with a deviation of IAE = 20.2185 V. Figures 26(a) and 26(b) present the results of the simulations for vv = [7, 10, 6] m/s, at intervals of 3 s.
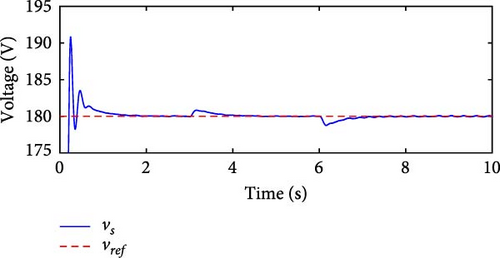
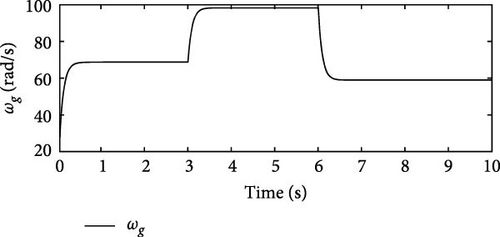
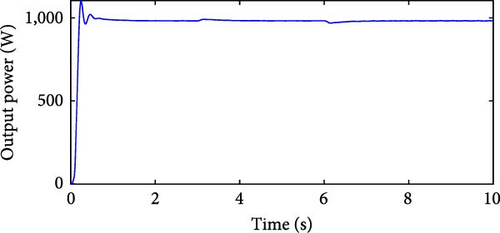
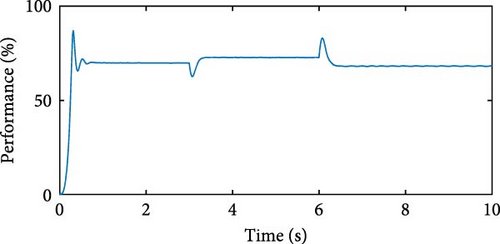
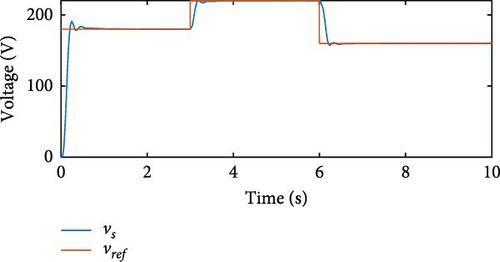
By controlling Vs through Ve, consistent behavior was observed throughout the simulation, with Vs closely tracking the reference voltage . At time t = 3 s, the generator increases ωg to follow the change in vv, which goes from 7 to 10 m/s, and the same happens at t = 6 s. Despite the variation in ωg, the PID controller kept Vs practically constant. Figures 26(c) and 26(d) show the results of Ps and η with Vs control. Even with variation in ωg, Ps remains at approximately 1,000 W, and η shows no significant variations, ranging from η = 68.14% to η = 72.89%. After simulations with variable speed, a simulation was performed varying the reference value, starting with and changing to at t = 3 s, followed by another change to at t = 6 s. Figure 26(e) shows the results of Vs and . In the simulation with variation in and ωg, the PID controller with optimized gains keeps Vs constant. Furthermore, the PID controller operates in conjunction with the θoff tracker.
4.9. Self-Excited Switched Reluctance Generator
In simulating the self-excited switched reluctance generator (SRGSE), a model similar to the SRGIE is adopted, with the addition of a capacitor for initial excitation. It is observed that there is no segregation in the connection circuit between the excitation and generation stages, as illustrated in Figure 6(a). The capacitor, initially charged by an external source such as a battery or solar energy, facilitates the initial excitation of the machine. Subsequently, once the voltage surpasses that of the capacitor, the diode D7 becomes reverse biased, which moves the generator into self-excited mode. To avoid interference from the excitation source, an on–off switch is incorporated, programmed to open after a duration of 0.5 s.
The specifications of the capacitor include a capacitance of 5 mF and an initial charge of 50 V. Keeping a constant speed of ωg = 600 rpm, the firing window is restricted to 0°≤θD ≤ 30°. For simulating the self-excited switched reluctance generator (SRGSE), the same model was employed as the switched reluctance generator with initial excitation (SRGIE). However, in the SRGSE, a capacitor was introduced to facilitate the initial excitation of the machine. Unlike SRGIE, there is no separation between the connection circuits for the excitation and generation stages.
4.10. Analysis with Different Load Values
Initially, a simulation was performed using the same value of Rload = 33 Ω as in the SRGIE model. The resulting output voltage is illustrated in Figure 27(a). Upon analysis of Figure 27(a), it was observed that the SRGSE model did not generate energy with Rload = 33 Ω, as Vs remained below the initial Ve, which led to no energy generation. To comprehensively assess the performance of SRGSE at different values of Rload, simulations were carried out within the range of 10 Ω ≤ Rload ≤ 120 Ω, with intervals of 10 Ω. Furthermore, the speed varied within the range of 100 rpm ≤ ωg ≤ 2, 000 rpm, with intervals of 100 rpm. The initial charge voltage of the capacitor was maintained at 50 V to ensure excitation throughout the range of ωg. From the results of these simulations, the values of Ps were calculated for all combinations of Rload and ωg. The surface plot generated based on the values of Pmec, Rload, and ωg is presented in Figure 27(b). In Figure 27(b), it is observed that Ps increases as the values of Rload and ωg increase.

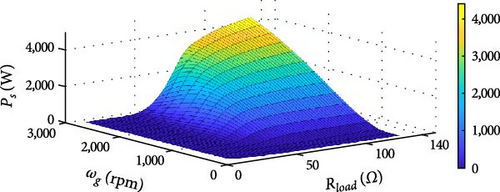
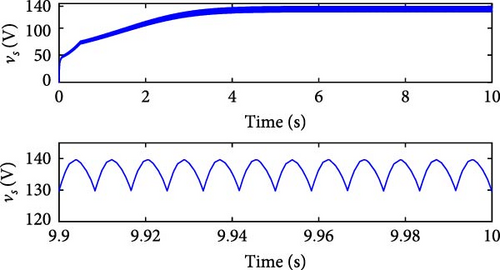
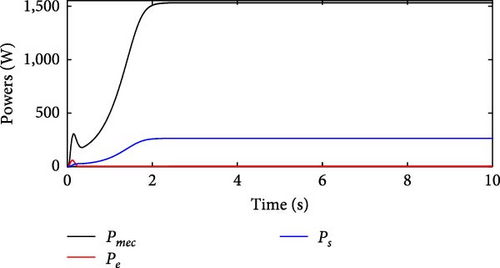
When the resistance is below 60 Ω, the machine reaches a maximum of Ps = 1, 000 W throughout the analyzed range of ωg. In the range between 60 and 120 Ω, there is a significant increase in Ps, which escalates with increasing ωg, eventually exceeding the values of Ps = 4 kW. However, considering the limitation of the actual machine of 2.6 kW, a load value of 100 Ω was selected. This choice allows Ps to approximate 2.6 kW at ωg ≈ 1, 500 rpm. In Figure 28(a), which presents the output voltage of this simulation, the progression can be observed from an initial Ve = 50 V to peak values of Ve ≈ 140 V in the SRGSE can be observed. The waveform shows moments of capacitor charging and discharging. Furthermore, Figure 28(b) illustrates the performance metrics of Pmec, Pe, and Ps for the SRGSE. Following the initial excitation of the capacitor, Pe remains negligible. Under these conditions, Pmec ≈ 1, 200 W and Ps ≈ 184 W were recorded for the SRGSE.
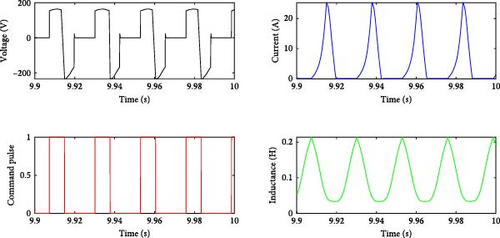
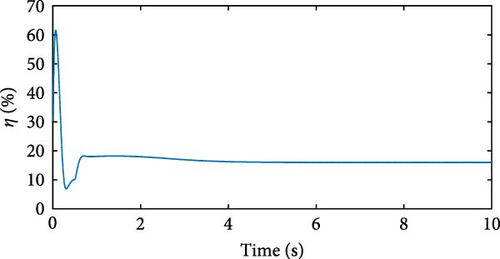
The inductance curves of the three phases of the machine were analyzed using the same method as in the SRGIE. In Figure 29(a), the behavior of voltage Ve, current i, command pulse, and inductance L of one of the phases of the SRGSE is presented. During the phase excitation stage, Ve was approximately 138 V. After the switches were turned off during the generation stage, Ve reached approximately 232 V, with the maximum current ip (peak) reaching values close to 25 A. Figure 29(b) displays the efficiency η, calculated considering Pmec and Ps, as there is no external excitation. With a value of η ≈ 18%, it is relatively low compared to SRGIE, which achieved η > 50%. However, it is important to note that in this configuration, no external excitation source was used, offering a significant advantage for wind power generation applications.
4.11. θoff Tracking Strategy for SRGSE
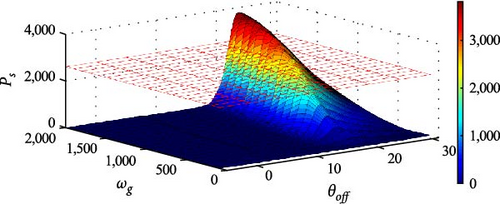
The tracking of θoff for SRGSE followed the same procedure as for SRGIE. The parameters were set as θon = −10°, Ve = 50 V for the initial capacitor charge, and Rload = 100 Ω. To optimize the system, simulations were performed covering 100 rpm ≤ ωg ≤ 2, 000 rpm and −5° ≤θoff ≤ 30°. Figure 30 illustrates the surface that represents the relationship between Ps, ωg, and θoff. In this simulation, the power Ps exceeded the nominal electrical power of the machine. Hence, Ps = 2.62 kW was defined as the maximum observed in the red plane in Figure 30.
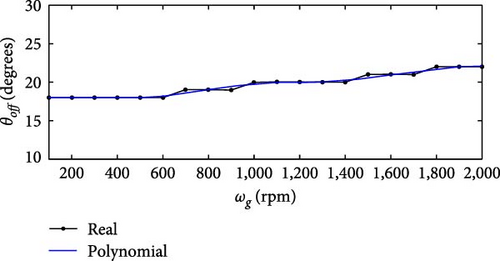
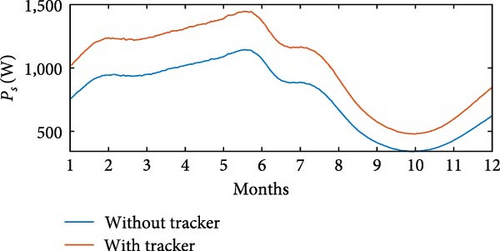
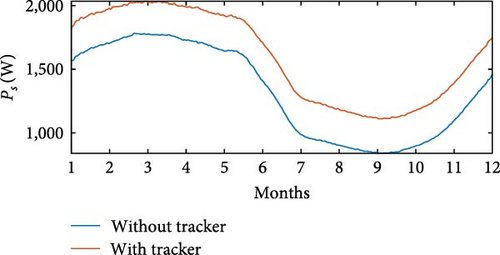
Incorporating Equation (25) in the simulation of the wind power generation system enables us to track the optimal value of θoff in the same way as in the SRGIE. This tracking of θoff is executed for each wind speed profile illustrated in Figure 20. Figures 32a), 32(b), 32(c), 32(d), 32(e), and 32(ff) present the corresponding Ps for these profiles, with and without θoff tracking. For comparison purposes, Figure 25 for SRGIE and Figure 32 for SRGSE present Ps and η associated with the same profiles, with and without θoff tracking. It was observed that Ps with θoff tracking performed better in both cases, in the SRGIE and in the SRGSE, highlighting the efficacy of the tracker in conjunction with optimized parameters. It is observed that, although the SRGSE θoff tracking aims to maximize Ps, the tracking, in addition to achieving this maximization, also enhances η. In contrast, in the SRGIE, while there was a maximum of power, there was no significant improvement in η. This underscores the dual benefits of the tracker in the SRGSE scenario, optimizing both power output and efficiency.

4.12. Discussion
The amount of electrical energy generated from wind power is intrinsically related to wind speed vv. Although wind farms are often located in regions with higher wind availability, it is possible to harness electrical energy even at low wind speeds, provided that these winds remain consistent and that the generator used can operate effectively at low speeds. This study builds on previous research involving the switched reluctance generator (SRG), which functions as both a motor and a generator. Specifically, an SRG with a geometry of 6 × 4 was designed and built, its performance was evaluated, and a novel technique to determine the inductance profile was introduced. This enhancement improves the efficiency of the model and, consequently, the overall system.
Our innovative evaluation of the SRG for wind power generation integrates wind turbine modeling, the θoff tracking technique, and optimization of PID controller gains for both the SRGIE and SRGSE models. The primary objective is to analyze the performance of the SRG under low wind speed conditions. The results presented here are derived from laboratory experiments and simulations, all validated experimentally. The wind turbine was sized to match the built and validated SRG, and the SRG simulations were compared with results from other research studies [3, 4, 6, 7, 8, 16].
As the wind speed vv increased, the generation of electrical energy decreased. This phenomenon occurred because increasing the generator speed ωg to match the MPPT of the turbine reduced the machine’s excitation time. To optimize performance across the entire speed range, the θoff tracker was implemented, dynamically adjusting the value of θoff to vv and consequently ωg varied. The θoff tracking methodology was adapted for both the SRGIE and SRGSE models. For SRGIE, both the shaft power Ps and the efficiency η were analyzed. In the case of SRGSE, which does not rely on an external excitation source, the value of θoff was selected that provided the highest Ps. To evaluate the performance of the θoff tracker, simulations were performed using real vv data for both SRGIE and SRGSE models. The results demonstrated the efficiency of the θoff tracker in effectively maximizing generation in both system configurations.
In the SRGIE model, the voltage output control Vs was implemented using an optimized PID controller. Remarkably, this controller operates in parallel with the θoff tracker, allowing efficient control of the SRGIE’s Vs while simultaneously enhancing energy generation. Meanwhile, in the SRGSE model, simulations were performed by varying the load resistance. Our results confirmed the observations made by Bernardeli et al. [9], showing that Ps increases as the load value increases. Simulations using real wind speed data vv allowed us to evaluate the performance of SRGIE and SRGSE in three regions. In Location 1, with vv ≈ 5 m/s, the SRGIE achieved Ps ≈ 1, 548 W, and SRGSE achieved Ps ≈ 480 W. In Location 3, with vv ≈ 8.4 m/s, the SRGIE obtained Ps ≈ 1, 655 W, and the SRGSE obtained Ps ≈ 2, 442 W.
Both the SRGIE and SRGSE models demonstrated the ability to generate electrical energy across different vv profiles. The SRGIE is observed to perform better under lower vv conditions, while the SRGSE excelled at higher speeds. However, determining which model is superior remains challenging, as each involves distinct parameter definitions and employs different methodologies for the tracking of θoff. It should be noted that all results were obtained using a custom SRG prototype (handmade SRG prototype). Consequently, on a commercial machine with optimized parameters, performance is expected to surpass that found in this study.
5. Conclusion
The primary objective of this study was to design, construct, and find parameters for a wind power generation system using a switched reluctance machine (SRM). Optimization techniques were applied to enhance the efficiency of the system and maximize the power of the electrical output. The SRM model included two excitation strategies: independent excitation and self-excited modes. All objectives were achieved, which confirms the hypothesis. The advantages and disadvantages of each excitation strategy were discussed. The coil turn-off angles θoff tracker effectively maximized energy generation in all three analyzed regions, contributing to the stability of η.
For output voltage control, an optimized PID controller was implemented to regulate the input voltage, demonstrating its compatibility with the θoff tracker. Wind energy has emerged as a sustainable alternative with minimal environmental impact. Although high-wind-speed regions are optimal for wind power generation, simulations and real-world experiments show that SRMs are feasible even in areas with low wind speeds and gentle breezes. Therefore, it is concluded that SRMs can efficiently harness wind energy in regions with low wind speeds.
Conflicts of Interest
The authors declare no conflicts of interest.
Acknowledgments
This work is financed by national funds through FCT—Fundação para a Ciência e a Tecnologia, I.P., under the projects UIDB/00048/2020 (DOI 10.54499/UIDB/00048/2020), with funding provided to researcher Antonio Paulo Coimbra, and by the National Council for Scientific and Technological Development (CNPq/Brazil) through a Productivity Scholarship in Research, process 301644/2022-5, with funding provided to researcher Wesley Pacheco Calixto.
Open Research
Data Availability
The Matlab codes and computational routines are currently being uploaded to the Code Ocean platform and will be available soon. In the meantime, the code files can be provided upon request to the corresponding authors.


