Modelling Land Surface Temperature Variation in New Guinea Island from 2000 to 2019 Using a Cubic Spline Model
Abstract
Land surface temperature (LST) is a critical indicator variable in climate science. In this study, the variation of LST on the island of New Guinea during 2000 to 2019 was investigated using a cubic spline model and a multivariate regression model. The data were obtained from the National Aeronautics and Space Administration moderate resolution imaging spectroradiometer database. This study focused on 90 subregions with 105-pixels of latitude 90 kilometer apart. These subregions were categorized into 10 super-regions. The results showed that the mean change in LST for all 90 subregions was +0.086°C per decade with a confidence interval of (0.028, 0.144)oC. There were five super-regions with a significant mean LST change. LST increased significantly in the central-north, central-south of the island (super-regions B1, C1, and C2 with 0.117°C, 0.162°C, and 0.185°C, respectively) and the southern part of Papua New Guinea (super-region E2 with 0.217°C), whereas it decreased in the middle part of the Indonesian territories (A2 with −0.122°C). The results also showed that LST variation occurs at the subregional level. Climate change mitigation methods are critical for reducing temperature rise and limiting any negative effects on the region.
1. Introduction
Land surface temperature (LST) represents the radiative skin of the Earth’s surface, is primarily influenced by solar radiation, and holds significant importance in climate research. LST serves as a crucial parameter in comprehending land surface dynamics across various scales, from local to global, within the realm of physics. Globally, it will impact ecosystems, living things, and human health [1, 2]. LST is a combination of vegetation and bare soil temperature. LST varies rapidly as a result of the two components’ rapid responses to changes in incoming solar prominence. Variations in LST are also affected by changes in the quantity of clouds and aerosols in the atmosphere and by the intensity of daylight during the day. LST influences the energy distribution between land and vegetation, resulting in the surface air temperature [3]. The increase in LST as an indicator of climate change has caused the melting of ice in the regions of the poles and areas of high elevation, which has resulted in rising sea levels and endangered several cities around the world [4].
Global LST has increased approximately 0.8°C per century since 1880 and approximately 0.2°C per decade since 1951 [5]. In 2020, the global average temperature was 1.2 ± 0.1°C above the 1850–1900 baseline [6]. In Asia, the average temperature was 1.39°C higher than the 1981–2010 average [7]. In high-mountain Asia, the LST was significantly rising during 2001–2017 [8]. Since 1910, annual and seasonal ocean surface and island air temperatures in the southern Pacific region, including Papua and Papua New Guinea, have increased by 0.6°C–1.0°C per decade [9]. By 2030, the projection for all emissions scenarios indicates that the annual average temperature in New Guinea will increase in the range of 0.4–1.0°C [10]. However, the National Aeronautics and Space Administration moderate-resolution imaging spectroradiometer database revealed no substantial increase in LST in New Guinea during 2000–2019, with an average temperature change of +0.012°C per decade [11], whereas the nearby New Britain Island has a significant increase in LST with an average of 0.56°C per decade [12].
The purpose of this study is to examine at the pattern and variation of daytime LST on New Guinea Island from 2000 to 2019 by extending the study of Munawar et al. [11], which reduces the distance between subregions and takes care of spatial correlation. The cubic spline and a multivariate regression model were used to analyze the LST time series data.
2. Materials and Methods
2.1. Study Area and Data
New Guinea is the world’s second-largest island, after Greenland. Politically, it is divided into two territories: Indonesia to the west and Papua New Guinea to the east. The land use has changed from rainforests to oil palm plantations. The climate in Papua New Guinea is predominantly tropical, characterized by rainfall throughout most seasons. However, significant changes in climate have been observed over recent decades, attributed to fluctuations in solar radiation, increased occurrences of volcanic eruptions, and heightened levels of greenhouse gas emissions [13]. The average maximum annual temperature ranges from 23°C to 32°C [14]. During 2000 and 2019, the minimum, average, and maximum LSTs from all subregions in Figure 1 were 13.8°C, 25.6°C, and 32.8°C, respectively.
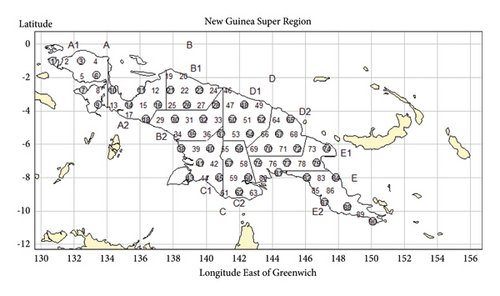
New Guinea Island is located within the geographical coordinates of 130° to 152° East longitude and −11° to 0° South latitude. This study took a sample of 90 subregions as shown in Figure 1. The subregions were placed 105 pixels (95 km) apart in latitude and longitude. The distance between each region’s central point and its nearest neighbor is equal and contains 49 pixels in a 7 × 7 array, a layout that covers the whole island. The first analysis based on the previous study [11] focused only on 45 subregions (shaded circles in Figure 1) where the subregions were positioned at intervals of 210 pixels along the sample line widths, approximately 190 km apart. This analysis classified the island into five super-regions named super-regions A to E which represent north-west, central-north Papua Indonesia, central-south of the island between Indonesia and Papua New Guinea, north-east, and south-east of Papua New Guinea, respectively.
For the second analysis, all 90 subregions were included. This analysis divided each super-region of the first analysis into two super-regions. For example, super-region A was divided into A1 and A2, yielding ten smaller super-regions. The distance between each subregion is 105-pixels of latitude 95 km apart.
The LST eight-day time data in Kelvin scale (then converted to Celsius) were downloaded from the NASA MODIS database, specifically from NASA’s Terra MODIS satellite, during 2000–2019 for each subregion [15]. The data are based on the sample points that have been determined on the island by avoiding placing points on the sea. If the point is placed on the sea, there will be no LST data from the satellite or considered as a missing value. MODIS LST data are obscured by clouds and other atmospheric disturbances and consequently influence the data availability. The R language and environment was used to analyze the data and to create the graphics [16].
2.2. Statistical Methods
Several statistical techniques have been used in a number of studies to examine trends and patterns in surface temperature such as least-squares linear regression [17–19] and cubic splines [20]. However, the distribution of LST varies considerably in both time and space. Data that are related to each other in terms of time lags and between two nearby places will influence one another, which can affect the results of inferential analyses [21].
The position and number of knots used to smooth the data are critical for cubic spline fitting. Some studies have selected the positions of knots based on the season [20, 26, 27]. The difference in LST may be associated with heatwaves in the tropical area during April and May and rainfall during June–September [28]. This study used eight knots, four of which were placed at the start of the year and four at the end, in accordance with the seasons that are typical of tropical regions.
3. Results and Discussion
Super-region A (north-west) was selected to describe the results of New Guinea Island for the northwest region. Figures 2–4 show the seasonal patterns after fitting a natural spline function with eight knots, denoted by solid red curves. The eight knots’ locations in the model are indicated by the blue crosses.
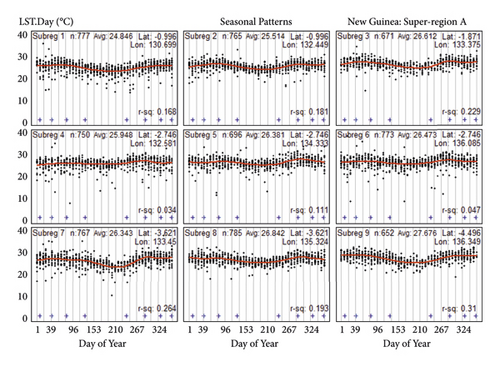
The results of the first analysis revealed that the LST has a seasonal pattern with two summer peaks (Figure 2). During the rainy season, the lowest LST occurred on day 210 (the end of June), and the highest LST occurred on day 324 (the end of October). Subregion 9 has the highest average LST (27.7°C).
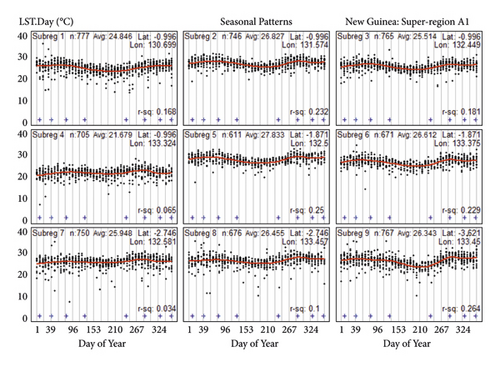
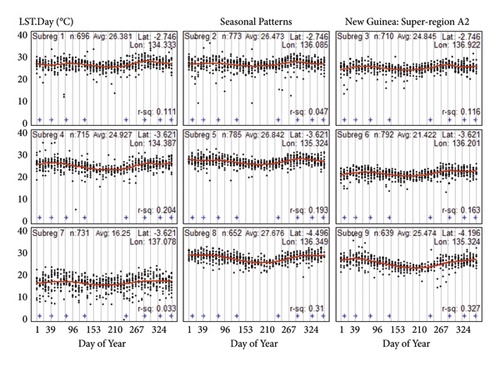
Figures 3 and 4 show the results of the second analysis for the northwest area of two super-regions A1 and A2. The LST patterns in each subregion showed only minor seasonal changes. Even though each subregion has different coordinates (latitude and longitude), the seasonal patterns are very similar. In general, the local minima for LST occurred in January corresponding to the rainy seasons.
As shown in Figures 3 and 4, LST increased from October to November (days 286–305) in subregions 1, 2, 3, 5, 7, and 8. On the other hand, LST increased from October to December (days 286–363) in subregions 4, 6, and 9, with stability toward the end of the year. Regarding the seasonal pattern, LST decreased on approximately days 172–210 (June to July), corresponding with the rainy season. This is due to the fact that land is covered with wet vegetation [29]. These findings showed that seasonal patterns were not clear in the subregions of New Guinea Island.
Figures 5–7 display the patterns and trends of seasonally adjusted LST for super-region A (north-west) of New Guinea island. The estimated coefficients of autoregressive ar1 and ar2 were small, indicating that the time series of seasonally adjusted of daytime LST are independent. The black lines denote the fitted lines from the linear model, and red curves denote the natural cubic splines. Figure 5 shows that the LST was significantly increasing in subregion 4 and decreasing in subregions 7 and 9. However, the results of cubic spline model showed that the LSTs in subregions 7 and 9 were significantly changing. Figures 6 and 7 reveal that more subregions in the northwest super-regions had LSTs that were significantly changing.
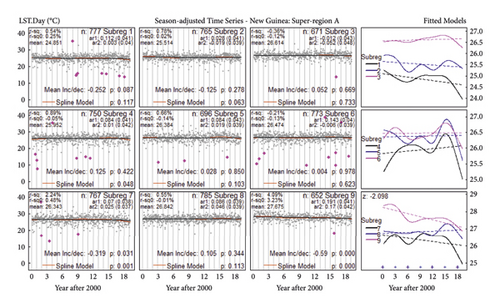
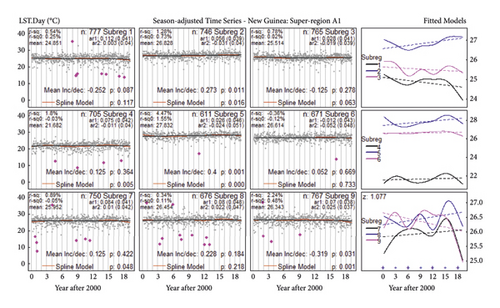
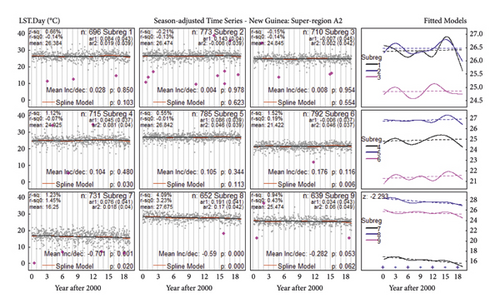
The z value statistics displayed in the bottom-right panel of Figures 5–7 are based on statistical testing; there is no average daytime LST increase in a super-region, assuming that increases in subregions of the same super-region are the same. The average daytime LST for super-region A (north-west) of −0.11°C per decade was statistically significant with a z value of −2.098 and 95% confidence interval of (−0.21, −0.01) (Figure 5). As shown in Figure 6, the mean daytime LST for super-region A1 was 0.058°C with a 95% confidence interval of (−0.048, 0.164), with a nonsignificant z value of 1.077. As shown in Figure 7, the average daytime LST for super-region A2 was −0.121°C with 95% confidence interval of (−0.226, −0.018), showing significant z value of −2.293. The variations in LST varied by super-region.
Figure 8 shows 95% confidence interval of average daytime LST variations for 45 subregions (top panel) and for all 90 subregions (bottom panel) together with the overall average LST. The 45 subregions showed a nonsignificant increase of an overall average daytime LST with 0.012°C (95% confidence interval: −0.052, 0.077), while the overall average daytime LST for the 90 subregions was a statistically significant increase, with 0.086°C per decade (95% confidence interval: 0.028, 0.144).
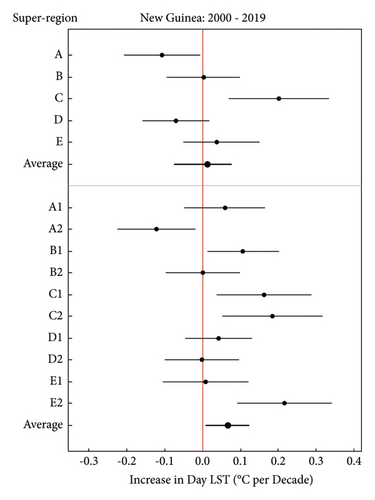
There were variations in the overall daytime LST for each super-region with five super-regions containing 45 subregions. The average daytime LST changed per decade in super-regions A (north-west), B (central-north), C (south), D (north-east), and E (south-east) by −0.116°C, 0.0026°C, 0.206°C, −0.076°C, and 0.046°C, respectively. However, only the northwest and south regions showed a significant change in overall daytime LST. For the analysis of ten super-regions containing 90 regions, only super-region A2 (north-west) had a significant LST decrease with −0.122°C, whereas for super-regions B1 (central-north), C1 and C2 (central-south), and E2 (south-east), the LST significantly increased with 0.107°C, 0.162°C, 0.185°C, and 0.217°C, respectively.
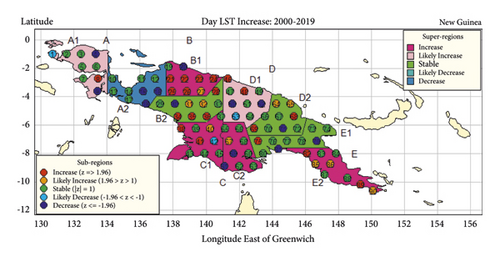
A schematic map of New Guinea Island’s super-regions and subregions is shown in Figure 9. Significant increases in daytime LST are depicted by dark-pink-colored regions, decreases are depicted by dark-blue-colored regions, and likely increases and decreases are depicted by light-pink and light-blue colored regions, respectively. Regions exhibiting no change are shown in green. The daytime LST in super-region A2 decreased significantly, while in super-region D2 it likely decreased. The daytime LSTs in super-regions B2, C2, and E1 were stable. In super-region A1, the daytime LST was likely to be increased, while daytime LST in the remaining super-regions significantly increased. Overall, New Guinea Island had warmer LST with an average increase of 0.086°C per decade in the range (0.028, 0.144) or 0.86°C per century. This result is similar to the Papua New Guinea National Weather Service’s prediction of 0.4–1.0 [10].
During the study period spanning from 1956 to 2016, shifts in climate conditions were observed, specifically regarding rainfall and temperature patterns in Papua New Guinea. Rainfall has shown a notable increase in the region. Although temperatures in Papua New Guinea do not typically reach extreme lows or highs like in other nations, the analysis indicates a clear upward trajectory. Without intervention to address the current pace of climate change, the upward trends in both rainfall and temperature are expected to persist [30].
The rise in LST on New Guinea Island can be an indicator of climate change due to its association with frequent fluctuations in weather patterns [31]. Changes in LST could be caused by urbanization LU/LC change as a human effort to fulfill the population’s needs [32]. The West of New Guinea Island has 2% of forest lost since 2001 as an effect of the development of industrial plantation, mining, and building of facilities [33]. The environmental damage, mainly due to reduced rainforest or green open space as the result of massive human activities, would have a substantial effect on global warming. The increase in LST would affect the reduction of crops and fishing yield, which can lead to a reduction in the quality of life of the people living on the island.
4. Conclusions
On New Guinea Island, many regions were found to have an increase in daytime land surface temperature. There was not significant increase of overall average LST in 45 subregions. However, when the number of subregions was increased for 90 subregions by reducing the distance between subregions, the overall average LST was significantly increased with +0.086°C per decade (confidence interval: 0.028, 0.144). LST increased significantly in the central-north, central-south of the island (super-regions B1, C1, and C2) and the southern part of Papua New Guinea (super-region E2), whereas it decreased in the middle part of the Indonesian territories (super-region A2). The LST variation also occurs at the subregion level. This finding was part of the study by Munawar [34].
This study chose a distance between each region’s central point of 105-pixels (95 km in latitude and longitude), which is reasonable to use as a representative sample and to minimize spatial correlation. However, it is important to take into account the optimal spacing between subregions on the smaller islands. New Guinea Island consists of many mountains and vegetation, which is typical of tropical areas in general. This result is only based on the LST eight-day time from Terra MODIS; further investigation should compare the LST variation data obtained from MODIS Terra and Aqua. Future research should take into account additional elements connected to LST, such as land elevation, land use/land cover, and the Normalized Difference Vegetation Index.
Conflicts of Interest
The authors declare that they have no conflicts of interest.
Open Research
Data Availability
The data can be obtained from https://tinyurl.com/New-Guinea2.


