Investigation of Visible and UV Light-Induced Photocatalysis Properties of Oleic Acid-Ligated Cobalt-Mixed Magnesium Ferrite Nanoparticles for Photodegradation of Cationic and Anionic Dyes
Abstract
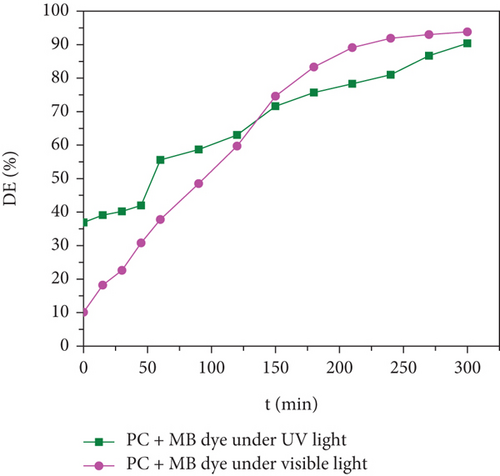
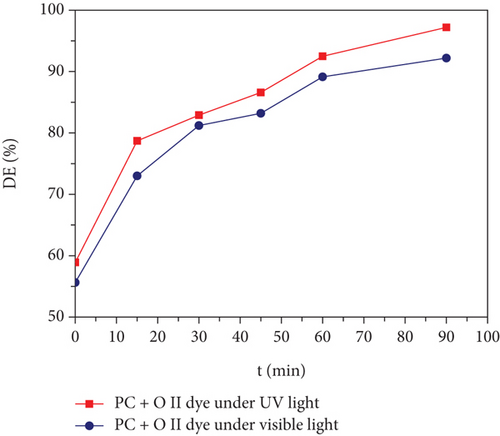
Owing to numerous potential applications in multiple fields, the study of nanosized magnetic spinel ferrites has been gaining significance. Synthesis and characterization of high-quality magnetic nanocrystals with narrow size distribution, enhanced magnetic saturation, and outstanding properties for bioenvironmental applications are presented in the current study. Nanoparticles of oleic acid-ligated Co0.5-mixed Mg0.5Fe2O4 were prepared by a simple thermal decomposition method. The effect of cobalt (Co2+) content on the structural, optical, magnetic, and thermal properties of magnesium ferrite was assessed by powder X-ray diffraction (PXRD), Fourier transform infrared spectroscopy (FT-IR), and vibrating sample magnetometer (VSM), thermogravimetric analysis (TGA), and differential scanning calorimetry (DSC). High-resolution transmission electron microscopy (HR-TEM) and energy dispersive X-ray (EDX) spectroscopy were used to determine morphology and composition, respectively. Nanoparticles produced are highly crystalline and homogeneous, having an average size of 10 nm, with large saturation magnetization (61 emu/g) and high magnetic moment. Photocatalytic properties of prepared nanocrystals were studied by degradation of anionic Orange II and cationic methylene blue (MB) dyes under UV and visible light radiations for different time intervals. The anionic Orange II dye exhibited higher degradation, up to 97.2% and 92.2%, within a 90-minute time period of ultraviolet and visible light irradiation, respectively. The cationic MB dye also displayed significant degradation, up to 91.9% and 93.8%, within 300 min under UV and visible light sources, respectively. The synthesized OA-ligated nanoparticles degrade cationic and anionic dyes more effectively than previously reported in the literature and, thus, can be prime candidates for effective photo catalytic dye degradation and waste water cleaning applications, through the harvesting of ambient solar energy.
1. Introduction
The world is experiencing major clean water deficiency. Population explosion and growing agricultural production have led to an imbalance in water demand and availability. Solid waste or discharges from various industries, including dyeing, fabric, leather, paper, and wood, pollute aquatic systems with harmful organic water-soluble dyes [1]. Even tiny amount of these contaminants can be extremely hazardous and carcinogenic and may degrade to generate undesirable by-products [2, 3]. In humans, for example, excessive methylene blue (MB) dye pollutants can result in vomiting, tetraplegia, elevated heart rate, and inflammation of the skin [1, 3]. Many traditional approaches are currently used to eliminate biological pigments or dyes in wastewater. Traditional approaches to wastewater clean-up, such as adsorption, chemical, and membrane technology, have poor efficacy due to their complexity and high costs. Photocatalysis, a more advanced technology, offers the potential for effective degradation of organic pollutants [4, 5]. The degradation is achieved by the generation of extremely reactive hydroxyl radicals, which modify organic impurities to mineral-based compounds like H2O, salts, and CO2 by-products [1, 6, 7].
Synthesized iron oxide nanoparticles (IONPs) have properties such as easy removal postclean-up, recyclability, accurate bandgap, and chemical stability, making them potential photocatalysts for waste-water treatment. These nanoparticles, found in various minerals, demonstrate high breakdown efficiency for various organic pigments or dyes, making them attractive for photocatalytic applications [1, 8, 9]. The magnetite (Fe3O4) NPs can act as photocatalysts for a variety of organic contaminants such as MB, nitrobenzene, rhodamine B (Rh-B), azo dye, methyl red, Congo red, and O II sodium salt dyes [10–15]. Several investigations on spinel ferrites have been conducted due to their economic production, chemical stability, facile and rapid separation, reusability, and recoverability [16, 17].
Dyes are synthetic organic chemicals that are extensively used across a range of sectors, especially cosmetics, leather, printing, plastics, food, and textiles [18–20]. Because of their widespread application in industry, they are common pollutants in wastewater [21]. MB is a cationic dye, widely utilized in colouring cotton, wool, and silk. Some of the negative effects of MB in wastewater include diarrhea, nausea, burning eyes, and vomiting [20, 22, 23]. The compound Orange II, abbreviated OII, has a complicated structure made up of two aromatic rings, an azo bond, and a sulfonated group. Effluents from the cosmetic and textile dyeing industries contain significant amounts of OII. OII is an azo dye that degrades slowly but is comparatively stable and robust to microbial attack. In general, OII is an anionic dye, highly stable, and has strong resistance to chemical, photochemical, and biological degradation under aerobic circumstances, making total decolorization and full mineralization of contaminated water extremely difficult. As a result, the treatment of OII from wastewater has garnered increasing attention [24, 25]. Photocatalysis is a water purification technology that involves mineralizing pollutants and producing inorganic molecules like carbon dioxide and water. The primary advantage of spinel ferrites as photocatalysts is their smaller band gaps, enabling absorption of both visible and ultraviolet radiation [26–29] and, thus, more efficient extraction of energy from solar radiation. The application of spinel iron oxide as photocatalysts has an added benefit due to their magnetic character, which enables the catalyst to be easily separated and removed from the reactor solution [28, 30]. Photocatalysis is influenced by contaminants, particle size, reactor geometry, environment, and degree of agglomeration, among other factors [31, 32].
Synthesis techniques, including coprecipitation, hydrothermal, solvothermal, and thermal decomposition methods, have been successful in producing spherical, cubic, and nanorod crystals, enhancing magnetic characteristics [33]. Iron oxide nanocrystals were produced as spheres and hexagons using solvothermal and hydrothermal techniques [34, 35]. The thermal decomposition approach produced monodispersed nanocrystals of spinel ferrite with high crystallinity and narrow distributions [36]. This synthesis process is straightforward, regulating grain dimension and size distribution using high boiling point solvents, resulting in homogenous magnetic nanoparticles (MNPs) with varying surface dimensions and shapes [37, 38]. Keeping these aspects in mind, we had adopted the more ecofriendly thermal decomposition method to synthesize the MNPs. The produced spinel ferrites are expected to have the general formula C00.5Mg0.5Fe2O4. In this method, we used acetylacetonate precursors and high-boiling solvents to carry out the synthesis at a high temperature of 320°C which allowed us to control the particle size, shape, and magnetic properties. The photocatalytic studies were conducted in the presence of ultraviolet (UV) and visible light using cationic and anionic dyes. When compared to MB dye (cationic), Orange II dye (anionic) has shown an impressive photodegradation response within a time interval of 90 min under both visible and UV irradiation, which is better than previously reported studies (Table 1). Therefore, oleic acid-ligated MNPs presented in the current study are promising candidates for cleaning or purifying the wastewater, photo biodegradation, and a variety of other applications via harvesting of ambient solar radiation.
| Photocatalyst | Synthesis method | Light source | Dye | Time (min.) | % DE | Reference |
|---|---|---|---|---|---|---|
| Zn0.2Co0.8Fe2O4 | Green combustion | Visible | Congo red | 150 | 85 | [62] |
| NiFe2O4 | Coprecipitation | Sunlight | Methyl orange | 300 | 72.6 | [63] |
| Co0.5Zn0.25Ni0.25Fe2O4-TiO2 | Coprecipitation | Sunlight | Methyl orange | 360 | 80 | [64] |
|
Facile reduction-oxidation | Visible | Orange II | 300 |
|
[25] |
| MnFe2O4/TA/ZnO | Hydrothermal | Visible | Congo red | 90 | 84.2 | [65] |
| OA-coated Co0.5-mixed Mg0.5Fe2O4 NPs | Thermal decomposition |
|
Orange II | 90 |
|
Present study |
2. Materials and Method
2.1. Materials
All chemical precursors and compounds employed to carry out the synthesis and assessment of nanoparticles have been purchased from recognized international manufacturers. Iron (III) acetylacetonate (Fe(CH3COCHCOCH3)3) (Sigma, ≥99.9%, powder), magnesium acetylacetonate dihydrate (Mg(CH3COCHCOCH3)2• 2H2O) (Sigma, 98%), cobalt (II) acetylacetonate ((CH3COCH=C(CH3)O)2Co) (Sigma, ≥99%,), 1-octadecene (CH2=CH(CH2)15CH3) (Sigma, 90%, boiling point (bp) 314.4°C), oleic acid (CH3(CH2)7CH=CH(CH2)7CO2H) (Thermo Fisher, 90%, bp: 360°C), oleylamine (CH3(CH2)7CH=CH(CH2)7CH2NH) (TCI Chemicals, >50%, bp: 364°C), ethanol (SRL, >99.9%), hexane (Sigma, 95%) methylene blue (>96%, SDFCL), and Orange II sodium salt (Sigma, ≥85%).
2.2. Synthesis of Magnetic Nanoparticles (MNPs)
Spinel ferrite of cobalt- (Co-) mixed magnesium ferrite (MgFe2O4) NPs was synthesized by the modified thermal decomposition method using high-boiling solvents [39, 40]. Briefly, to synthesize 1 g of the target chemical, 40 mL of growth solvent (1-octadecene), surfactant ligands oleic acid (≈7 mL), and oleylamine (≈8 mL) were placed in a 3neck round bottom (RB) flask and mixed by using stirrer up to 15 min for homogeneity. We were able to alter the form of the nanoparticles by adjusting the oleic acid/oleylamine ratio. The resulting organic solvent combination was heated up to 110°C to evaporate any water molecules that were present. Stoichiometric ratio of metal precursors such as iron acetylacetonate (Fe (acac)3), cobalt acetylacetonate (Co (acac)3), and magnesium acetylacetonate dihydrate (Mg (acac)2.2H2O) was added to the solvent mixture in round bottom flask and the solution stirred for 15 min to achieve uniformity. After this, the N2 gas was connected to 3neck RB flask for maintaining the N2 atmosphere. The solution mixture was further heated up to around 320°C with a heating ratio of ≈5°C per minute with reflux set-up by using a heating mantle. To achieve the required MNPs, the solution was refluxed at 320°C for 60 min. Finally, the reaction mixture was naturally cooled to room temperature (RT) to eliminate unreacted compounds. An adequate quantity (50 mL) of polar solvent (ethanol) was poured into the round bottom flask to diminish surface tension and activate precipitation of nanocrystals. After that, the precipitate was washed several times with polar solvent, magnetically separated, and dried. For further investigation, the dried MNPs were thoroughly ground and redispersed in an antipolar solvent (hexane).
2.3. Characterization Techniques
All characterizations and analyses were performed with commercially available instruments from international manufacturing companies. The as-synthesized nanoparticles’ crystal phase purity, crystallinity, crystal structure, and crystallite (grain) diameter were investigated using the powder X-ray diffraction (PXRD) technique at RT. The specimen (powder) was analyzed using a Bruker X-ray diffractometer with Cu Kα (λ = 1.5406 Å) radiation, performed with 20 mA current and 40 kV voltage. The PXRD data was captured in the 2θ of 20 to 80° at a slow scanning rate of 0.05 step size. The average particle size, surface morphology, and elemental composition of the sample were assessed using high-resolution transmission electron microscopy (HR-TEM) equipment (JEOL JEM F200). The Fourier-transformed infrared (FTIR) spectra were used to analyze the functional group and surface ligands. The powder specimens were evaluated using infrared (IR) intensity data. The FTIR spectra of prepared nanoparticles were obtained at room temperature using a Shimadzu FTIR spectrometer (IRAffinity-1S) using the wavenumber range of 4000 to 400 cm-1. Thermogravimetry (TG) and differential scanning calorimetry (DSC) (TA instruments, SDT650) were carried out to examine the change in mass of the sample and the decomposition mechanism of the prepared NPs as a function of temperature. The magnetic hysteresis of the as-synthesized MNPs was assessed using a vibrating sample magnetometer (VSM) (lakeshore 7400) at ambient temperature with an applied ±15 kOe magnetic field.
The photocatalyst (PC) degradation activity of OA-ligated Co0.5-mixed Mg0.5Fe2O4 NPs was investigated by the degradation of the cationic methylene blue and anionic Orange II dyes under both UV (λ = 254 nm, 64 W) and visible (λ = 454 nm, 50 W) lights (Heber scientific photo reactor) and the dye degradation of specimen measured by ultraviolet-visible (UV-Vis) spectrometer (Analytic Jena). A 200 mL beaker was kept inside the visible photoreactor, and a 100 mL quartz tube was used in the UV photoreactor to contain an aqueous solution of MB and Orange II dyes at a concentration of 10 mg/L (10 ppm). Following that, 50 mg of the photocatalyst sample (OA-Co0.5Mg0.5Fe2O4), was transferred to the quartz tube and beaker above. To achieve a well-dispersed, homogenous solution, the solution mixture (dye + MNPs) was then stirred for 60 minutes in the dark (without light). This sample was considered to be at 0 minutes in order to test the photocatalyst’s efficiency in the absence of light. After 60 minutes, the light is turned on, and following another 15 minutes, some samples are taken out with a syringe. This sample is labelled as 15 minutes in the manuscript. In a similar manner, we took samples after every 15 minutes, for one hour. After an hour, we took samples at 90 and 300 minutes for MB dye and after every 30 minutes for Orange II dye. A photodegradation study of all samples with different time periods has been recorded using a UV-Vis spectrometer.
3. Results and Discussions
3.1. XRD Analysis
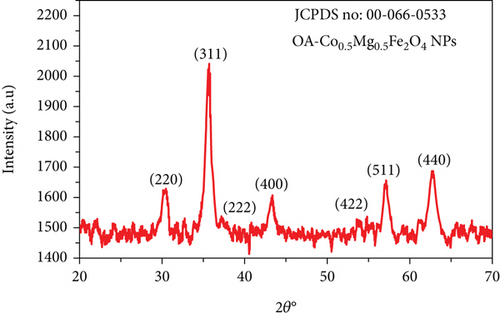
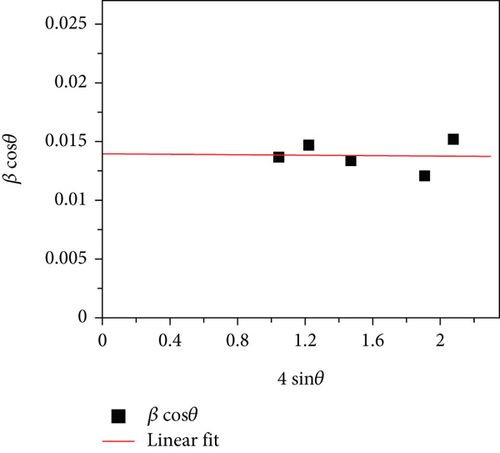
The average crystallite size obtained from all peaks was 10 nm by using equation (1). The cubic lattice parameter (a) was evaluated using , where dhkl is d-interplanar spacing of the crystal lattice which was determined by Bragg’s equation nλ = 2dsinθ, (hkl) corresponds to the Miller indices, and n is the order of the diffraction pattern (n = 1). The obtained lattice parameter (a) of as-synthesized NPs was 8.38 Å, and the unit cell volume was 588.8Å3. The Williamson-Hall method was used to elucidate the contribution of nonuniform lattice microstrain in the broadening of XRD peaks. βcosθ = kλ/DXRD + 4ϵsinθ, where ϵ is the microstrain. Plot of βcosθ vs. 4sinθ and the corresponding linear fit are shown in Figure 1(b). From the slope of the plot, the microstrain was estimated to be −1 × 10⁻⁴, which is extremely small. Although the strain that leads to broadening in XRD peaks is of nonuniform nature, the negative sign indicates that compressive lattice strain is more dominant in the synthesized nanoparticles. Crystallite size obtained from the intercept of the Williamson-Hall plot turns out to be 9.9 nm, which agrees well with the value obtained using Scherrer’s method.
3.2. Morphology of the Nanocrystals
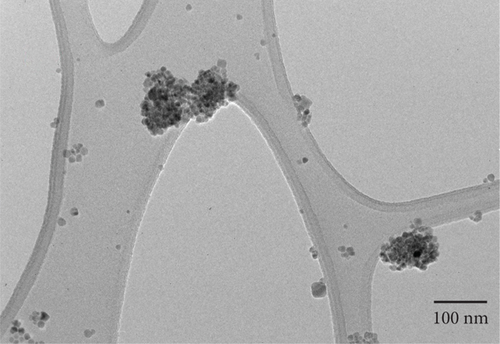
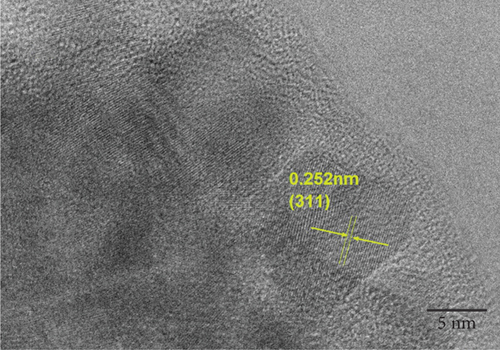
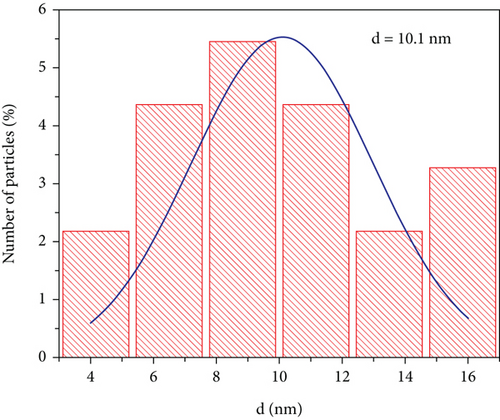
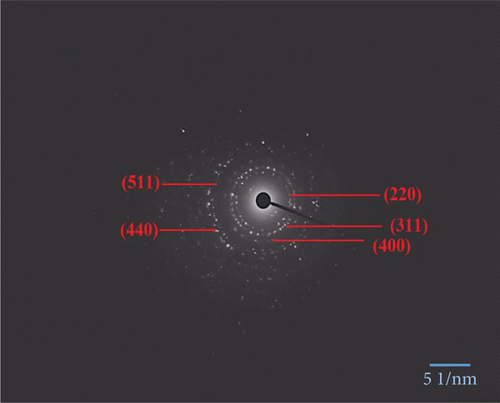
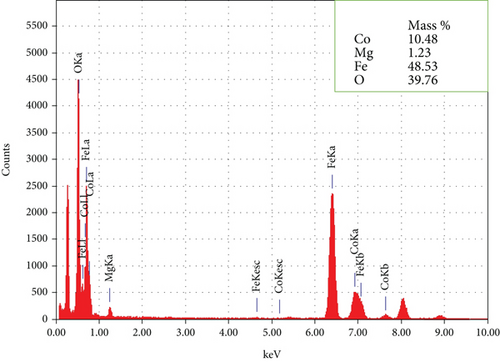
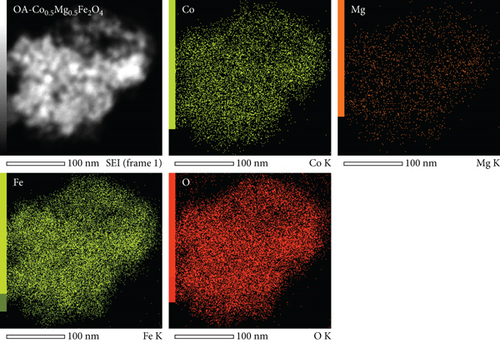
Figures (a) and 2(b) display images of as-synthesized nanoparticles captured under a high-resolution transmission electron microscope (HR-TEM). The micrograph displays the MNPs with narrow size distribution, excellent crystallinity, and an average particle diameter of about 10.1 nm. Hence, the HR-TEM average particle size is in good agreement with PXRD crystallite size. The majority of the synthesized MNPs are spherical in appearance, with minor variations in their shape. According to HR-TEM micrographs, the interfringe distance is similar in value to the interplanar distance of (311) lattice planes and is calculated to be 0.252 nm (Figure 2(b)). The estimated interfringe distance and the dataset have good agreement with JCPDS No. 00-066-0533. Average particle size was calculated by quantifying the diameter of each particle visible in HR-TEM images using ImageJ software. The obtained size distribution is shown in Figure 2(c). The selected area-electron diffraction (SA-ED) profile of the specimen provided additional confirmation of their cubic spinel structure, which is depicted in Figure 2(d). Highly crystalline nanoparticles can be seen in the profiles. The lattice plane of the cubic spinel structure (311) was effectively matched with the second bright ring’s (Figure 2(d)) d-spacing (0.254 nm). Similar mappings were made for the remaining bright fringes to the 220, 400, 511, and 440 planes. Composition of the MNPs was determined by an energy dispersive spectroscopy (EDS) study (Figure (a)); the results indicated well-defined peaks for Co, Mg, Fe, and O, respectively. The study confirms that the sample had no impurities. Elemental color mapping images for Co, Mg, Fe, and O are shown in Figure 3(b), each displaying a consistent dispersion of the corresponding elements.
3.3. Infrared Studies
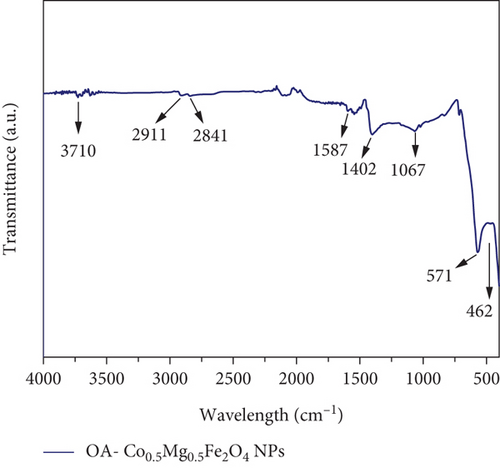
A Fourier-transform (FT) infrared (IR) spectroscopic study was used to examine the functional groups, the nature of bonding, and the ligands on MNPs. Figure 4 represents the IR spectra of the oleic acid and oleylamine-anchored Co0.5Mg0.5Fe2O4 MNPs. Vibration of the octahedral metal-oxygen (M-O)oct and tetrahedral metal-oxygen (M-O)tet bonds of the prepared sample have the peaks at 462 and 571 cm-1. The existence of both peaks indicates the formation of M-O bonds in the as-synthesized MNPs’ tetra and octahedral sublattices. The shoulder peak observed with the band at 1067 cm-1 can be attributed to the stretching mode of nitrile (C–N) groups, and the peak at 1402 cm-1 corresponds to the symmetric stretching vibrational mode of alkanes and -CH2- groups [10, 38]. The energy absorption by the C-H bending vibration of functional groups is represented by the peak at 1587 cm-1. Cubic spinel ferrite (Co0.5-mixed Mg0.5Fe2O4) MNPs were synthesized utilizing high boiling point 1-octadecene in the presence of OA and oleylamine. As a result, the transmittance bands associated with the functional groups OA, oleylamine, and 1-octadecene are observable. OA is a monounsaturated fatty acid, and oleylamine is an amine (-NH2) group that belongs to an unsaturated fatty amine. The carboxylic functional group of OA is ligated on the surface of as-synthesized nanoparticles in the present scenario. The amine group of oleylamine anchors poorly on the surface of the NPs. The band at 1587 cm-1 corresponds to the -CH- bending vibration of residual oleic acid and C=O and C=C stretching vibrations of acetylacetonate [42–44]. In addition, because of the precursor utilized in the synthesis, the bands arising at 1587 cm-1 are attributed to the asymmetric vibrations of the group Cl- [45]. Due to the decomposition during the reflux process, 1-octadecene the group was not found in the IR spectra of as-synthesized MNPs. The peaks at 2841 and 2911 cm-1 represent the methylene group (-CH2) symmetric and asymmetric stretching bonds, respectively. The weak peak around 3710 cm-1 is attributed to the =C-H group’s C-H stretching and is displayed in the sample [38].
3.4. Thermal Analysis
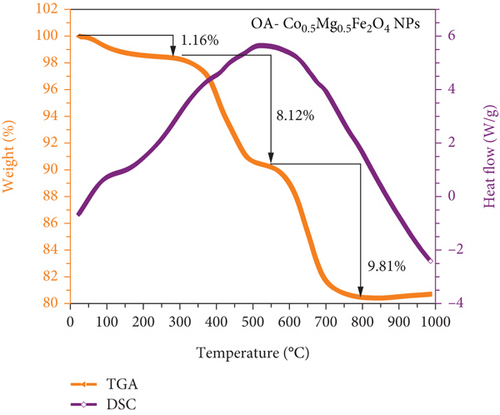
Thermogravimetry (TG) and differential scanning calorimetry (DSC) of as-prepared CO0.5 doped Mg0.5Fe2O4 nanoparticles are shown in Figure 5. The data were presented as sample weight (%) as a function of sample temperature for TGA and heat flow as a function of sample temperature for DSC. TGA was performed at room temperature (RT) in N2 environment to assess the total residual surfactant in the as-synthesized NPs. The following temperature regions had significant weight losses: (i) ≈1.16% weight loss in the first region (below 200°C), (ii) ≈8.12% weight loss occurred in the second region (250 to 540°C), and (iii) ≈9.81% weight loss occurred in the third region (540-1000°C). The total weight of the prepared sample exhibits a loss of 19.1% from RT to 1000°C. Similar weight loss happened when using the same OA and oleylamine surfactants as reported in previous literature [46]. Weight loss (1.16%) in the first region (25-200°C) is caused by the elimination of adsorbed water and dehydration of OH groups. Organic solvent decomposition, such as OA and oleylamine residues, resulted in significant second weight loss (8.12%) from 250 to 540°C. The third major weight loss (9.81%) noticed at temperatures above 540°C may attributed to CO group decomposition [47]. The first region of the DSC curve has an endothermic peak, while the second and third regions have exothermic peaks. This implies that weight loss in the initial area occurs from the evaporation of solvent molecules adsorbed on the NPs as a result of absorbing heat from the oven, whereas weight loss in the other regions results from the decomposition of surfactant OA and oleylamine accompanied with the release of heat. These observations are in good agreement and similar to previously reported articles [46, 47].
3.5. Magnetic Properties

| Sample | M s (emu/g) | Mr (emu/g) | Hc (Oe) | Mr/Ms (Oe) | μ (μB/f.u) | k (103) emu.Oe.g-1 |
|---|---|---|---|---|---|---|
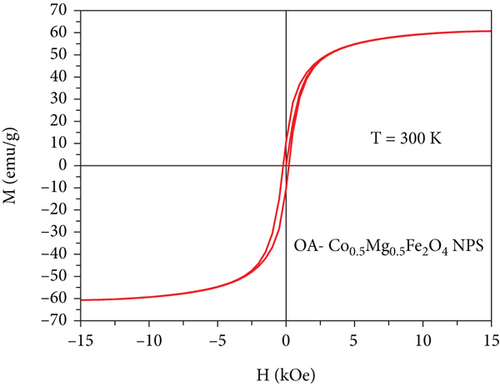
| OA-Co0.5Mg0.5Fe2O4 | 61 | 10.5 | 205.32 | 0.172 | 2.37 | 13.81 |
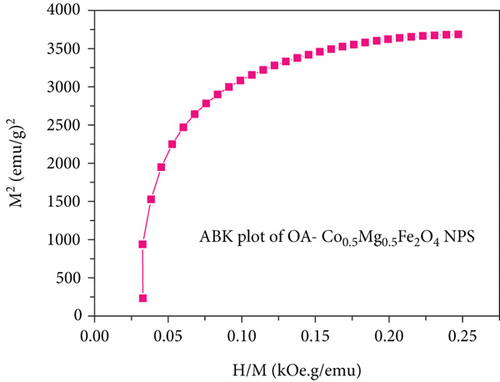
According to Neel’s model in spinel ferrites, the magnetization of the tetrahedral sublattice is antiparallel to the octahedral sublattice. The Co2+ ion-doped Mg2+ Fe2O4 NPs are expected to have higher magnetic moment and anisotropy because of the occupancy of Mg2+ ions in the octahedral positions. Hence, iron and cobalt/magnesium ions are exchanged between octahedral and tetrahedral sites, and the addition of Mg ions alters the arrangement of cation distribution. The cations ratio at octahedral and tetrahedral sites is altered by this nonequilibrium distribution, which is anticipated to reduce tetrahedral-octahedral interaction and enhance octahedral-octahedral interaction. The substitution of cations within the structure reduces the spin-orbit coupling, which is caused by the unquenched orbital angular moment of the Co2+ ions. Since Mg2+ ions have no unpaired electrons (zero electron spin), the magnetic anisotropy in Mg ferrite is anticipated to be lower than that of cobalt ferrite, and the magneto crystalline anisotropy is anticipated to decrease with an increase in Mg-concentration. Mg-O-Fe (nonmagnetic ions) appears to have weaker superexchange interactions than magnetic cations Co-O-Fe and Fe-O-Fe, which also reduces the magnetocrystalline anisotropy [41, 52]. The Stoner-Wohlfarth (Mr/Ms), magnetic moment (μB), and anisotropic constant (k) values are in good agreement with previously reported articles [45, 50]. In addition, the saturation magnetization (Ms) was also derived by the law of approach to saturation (LAS) of magnetization as presented in Figure 6(b), by plotting the inverse magnetic field (1/H) and as a function of related magnetization (M). In order to confirm the magnetic nature of as-synthesized NPs, the Arrott-Belov-Kouvel (ABK) plot (M2 vs. HM−1) was plotted and depicted in Figure 6(c).
3.6. Photocatalytic Performance
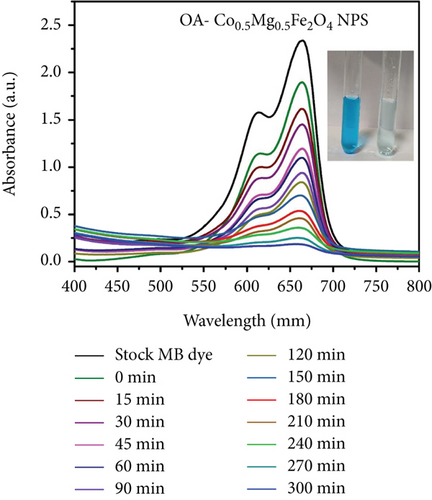
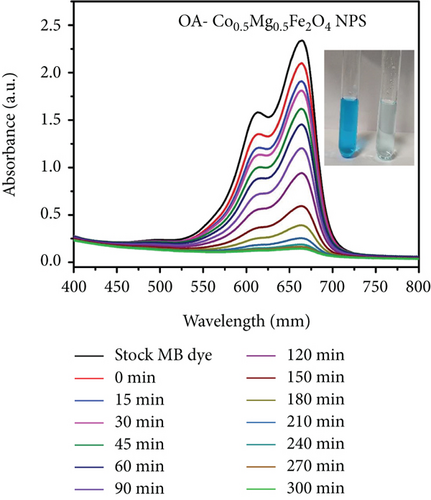
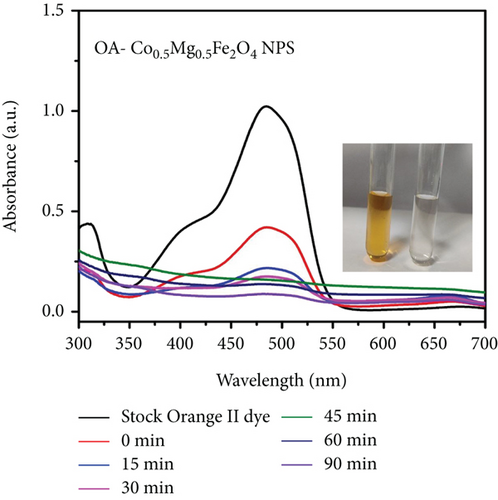
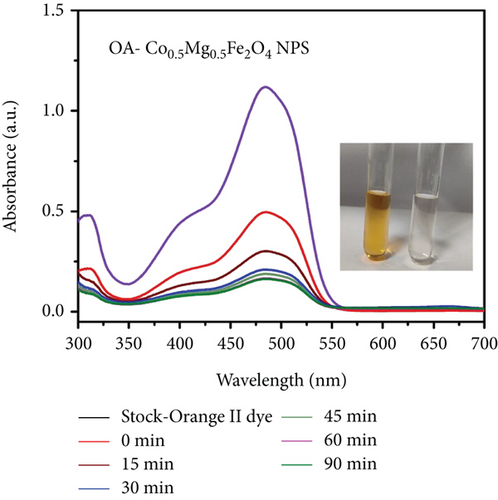
Organic pollutants such as MB and Orange II degrade mostly on the surface of nanoparticles as a result of a series of redox processes induced by electromagnetic radiation [50, 53]. Dye molecules are additionally captured on the surface of photosynthetic catalyst [50]. The photocatalytic activity of as-synthesized OA-ligated Co0.5-mixed Mg0.5Fe2O4 NPs was analyzed by calculating the degradation kinetics of aqueous cationic MB and anionic Orange II solutions under UV and visible light irradiation. MB and Orange II dyes were selected as organic dyes due to their absorption spectra in the UV and visible regions of the solar spectrum. The decoloring investigations were conducted both with and without light irradiation. The photochemical reactions were carried out for well-defined time periods. By evaluating the sample’s ultraviolet-visible absorption spectra, the rates of methylene blue and Orange II dye discoloration/degradation in the presence of the photocatalyst were calculated. A UV-Vis spectrophotometer is used for measuring the rate at which dyes degrade over time. Ultraviolet-visible spectra of cationic methylene blue dye in the vicinity of as-synthesized nanoparticles are depicted in Figures (a) and 7(b) at different time periods (0-300 min.). Similarly, the ultraviolet-visible spectra of Orange II (anionic) dye in the presence of as-synthesized nanocrystals are depicted in Figures (a) and 8(b) at various time intervals (0-90 min.). The measurement of the MB sample’s UV-Vis spectra (400-800 nm) exhibits decreased absorption intensity with increase of irradiation time duration. The two apparent absorption peaks, at 609 nm and 665 nm, matched to MB [54, 55]. The peak intensity at 665 nm is proportional to the concentration of MB in the dispersion and was used to estimate MB concentration. With increasing irradiation time interval, the absorbance of 665 nm peaks gradually reduces without the appearance of any new peak. It implies that MB is absolutely degraded rather than transformed into another molecule. The MB concentration decreases by 91.9% and 93.8% under UV and visible light irradiation for 300 min., respectively.
| Photocatalyst | Synthesis method | Light source | Dye | Time (min.) | % DE | Reference |
|---|---|---|---|---|---|---|
| Ni11%Co89%Fe2O4 | Coprecipitation | Solar |
|
90 |
|
[60] |
|
Sol-gel auto combustion | Visible | MB | 120 |
|
[49] |
| γ-Fe2O3/Fe3O4/SiO2 | Single-stage heat treatment | UV | MB | 120 | 87.5 | [1] |
| Zn0.25Cu0.75Fe2O4 | Hydrothermal | Visible | MB | 300 | 83.8 | [45] |
| NiFe2O4 | Laser ablation | Visible | MB | 2880 | 62.8 | [50] |
| Fe3O4/ZnO | Microwave irradiation | UV | MB | 60 | 63.0 | [61] |
| Co0.9Mg0.1Fe2O4 | Sol-gel combustion | Sunlight | MB | 240 | 74.5 | [28] |
| OA-coated Co0.5-mixed Mg0.5Fe2O4 NPs | Thermal decomposition |
|
MB | 300 |
|
Present study |
3.7. Mechanism of Photo Degradation
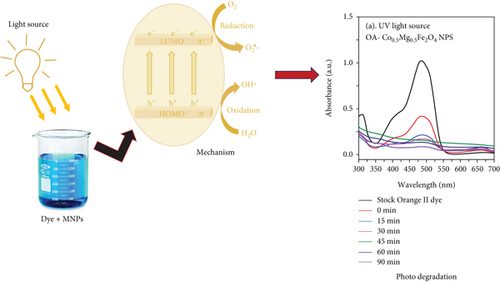
Additionally, the anionic superoxide radical (O2-) is produced by the conduction band electron’s interaction with adsorbed oxygen molecules (eq. (7)). The O2- does not participate actively in the subsequent oxidation process; instead, it combines with H+ to produce (eq. (8)) and absorbs electrons to produce OH ∗ (free radicals) (eq. (9)). For better understanding, Figure 10 shows a graphical representation of the photodegradation mechanism. In earlier published works, similar photocatalytic mechanism has been demonstrated for the interaction of MB and Orange II dyes with catalysts [52, 59].
4. Conclusion
Improved thermal decomposition protocols were adopted to produce mixed cobalt magnesium ferrite (OA-Co0.5Mg0.5Fe2O4) nanocrystals with a homogenous size distribution. XRD study of the as-produced nanoparticles validated their narrow size distribution and single-phase cubic spinel structure. The average particle size of the sample was determined by HR-TEM analysis to be 10.1 nm, which was almost the same as the crystallite size discovered by XRD analysis. The cubic crystalline nature and elemental composition were validated and matched by the SEAD profile and EDS, respectively. The chemical environment and functional groups of the crystal ligands were examined using infrared spectroscopy. Thermogravimetric analysis was used to examine thermal stability and residual matter decomposition. The nanoparticles exhibited soft ferromagnetic properties with increased saturation magnetization (Ms = 61 emu/g) at room temperature. Photocatalytic properties of the synthesized MNPs were assessed through cationic methylene blue and anionic Orange II dye degradation analysis. The prepared compound showed a high degradation rate of 97.2% of anionic Orange II dye within 90 minutes of the irradiation of UV light on the photoreactor vessel. Overall, during irradiation with visible and UV light, the spinel ferrites demonstrated efficient photodegradation of both anionic and cationic dyes. The current study demonstrates that OA-Co0.5Mg0.5Fe2O4 MNPs can be potentially used as photoactive catalysts to eliminate industrial organic pollutants and for wastewater treatment.
Conflicts of Interest
The authors declare that they have no conflicts of interest.
Authors’ Contributions
S.Vadivel was responsible for the methodology, experimental, investigation, graphical work, and revision. N. Maaouni was responsible for the methodology, investigation, experimental, and graphical work. Mohammad Rezaul Karim and Ibrahim A. Alnaser were responsible for the conceptualization, formal analysis, and editing. Theophile Niyitanga and Haekyoung Kim were responsible for the investigation, formal analysis, editing, writing review, and supervision. S. Roy was responsible for the writing—original draft, formal analysis, editing, and supervision.
Acknowledgments
This study was supported by the Regional Industrial Technology Development Program (P0017744), funded by the Ministry of Trade, Industry, and Energy (MI) of Korea by the National Research Foundation of Korea (NRF) grant funded by the Korea government (MSIT) (No. 2019R1A5A8080290). The authors extend their appreciation to the Researchers Supporting Project number (RSPD2024R956), King Saud University, Riyadh, Saudi Arabia. The authors also acknowledge financial support from the DST INSPIRE Faculty Fellowship (DST/INSPIRE/04/2015/002287) and the UGC-DAE CSR project (CRS/2022-23/02/806).
Open Research
Data Availability
Data will be made available on request.


