Analysis of Aeromagnetic Data for Enhancing Geologic Features Using Filtering Techniques Over the Congo Craton–Pan-African Belt Contact, Centre-East Cameroon
Abstract
The Pan-African mobile zone, situated at the margin of the Congo Craton in Cameroon, is characterized by a geological setting with polyphased tectonics, which can be summarised as the alternation of compression and extension events. The present study, conducted in a portion of the aforementioned zone, is aimed at investigating crustal structures using aeromagnetic data. To achieve this, a variety of advanced analysis and interpretation techniques were applied to reduce aeromagnetic data at the equator, including total horizontal derivative (THD), Centre for Exploration Targeting (CET), 3D Euler deconvolution (ED), spectral analysis, and 2D3/4 modeling. The results indicate that the study area can be divided into four magnetic units based on the magnetic properties (magnetic susceptibility, geometry, and depth) of the underlying rocks. The THD method reveals the presence of pseudocircular and linear structures, which are associated with mafic intrusions and faults, respectively. The structural trends of the lineament generated semiautomatically using the CET method suggest that the structures are oriented in order of priority: E-W, WNW-ESE, ENE-WSW, and NE-SW. These directions are probably related to the Pan-African orogeny. According to the ED, the depths of these lineaments extend beyond 1250 m. A spectral analysis conducted on a profile intersecting some of the significant anomalies on the reduction to the equator (RTE) map indicates that the average depths of superficial and deep magnetic sources along this profile are approximately 0.5 and 6.5 km, respectively. The geological model obtained along this profile by direct 2D3/4 modeling indicates the presence of an ancient granitic basement, which is overlain by younger formations belonging to the Pan-African.
1. Introduction
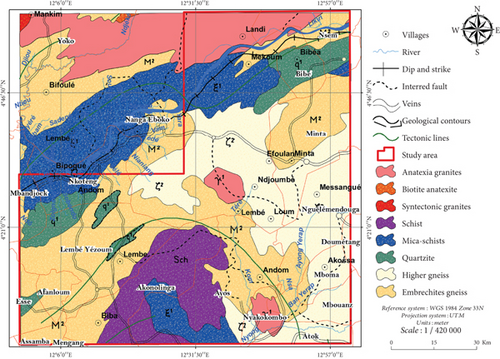
The present study covers significant portions of the Haute Sanaga (chief town Nanga Eboko), Nyong, and Mfoumou (chief town Akonolinga) divisions in the Central Cameroon region and the Haut-Nyong Division (head town Abong-Mbang) in the East Cameroon region. The area is bounded by longitudes 12°00 ′ and 13°00 ′ east and latitudes 4°00 ′ and 5°00 ′ north (Figure 1). It straddles the northern margin of the Congo Craton and the southern part of the North Equatorial Pan-African Range. Located in a transitional zone between the Craton and the Pan-African Chain, this area has a complex structure due to the various stresses the basement has undergone during different geological episodes. As a result, numerous geological and geophysical investigations have been carried out in this area [3–9]. Indeed, in a recent study, Diallo et al. [8] proposed a geological map showing the spatial distribution of various targets of potential rutile mineralization. This study was based on geological field and magnetic data from Minta, a region located to the north of the study area. Furthermore, Mono et al. [4, 7] employed the first vertical derivative, Euler deconvolution (ED), and an analytical signal to map lineaments in the study area using magnetic data. In the same region, Mono et al. [3] estimated from aeromagnetic data that the average depth of the Curie point is 9.09 km, corresponding to a geothermal gradient and heat flux of respective average values of 72.24°C/km and 180.59 mW.m−2. Geophysical investigations based on gravity data were conducted at the southern limit of the investigation zone by [9, 10]. These studies employed spectral analysis and 2D3/4 modeling to identify subsurface structures.

Despite the results of the various studies carried out at the margin of the Congo Craton in Cameroon, our knowledge of its basement and its emplacement is still poor. Further studies are needed to fill in the gaps and refine our understanding of this geologically complex region. This study is aimed at analyzing in detail the magnetic data covering the study area in order to improve our understanding of its geological setting, particularly from a structural point of view. Our investigation will focus on accurately mapping the magnetic lineaments and determining their trends, extensions, and depths in order to better understand the geology of the region. The identification of these lineaments will provide valuable information on the fracturing and degree of deformation of the basement. These data are essential for assessing the stability and cohesion of the basement in this region and are also important for natural resource exploration.
The magnetic method is a remarkably powerful tool for mapping geologic structures, including regional geologic boundaries [6, 11–13]. This technique can be used to identify complex geological structures, including faults and fracture zones, that are not visible on the surface but play a key role in the distribution of mineralization [11, 12]. The magnetic method is based on the magnetic susceptibility of iron minerals present in rocks. Iron ores, such as magnetite and hematite, have higher magnetic properties than most other rocks [14, 15]. By measuring and mapping these magnetic variations, it is possible to identify iron-rich zones and delineate associated geological structures. Aeromagnetic data play a pivotal role in this process. They provide a comprehensive representation of the subsurface, enabling the visualization of magnetic anomalies and the deduction of information on geology and mineralization [16]. However, observing aeromagnetic anomalies is insufficient for the deciphering of geological subtleties. They provide a detailed picture of the subsoil, allowing the visualization of magnetic anomalies and the deduction of information on geology and mineralization. Observation of aeromagnetic anomalies alone is insufficient for the decipherment of geological subtleties. In order to obtain accurate and reliable results, various mathematical filters are applied to aeromagnetic data in order to highlight geological structures. For example, the calculation of the horizontal gradient (HG) method is often used to locate geological contacts and bodies in the ground [17–19]. The application of tools such as spectral analysis [20], ED [21], and 2D3/4 modeling facilitates the estimation of the depth of magnetic sources, thereby providing valuable information on the geometry of potential mineralization zones. Anomaly grid analysis by the Centre for Exploration Targeting (CET) is useful for the automatic detection of linear structures [16, 22]. The CET has recently been at the forefront of research into fresh and inventive methods for defining geologic structures using airborne potential field data [19]. In this study, we begin by presenting a synthesis of current knowledge of the regional and local geology of the study area. We then proceed to interpret the magnetic anomalies covering the study area using the mathematical processing techniques described above.
2. Geologic and Tectonic Setting of Study Area
The study area’s geological formations belong to the Precambrian basement [1], which is widespread in Africa and occupies more than three-quarters of Cameroon. The investigation area is located at the boundary between the granitic formations that make up most of Adamaoua and the Yaoundé Group (Figure 1(a)) [23]. The younger, less metamorphosed Ayos series only outcrops beyond the southern limit of the study area. Previous studies [1, 23] have shown that granites and metamorphic rocks dominate the geology of the region, with granitic formations occupying the northern part of the study area and ancient syntectonic granite covering the entire eastern part. The biotite calc–alkaline granite is the main type of granite in the area, and it is heterogeneous in terms of structure, texture, and mineralogical composition. Amphibole is common throughout the study area. The Yaoundé series, which forms the bedrock of the central and western parts of the study area, consists mainly of gneisses and garnet migmatites. These rocks were derived from ancient granitized and metamorphosed sediments affected by the Pan-African orogeny (600 and 500 Ma). The Yaoundé series comprises two major migmatitic units [24]: a metasedimentary unit or paragneiss and a metaplutonic unit or orthogneiss.
The Ayos series is a part of the Cameroonian series, previously known as the series, estimated to be between 1.8 and 1.2 Ga in age [25, 26]. They are primarily composed of chloritoschists, micaschists, and quartzites. The geodynamic setting is considered to be that of an intracontinental basin. The study area is regionally a part of the North Equatorial Pan-African Chain [23, 27]. The chain is believed to have formed due to the convergence and collision of the Congo Craton and the mobile belt [23, 28, 29]. The area has numerous shear zones, including the Central Cameroon Shear (CCS) Zone (CCSZ) and the Sanaga Fault (SF) [1]. Previous studies have identified three phases of deformation in this region [23, 29–33]. The D1 tectonic event is associated with high-grade amphibolite facies metamorphism, which develops S1 schistosity. The D2 phase is associated with medium-grade amphibolite facies metamorphism [23, 31]. The essentially brittle D3 phase is characterized by the emplacement of diaclases and veins. However, this phase is linked to the development of major regional structures such as the CCS and the SF.
3. Materials and Method
3.1. Data Acquisition and Processing
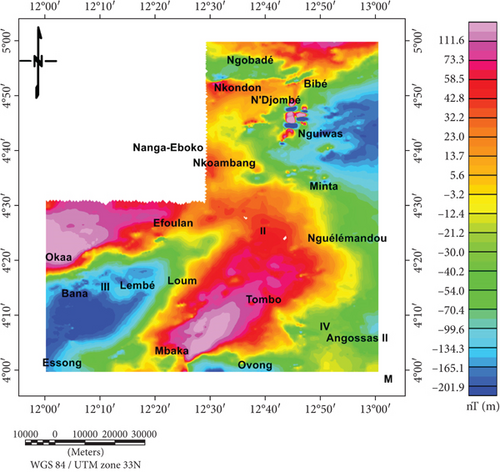
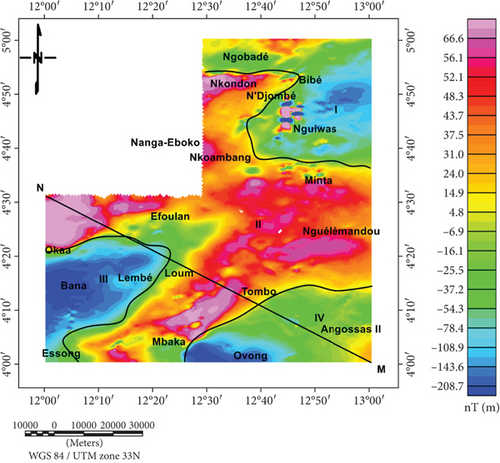
The magnetic data utilized in this study were obtained from a measurement campaign conducted in 1970 by the Canadian company SURVAIR on behalf of the Canadian International Development Agency (CIDA) as part of a cooperation agreement between the Government of Canada and the Federal Republic of Cameroon. Aeromagnetic coverage was conducted at an altitude of 235 m along N135° profiles. After subtracting the International Geomagnetic Reference Field (IGRF), we obtained a map of the total anomalies in the magnetic field of the study area (Figure 2). The equatorial reduction of the data was calculated, and the resulting map is shown in Figure 3.
3.2. Methods
3.2.1. Total Magnetic Intensity (TMI) Reduction to the Equator (RTE)
If (/Ia/ < /I/), Ia = I.where I is the geomagnetic inclination, Ia is the inclination for amplitude correction (never less than I), D is the geomagnetic declination, L(θ) is the reduction to the equator, and θ is the wave number direction.
For this study, we used the RTE operation, which was carried out with the Geosoft package V.8.3 software. The inclination was I = −15.92°, and the declination was D = −5.73°, according to the IGRF in January 1970.
3.2.2. The CET Grid Techniques
The CET algorithm, developed by [22] at the University of Western Australia, analyzes the texture of an image to detect areas of structural complexity. This method identifies magnetic discontinuities, regions of discontinuity, and analyses of structural associations to locate crossings, junctions, and changes in structural direction. In this study, we applied this four-step algorithm (congruence robustness, amplitude thresholding, skeletonization, and vectorization) to the reduced anomaly grid at the equator (Figure 3) to map lineaments.
3.2.3. HG
This function gives maxima above geological contacts, assuming that the springs are thick, the contacts are vertical and isolated, and the magnetizations of the regional field and springs are vertical [36].
3.2.4. 3D ED
The structural index N is a function of the degree of derivation (source and/or field) and characterizes the degree of decay of the effect as a function of distance from the source. In the case of magnetic data, Thompson [21] showed that N takes on values ranging from zero to three depending on the structures considered: (0) for a contact, (1) for a dyke, (2) for a cylinder, and (3) for a sphere. Reid et al. [37] concluded that low structural indices ranging from zero to one provide the best depth estimates.
Euler’s homogeneity equation shows that if an undetermined regional level is present, the structural index cannot be estimated directly. It must be derived from knowledge of the geological and structural context or chosen after a series of trials, depending on the quality of the result (well-grouped solutions and low estimation errors). Extended Euler methods [38, 39], which use a larger number of equations, enable direct estimation of all parameters, in particular depth and structural index.
3.2.5. Spectral Analysis
3.2.6. 2D3/4 Modeling
As part of this study, various structures were modeled using GMSYS software, an extension of the Geosoft Oasis Montaj 8.4 package. The modeling process involves designing and calculating a theoretical model through successive iterations to closely match the experimental model. To constrain the model, we considered the local geology and assumed that the observed anomalies originated from various sources. We selected the final model with an RMS error of less than 7% [41].
4. Results and Discussions
4.1. The TMI Anomaly
Magnetic maps represent the effects of ferromagnetic ore distribution in rock, which may or may not coincide with known geological units. Due to the geological complexity and structural diversity of the study area, this map shows a highly variable distribution of anomalies (Figure 2). Initial observations suggest that the magnetic anomalies are generally asymmetric. The map of the total magnetic field anomaly in the area highlights anomalies characterized by a pair of strong and weak intensity values (Figure 2). Analysis of this map reveals four zones where the magnetic facies are well differentiated with clearly visible boundaries. There are two zones of strong magnetic response, one in the eastern part of the study area. There are two weak magnetic zones in the area: one in the south, specifically in the Bana area, and the other in the northeast, specifically in the Nguiwas area.
Magnetic anomalies observed on a total magnetic field map are often difficult to interpret, not least because of their different shape and highly variable amplitude relative to that of the source. To correlate these magnetic responses with geological structures, the RTE filter has been applied to the data. This produces anomalies whose maximum is centred on the magnetic sources.
4.2. The TMI Anomaly Reduce to the Equator (TMI-RTE) Map
The RTE filter was applied to the TMI (Figure 2) to obtain anomalies whose maxima are vertical to the causative sources and to eliminate the influence of magnetic latitude on the residual anomalies, as shown on the TMI-RTE map (Figure 3). This map shows that the positive anomalies have shifted slightly vertically northwards, while the secondary anomalies have retained their shape. The northward shift of the positive anomalies suggests that the main anomalies are probably associated with induced bodies. The total magnetic field anomaly map of the study area highlights anomalies characterized by a pair of strong and weak intensity values (Figure 2). In fact, analysis of this map reveals four zones where the magnetic facies are well differentiated with clearly visible boundaries. There are two zones of strong magnetic response, one in the eastern part of the study area. There are also two weak magnetic zones, the first in the Bana area to the south and the second to the northeast in the Nguiwas area.
The TMI-RTE map shows magnetic anomalies ranging from −201.41 to 87.22 nT. It is dominated by a large positive anomaly bounded to the northeast, south, and southwest by three large negative anomalies. These observations lead us to subdivide the study area into four magnetic units, depending mainly on the magnetic properties (susceptibility, geometry, and depth) of the underlying rocks. These domains are separated by magnetic gradients or discontinuities, reflecting the presence of multiple contacts and faults located at different depths in the subsurface. These contacts and multiple faults form zones of weakness that are attractive for mineralization. Their directions are, respectively, E-W, ENE-WSW, NE-SW to E-W, and NW-SE. The development of these corridors is evidence of tectonic events in the region.
4.2.1. Unit I
Located in the northeast of the study area (Figure 3), this unit is generally characterized by a weak magnetic response with amplitudes varying between −140 and +10 nT. It is overlain by the Precambrian crystalline basement (migmatites, embrites, and quartzite in the embrites). However, the zone between N’djombé and Nguiwas is characterized by subcircular anomalies with amplitudes exceeding +111.6 nT. The shape of these anomalies suggests that cylindrical intrusive bodies are strongly magnetized in the basement. Unit I corresponds to rocks with very low magnetic mineral content.
4.2.2. Unit II
This unit is largely underlain by two-mica gneisses and is characterized by a broad NE-SW to E-W trending positive anomaly with mean amplitudes ranging from +4.8 to +87.2 nT. In the western part of this unit, above the town of Oka’a, there are strong E-W anomalies with amplitudes ranging from +87 to +110 nT. These are hosted by mineralized quartzites. The northern part of this unit, more specifically the Nkondon locality, is characterized by a significant E-W anomaly.
4.2.3. Unit III
This unit is characterized by a broad negative anomaly with very low amplitudes ranging from −190.5 to −115.73 nT in an NE-SW direction. Unit III appears to be the response of geological formations associated with weak magnetization structures buried in the basement. According to Mono et al. [7], the source of this anomaly is deep-seated.
4.2.4. Unit IV
This unit covers the south and southeast of the study area, and it is underlain by gneisses with two micas. It shows relatively weak (negative) to moderate (positive) magnetic anomalies. Magnetic intensity amplitudes in this zone range from −61.97 to +8.4 nT.
4.3. HG Map
Because the study area is at low latitudes, we applied the HG operator to the TMI-RTE map rather than to the TMI map itself, so that the presence of a HG corresponds to the presence of a magnetic susceptibility contrast. The TMI-RTE HG map (Figure 4) highlights gradient zones with peak magnitudes of 0.15 nT/m. This map shows the complexity of the structuring of the study area as shown in Figure 4, highlighting the various faults and/or contact lines associated with deep and shallow structures. On this map, large circular and elliptical anomalies are observed to the north and southwest of the study area. These features are characterized by high gradients, which may be attributed to the intrusion of mafic or ultramafic rocks into the basement.
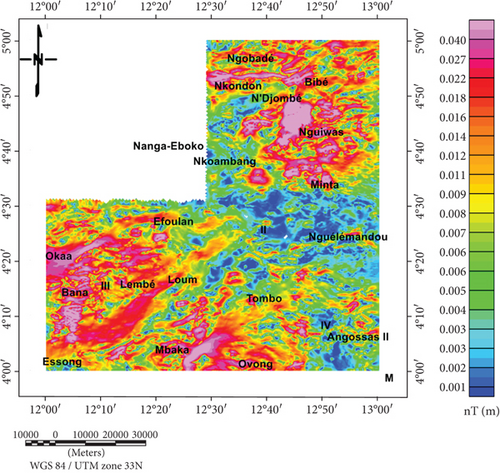
North of Nkondon, a large linear positive anomaly extends for several tens of kilometers and may be related to a fault hidden under the cover. In the Nguélémendouka zone, the central part of our study area, the presence of numerous very low gradient anomalies is illustrated. These blue anomalies are generally elongated in the E-W, NE-SW, and NW-SE directions. To the southwest, the anomalies trend NE-SW and ENE-WEW, respectively. Considering all these anomalies, it can be concluded that the subsurface of the study area has undergone intense tectonic activity. The presence of intrusions, faults, and fractures, represented here by high-intensity anomalies (magenta colors) of pseudocircular and elongated shapes, respectively, confirms the presence of this intense activity.
4.4. CET Grid Analysis for Lineament Mapping
In this study, CET was applied to the grid of reduced magnetic field anomaly data at the equator (TMI-RTE). Analysis of these data has allowed us to deduce the most pronounced structural trends, both at the surface and at depth. In addition, these data are used to detect the responses of discontinuities associated with structures such as faults, dykes, or lithological contacts. The results of the CET grid analysis are shown in Figure 5(a). The results of these techniques highlight 314 lineaments with lengths ranging from 0.707 to 12.075 km, giving a cumulative length of 742.572 km. The rose diagram generated by plotting the extracted lineament characteristics allows us to distinguish the different directional fracture families (Figure 5(b)). It highlights two (02) major directions: E-W and WNW-ESE. In addition to these directions, there are those considered secondary, namely, ENE-WSW and NE-SW.
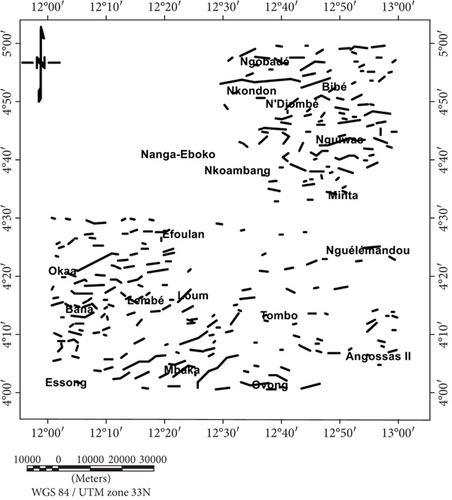
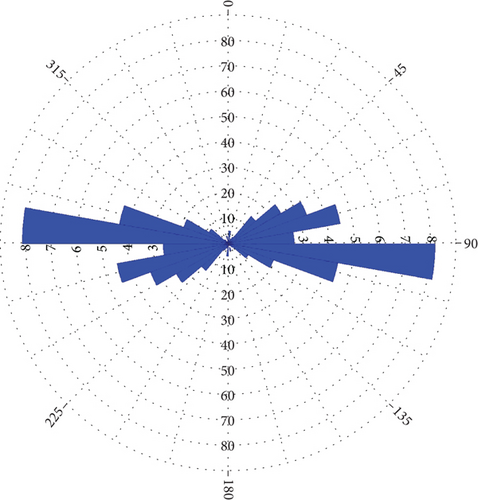
Several studies have been conducted in regions close to the study area, including those by [4, 5, 7, 42, 43], which have highlighted multiple lineaments in the Adamoua plateau, Bertoua–Mbangue, and Akonolinga–Loum regions. In the Adamoua plateau region to the north of the study area, the lineament directions recorded are SW-NE, NNE-SSW, and NE-SW. In Bertoua-Mbangue, an area located to the east of the study area, the preferred directions are NE-SW, NW-SE, ENE-WSW, and WNW-ESE. The study conducted in the Akonolinga–Loum region, located southeast of the study area, identified four main lineament directions: W-E, SW-NE, WSW-ENE, and NW-SE. The main lineament directions identified in the study area (Figure 5(b)) are similar to those found in neighboring areas, indicating that these areas were affected by similar or even identical tectonic activity.
4.5. CET Lineament Density Map
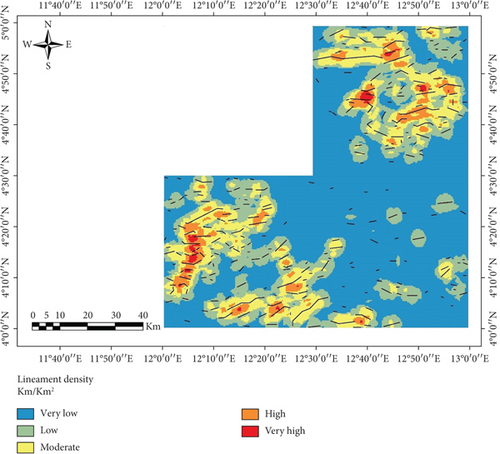
To enhance the visualization of lineament concentration zones, a CET lineament density map of the study area was created. These zones, characterized by high rock fracturing, are crucial for the development of groundwater conduits in the area. The density map provides a clear representation of the areas with relatively high lineament density. The CET method was used to extract lineaments, which were then analysed for density using the “line density” function in ArcGIS software. Density is measured in length per unit area. The analysis of lineament density distribution (Figure 6) shows spatial variability in lineament intensity, which is divided into five classes: very low (0–0.071 km/km2), low (0.071–0.14 km/km2), moderate (0.14–0.21 km/km2), high (0.21–0.28 km/km2), and very high (0.28–0.35 km/km2). Figure 7 displays a region with low and medium lineament density in the central and south-eastern parts of the map. In contrast, zones with high fracture density are present in the north, east, and southeast. These zones indicate tectonic changes that have influenced the geological formations.
4.6. ED Map
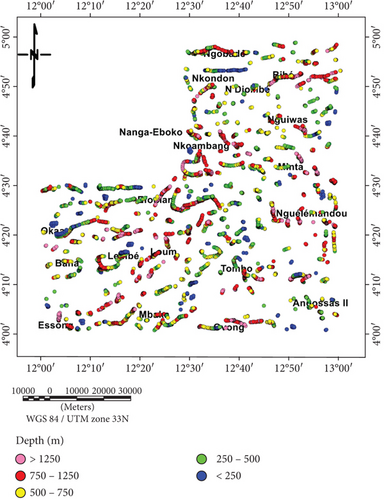
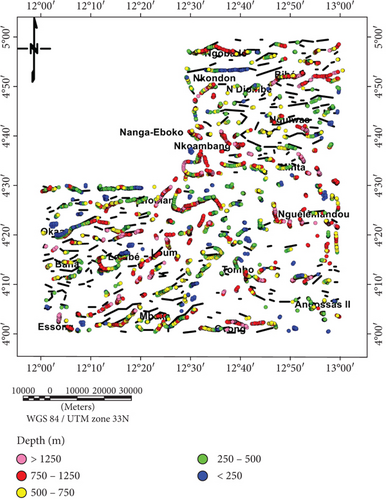
ED is a technique used to locate magnetic contacts in the horizontal plane and determine their depths, with minimal assumptions about the magnetization of causative sources. The Euler inversion was carried out using a calculation program integrated into Oasis Montaj 8.4. Previous studies [21, 37] have demonstrated that low structural indices between zero and one yield the most accurate depth estimates. Furthermore, it has been noted that the choice of window size should be based on the grid pitch and the wavelength of the anomalies being examined [44]. Therefore, in this study, we applied ED to the grid of magnetic field anomaly data reduced to the equator of the study area using a 9 × 9 moving window. To highlight contacts/faults in the horizontal plane and estimate the average depth of their roofs, we assigned the value N = 0 to the structural index. All solutions with a relative standard deviation of 7% or less were retained on the ED map (Figure 7). These solutions are represented by colored circles, with color indicating depth. The solutions (faults and fractures) are clustered on four depth ranges, from shallow to deep subsurface at 0, 0.25 km; 0.25, 0.5 km; 0.5, 0.75 km; and 0.75, 1.25 km and more than 1.25 km intervals, respectively. Euler solutions cluster well along the E-W, ENE-WSW, NE-SW, WNW-ESE, and NW-SE directions. This map illustrates the primary directions of fracturing in the study area and supports the findings obtained through the CET method.
The Euler solutions were superimposed on the lineaments generated by the CET method (Figure 8). In the absence of field data, this procedure can be very useful for cross-validating the results obtained by these two different methods. Upon visual examination, Figure 8 demonstrates a strong correlation between these various findings, confirming their accuracy. In addition, new contacts, especially in the centre of the study area, are revealed on Euler’s solution map.
4.7. Spectral Analysis
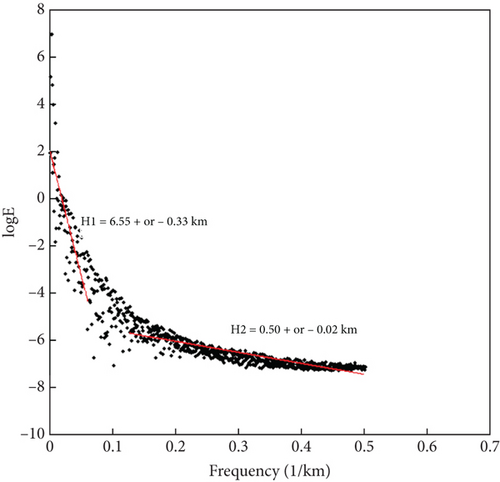
Spectral analysis is based on the properties of the energy spectrum of magnetic anomalies and enables the estimation of major susceptibility contrasts and, consequently, the average depths of disturbance sources. The average depth of a magnetic anomaly source can be estimated from the energy spectrum of the corresponding signal. The code utilized in this study for the spectral analysis of the MN profile (Figure 3) was developed within the MATLAB environment. The program plots the logarithm of the energy spectrum versus frequency for a set of data taken along the profile. Two line segments can be obtained by linear fitting using the method of least squares on this curve. The slopes of these line segments are proportional to the average depth of the top of the disturbance sources, as demonstrated by Equation (5). The slope of the segment located at the low frequency corresponds to structures located at great depths, while the slope of the second segment, situated towards high frequencies, corresponds to superficial structures. The error associated with calculating the different depths was assumed to be equal to 5% [45]. The estimation of magnetic anomaly source depths is contingent upon the selection of line segments defining the slopes. Figure 9 depicts the energy spectra as a function of frequency, along with the line segments selected to determine the slope for calculating the average depth of disturbance sources along the MN profile. As illustrated in Figure 9, the depth of the shallow source interface is estimated to be 0.50 ± 0.02 km, while the deep source interface is calculated to be 6.55 ± 0.33 km. The depths of the magnetic anomalies obtained serve as one of the constraints on the subsequent modeling.
4.8. 2D3/4 Modeling
This work entails modeling the magnetic field to depict the bedrock of the study area. A magnetic model (Figure 10) was created based on the MN profile outlined on the RTE map (Figure 3). The magnetic profile MN (Figure 3) spans from the localities of Angossas II to Oka’a, with limits of (277921.5 m; 443295.8 m) and (166866.7 m; 500371.1 m), covering a total length of 125,301 m. The profile crosses two-mica gneisses, two-mica embrechites, the Akonolinga series, biotite embrechites, mineral quartzites, and feldspathic micaschists in a SE-NW direction. The MN profile curve passes through several anomalies from south to north, with wavelengths that vary from alternately positive to negative. This results in a highly undulating curve with several peaks. The strongest anomalies, with an intensity of 87.22 nT, are located in the northwest of the profile. The irregular shape of the curve (Figure 8) reflects the complex geology of the area. Upon careful analysis of this profile, it is evident that there is an excellent fit between the observed and calculated anomalies, with an acceptable error of 1.342 (Figure 10).
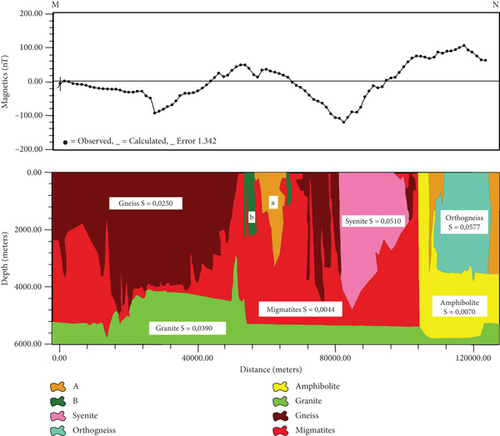
Regarding the formation layout, there is a granitic basement consisting of ancient magmatic rocks that form the old basement complex and were emplaced during the first half of the Precambrian period. The maximum depth of the basement is 6 km, and its susceptibility is S = 0.0390 SI. Based on the lithology of the magnetic model, it is evident that the migmatite formation was emplaced before the gneiss and syenite formations, with susceptibility values of 0.0250 and 0.0510 SI, respectively. Bodies A and B, with susceptibility values of 0.0186 and 0.00012 SI, respectively, penetrate the migmatites. This layer is adjacent to an amphibolite formation. Additionally, rhyolites with a susceptibility of 0.0307 SI are present above the amphibolites. The magnetic susceptibility values of the rocks in this model correlate well with those presented in the table by [46]. The crustal formations in our model are consistent with those obtained by [47] from seismic data from southern Cameroon. This model confirms the granite–gneiss nature of the Pan-African basement.
The geological model obtained along the MN profile by direct 2D3/4 modeling gives an idea of the geological formations or structures that are responsible for the magnetic signatures observed on the surface. The model indicates that the study area is characterized by a complex geological structure, with the presence of an ancient granitic basement that was laid down during the first half of the Precambrian. The aforementioned basement is overlain by a sequence of metamorphic rocks, including migmatites, gneisses, syenites, and intrusions of basic rocks such as amphibolites. However, three principal parameters are required for modeling: magnetic susceptibility contrast, formation depth, and shape. The reliability of the models produced is contingent upon the precision of the constraints imposed on the aforementioned parameters. In the context of our study, it should be noted that, apart from estimating the mean depths of magnetic anomaly sources, the parameters of susceptibility and shape are not constrained. Consequently, the model obtained is more or less realistic. Additional data, such as drilling or seismic data, is therefore necessary to better constrain the model obtained and reduce uncertainties, thus enabling further refinement of the subsurface structure.
5. Conclusion
The magnetic anomalies were analysed and interpreted using various mathematical filters, including qualitative analysis, 3D ED, CET, spectral analysis, and 2D3/4 modeling. The results suggest the presence of multiple structural lines in the area. The study’s main results offer new insights into the geological structure of the study area, specifically the primary lineaments responsible for this structuring. These lineaments align with the general tectonic context of the transition zone between the Pan-African North Equatorial Range and the Congo Craton. The statistical analysis of the lineaments obtained in this study using the CET method revealed five families of magnetic lineaments of regional importance. These lineaments are oriented in the E-W, ENE-WSW, NE-SW, WNW-ESE, and NW-SE directions. These directions correlate well with the geological structures of the transition zone between the Pan-African North Equatorial Range and the Congo Craton. 3D ED and spectral analysis were used to determine the depths of the structures responsible for the magnetic anomalies observed in the study area. The maximum depth of these structures is approximately 1250 m. The Euler solution sets show a strong similarity to the various magnetic lineaments. 2D3/4 modeling confirmed the granite–gneiss nature of the Pan-African basement, revealing subsurface geological structures observed in the magnetic profile. Although the study area was covered by aeromagnetic surveys in the 1970s, the spatial resolution of these magnetic data remains relatively low. More dense surveys would be required to detect smaller geological structures. The lack of geological field data, such as rock outcrops or boreholes, limits the validation of geological interpretations based on magnetic data alone.
Conflicts of Interest
The authors declare no conflicts of interest.
Funding
The authors received no specific funding for this work.
Acknowledgments
The authors are grateful to GETECH Group PLC (Leeds, UK) for providing aeromagnetic data used in this study.
Open Research
Data Availability Statement
The corresponding author guarantees the availability of the data that were used for the conduct of this study.


