Coupling an Autonomous UAV With a ML Framework for Sustainable Environmental Monitoring and Remote Sensing
Abstract
Many countries face problems in monitoring plant problems and monitoring large environments, as until now, there is no accurate means of aerial monitoring through which concerned parties can benefit from watersheds, monitor large agricultural areas, and make wise environmental decisions regarding them. This paper describes a pioneering approach to develop smart agriculture using multimission drones equipped with dual cognitive modules (brains) that are powered by a machine learning (ML) framework. The first brain uses deep reinforcement learning (DRL) principles to enable autonomous flight, allowing drones to navigate complex agricultural terrain with agility and flexibility. The second brain is responsible for precise and crucial agricultural tasks: counting trees, detecting water locations, and observing and analyzing plants using the Faster R-CNN algorithm. The system is linked with the ground station for control and command, as well as it includes an Internet of Things (IoT) infrastructure equipped with sensors that collect soil parameters, which then get sent via 5G Wi-Fi. The dual architecture of the drones, combined with the ground-level IoT system, creates a comprehensive framework that not only enhances agricultural technologies but also aligns with environmental conservation goals, embodying a paradigm shift towards a greener and more sustainable future. Obtained results show reasonable results with an accuracy rate of 98%.
1. Introduction
In recent years, the intersection of advanced technologies and agriculture has given rise to the concept of smart agriculture, revolutionizing traditional agricultural practices. Among emerging technologies, unmanned aerial vehicles (UAVs), commonly known as drones, are becoming effective in promoting precision agriculture by providing real-time data and analytics. For a sustainable environment, we must achieve its most important goals, which include preserving biological diversity that supports the preservation of natural areas and wildlife, reducing damage to them, and preserving the integrity of the physical environment, including preserving natural landscapes and rural and urban quality, promoting the avoidance of physical and visual degradation of the environment [1]. In this regard, many leading countries launched the initiative to support maintaining a green and healthy environment.
The use of drones in agriculture has proven to be a transformative approach, enabling farmers to move beyond traditional methods and adopt a data-driven model [2]. Unsupervised smart drones, equipped with advanced sensors and artificial intelligence (AI) algorithms, autonomously navigate agricultural landscapes, capturing information critical to crop management. In this context, our research explores the potential of unsupervised drones to revolutionize smart agriculture, specifically targeting key aspects such as tree health assessment, tree population estimation, and water resource identification.
One of the primary goals of our study is to examine the uncontrolled nature of these smart drones and the implications for their autonomy and adaptability in dynamic agricultural environments. By “uncontrolled,” we refer to drones equipped with advanced perception systems that allow them to navigate and make decisions without continuous human intervention. This autonomy allows drones to operate efficiently in large-scale agricultural fields, collecting data with a level of flexibility and speed that was not possible before. Smart farming tackles challenges in agriculture by utilizing diverse technologies to enhance efficiency, minimize environmental impact, and automate tasks. Therefore, drones are the perfect solution for contemporary agricultural operations [3].
A few of the specific tasks being scrutinized by drones are counting trees for precise orchard management, identifying water locations to enhance irrigation tactics, and monitoring tree foliage to evaluate the health and stress levels of plants. In addition to simplifying agricultural operations, these capabilities have the potential to support sustainable farming practices and resource conservation.
Using drones in agriculture is going to save time, effort, and money because they are lighter than an adult human, allowing them to be lightweight and manoeuvrable. Through drones, it is also possible to conduct aerial surveys and photographs of all environments and all places that are difficult for humans to reach and make decisions. In addition, drones are used for aerial photography, aerial mapping, excavations and archaeological research, marine wildlife photography, environmental monitoring, and meteorology. Drones can also detect peaks, valleys, natural habitats, and manufactured structures in our world [4].
The potential of drones for detailed surveys in agriculture has been demonstrated for a range of applications such as crop monitoring, field mapping, biomass estimation, weed management, plant census [5, 6], and spraying [7].
A large amount of data and information is collected by drones to improve agricultural practices [8]. Various types of data loggers, cameras, and sensor mounting equipment have been developed for agricultural purposes. Some additional reasons for the increasing use of UAVs and drones in agriculture [9] include gradually declining prices of drones, conducting agricultural operations in areas with low population and activity density, and drones having high occupancy and great scouting capacity. Wireless communication has become indispensable in daily life, providing advantages in mobility, scalability, cost efficiency, and accessibility to remote areas. Unlike wired communication, it eliminates the need for (re)wiring and allows uninterrupted services, making it crucial for applications like meteorology and environmental monitoring systems [10]. As precision agriculture continues to evolve, the insights presented by this research contribute to the ongoing discourse on leveraging evolving technologies for sustainable and efficient agricultural practices. The smart drones discussed here represent a promising avenue for the future of smart agriculture, offering an autonomous and data-driven solution to the evolving challenges faced by the global agricultural community.
1.1. Contribution
- •
Integration of dual cognitive modules: This research is unique in that it makes use of multimission drones that are outfitted with AI-powered dual cognitive modules. The first brain applies deep reinforcement learning (DRL) to autonomous flight; while the second brain handles accurate agricultural tasks and demonstrates a thorough and creative solution to monitoring problems.
- •
Improved accuracy using a Faster R-CNN algorithm: One important distinction is the astounding 98% accuracy rate of the second brain, which is made possible by the Faster R-CNN algorithm. This level of accuracy in monitoring plant health, counting trees, and locating water sources is superior to certain current technology, signifying a major development in the sector.
- •
Holistic approach to sustainable agriculture and tourism: By presenting a holistic approach that concurrently promotes sustainable agriculture and tourism, the research goes beyond conventional agricultural monitoring. In addition to supporting agricultural practices, the emphasis on plant health monitoring, prudent irrigation planning, and tree counting for orchard management also supports environmental preservation and environmentally friendly travel experiences.
- •
Ground-level Internet of Things (IoT) infrastructure: Adding sensors to gather soil parameters and integrating an IoT infrastructure at this level enhances the system’s overall accuracy and complexity. By ensuring a more robust dataset, this integration raises the accuracy of agricultural decisions by boosting the quality and relevance of recorded aerial data.
- •
Application of 5G Wi-Fi transmission: 5G Wi-Fi transmission is a significant technological advancement for ground-level data transmission. By enabling real-time data flow, this option helps farm managers make decisions more quickly and intelligently.
- •
A comprehensive paradigm change toward sustainability: The ground-level IoT system and the drones’ dual design highlight a larger paradigm change toward a more sustainable and environmentally friendly future. The research demonstrates a dedication to a thorough and environmentally responsible approach by advancing agricultural technologies while also aligning with broad environmental conservation goals.
To sum up, this study stands out for its creative use of technology, high level of accuracy attained through sophisticated algorithms, and comprehensive strategy that considers both sustainable tourism and agricultural. It represents a noteworthy advancement in the sector due to its integration of state-of-the-art technology and dedication to environmental stewardship.
2. Related Studies
This section provides, first, a representative sample of relevant research work reviewed, and then, we provide a summary of the review that concludes by highlighting research gaps and our own research motivations. We have used the following criteria to source and review relevant research work that drones link with AI and machine learning (ML) to support tourism, smart farming methods, and water sources, and which provides details: type of drone control, AI mechanisms for detecting objects in the image, divided into tree detection and water detection, aerial photography, that is, RGB or thermal camera, remote sensing mechanisms, vegetation analysis and discrepancy detection, smart agriculture, wireless communication technologies, and the IoT.
Many methods suggest that the drone operates in a limited environment and at a specific time through a control device [11], which requires a human to interact with the drone so it can move and collect data. There are many studies that have used a system that will be able to predraw a path on a map [12, 13], and despite the great benefits of these methods in identifying obstacles, avoiding collisions, and reducing accidents, they make our drone ineffective for its intended use, like detecting objects in unexpected places. In [14], the autonomous drone is built by training a RL network using a digital elevation model (DEM) to create aerial images and a plan to fly over the target terrain. In our proposed model, we will not adopt this method to consider that the drone will not travel in closed areas (like caves) or need terrain details; the goal is only to make the drone fly to take aerial photos of water, trees, and plants. By training the drone using the deep learning algorithms FCNN and GRU, the study [15] considered the prospect of flying the drone with a single camera and avoiding the use of GPS. The study [16] examined the same topic but classified the images taken from a UAV’s front-facing camera using a cutting-edge CNN architecture called DenseNet-161. The drone needs a lot of data to understand its surroundings, and when using just one camera, it may not be able to avoid obstacles as effectively because they change based on the environment. According to [15], the drone must be trained along a specific path; otherwise, the mission would fail. To lessen this, the drone must undergo further training, which makes data collection more challenging.
Research [17] was carried out utilizing Inspire 2 quadcopter drones equipped with RGB cameras, creating 3D models using photogrammetry, and employing geographic information systems to map the environment. It made situation maps of an open field in Maguwo, Yogyakarta, Indonesia, and an outdoor tennis court in Bogor City using AgiSoft Metashape from AgiSoft LLC and ArcMap Ver. 10.3 from Esri Inc. AgiSoft is software that processes digital photos photogrammetrically and creates 3D spatial data for use in GIS applications. This study computed the normalized difference vegetation index (NDVI) of the walkable neighborhood for each parcel as an objective indicator of the area’s overall greenness. The remotely sensed spectral vegetation index, known as the NDVI, was calculated using the equation below using data from sensors mounted on satellites. According to the absorption spectra of the items in each survey pixel and the proportion of that pixel occupied by each type of object, the NDVI estimates the quantity of photosynthetically active light that is absorbed in each survey pixel, or its greenness. The indicator has a range of -1 to 1, with higher positive values indicating more vegetation and greener pixels. The NDVI has been linked to bird reproductive success and morphology, as well as plant and animal variety. It has a predictable linear relationship with net primary production, the energy accumulated by plants during photosynthesis (Coops et al., 2014; Saino et al., 2004). A figure between minus one (−1) and plus one (+1) is always produced when the NDVI for a given pixel is calculated, but no green leaves produce a value that is near zero. A value of zero implies no vegetation, and a value of close to one (0.8 to 0.9) denotes the greatest potential density of green leaves. The most popular method for calculating vegetation cover is the NDVI. It has a value range of −1 to +1. Very low NDVI readings (−0.1 and below) are indicative of arid rock, sand, or built-up environments. The water cover is indicated by zero. Low values (0.1–0.3) indicate low vegetation density, whereas high values (0.6–0.8) indicate high vegetation density (Takeuchi & Yasuoka, 2004). The goal of this research project is to examine the greenness index, or NDVI, of three residential estates that are each indicative of the residential densities (low, medium, and high) in metropolitan Lagos, as well as its cues for the presence or absence of residential greenspaces. High-resolution object–oriented imaging was employed as the data collection method, and multistage random sampling was used to obtain the sampling frame. Georeferencing ARCGIS and ERDAS IMAGINE 2016 software were used for the data analysis [18]. The introduction of UAVs, along with novel sensors, in the last 10 years has transformed ecological and environmental monitoring. Traditional satellite data cannot provide the precise spatial resolution required. Precision agriculture and ecological restoration are two areas in which you can find benefits from UAVs that can be used to examine small regions, often with great spatial resolution [19]. The research uses the DRL algorithm for autonomous flight, which has proven its effectiveness for monitoring wide environments using NDVI and ACO technology. The techniques used have created a more comprehensive solution for environmental monitoring, but they lack some other factors that enhance the accuracy of the data to obtain an accurate and comprehensive monitoring method [20]
Counting can be made accurate and precise by applying a perfect method that will detect the objects needed from the image. DisCountNet and DiscNet were used to detect and count objects in real time, even if the object was moving or was under something hiding. Were the objects represented by a node referring to the desirable objects [21], but in our case, trees are open and visible, which makes them easier to detect. After detection, trees will be detected and known in the AI brain, which will help with smart counting. A certain tree can be counted after training. Multiresolution segmentation for detection is a powerful way to detect trees [22], which is like the CNN algorithm, so the image will have several layers. [23] proposes a supervised machine learning approach for computing tree count and tracking palms in high-resolution photos in this research. The CNN image classifier, which was trained on a set of palm and nonpalm images, is applied to the image using the sliding window approach. A filter uniformly smooths the resulting consistency map. Peaks are obtained by applying nonmaximum suppression to the smoothed consistency map. The algorithm determines the number of trees after being trained using photos of palm trees. In our case, we need something like tree detection and counting, but with very high accuracy and in real time. Based on the faster regions with convolutional neural network algorithm (Faster R-CNN), this research developed an oil palm tree detection and counting approach. Experimentation using oil palm tree photos obtained by a drone demonstrates that the proposed method can recognize and count the number of oil palm trees in a plantation when the trees’ ages range from 2 to 8 years. The suggested method predicts the size of the plantation and fits the requirements of real-time detection. This demonstrates the algorithm’s great performance, strength, and detection accuracy [24].
The drone receives training in feature extraction and classification using both 3D SCDM and WDM. This allows it to identify changes that may have happened since the last reconnaissance mission with respect to the former and determine whether these changes are water related with respect to the latter. A latent change detection map is used by the deep learning CNN that utilizes the 3D SCDM to determine whether there have been any changes [14]. A water detection technique based on the YOLO V3 network architecture has been presented. Based on this, a bypass network made up of several fusion units was created, and it was discovered that YOLO-Fusion’s detection accuracy is 89.55%, which is 2.45% greater than YLOLv3 [25].
Among the popular methods for remote sensing, satellite systems produce good data due to their analytical accuracy [26]. To map the precise irrigation requirements for crop water resource management, this study illustrated the practical application of merging soil moisture data and remote sensing crop factors. In this work, the usefulness of multispectral pictures derived from Sentinel-2A and 2B satellite platforms, PlanetScope, and unmanned aerial vehicles (UAV-MSI) for ETc estimation was compared. It estimated the IWR of field-dressed tomato crops (Lycopersicum esculentum) in southeast Canada by combining this ETc data with in situ soil moisture measurements. The findings show how useful Sentinel-2 pictures are for determining crop canopy cover and IWR at the field size. Satellite technologies are self-sufficient in that they do not require the addition of other technologies to give farmers useful practical indicators. However, we are unable to detect plant pests and diseases and control them using satellite technologies, unlike direct aerial imaging systems using drones and image analysis, which gives better results to reveal the health and condition of the plant [27]. Uncrewed aerial systems (UASs) have emerged as powerful ecological observation platforms capable of filling critical spatial and spectral observation gaps in plant physiological and phenological traits that have been difficult to measure with space-borne sensors [28].
Detection and classification of tree species from remote sensing data were performed using mainly multispectral and hyperspectral images and light detection and ranging (LiDAR) data. A proposal and evaluation were made with the use of CNN-based methods combined with UAV high-spatial-resolution RGB imagery for the detection of types of trees. Three state-of-the-art object detection methods were evaluated: the Faster R-CNN, YOLOv3, and RetinaNet. The results of the study were for three CNN-based methods. RetinaNet delivered the highest precision, and among all other tested methods, Faster-RCNN and YOLOv3 both produced excellent results given the difficulty of the challenge since the dataset contains several comparable trees, despite the relatively smaller IoUs. Since they produce noticeably better results and are a complicated network, the authors built real-time object detection and employed the ssd_v2_inception_coco model to get higher performance in terms of speed [29].
Dataset images are used for training; OpenCV captures real-time images; and CNN performs convolutional operations on images. Real-time object detection delivers an accuracy of 92.7%. The work focuses on proposing an object detection model, finding the location of that object, and classifying it so that it can be taken as input from the web camera and can be used in some of the standard machine learning libraries for object detection. There are two libraries that have been used: TensorFlow and OpenCV [30]. Compared with popular target detection algorithms, this research–improved Faster R-CNN algorithm had the highest accuracy for tree detection in mining areas [31].
In the use of a support vector for machine–based water detection [32], this research applied mNDWI and SVM methods of water extraction to a Landsat TM image of the St. Croix watershed area to separate water and nonwater features. The quantitative results show that the water index and SVM methods have a similar overall accuracy of nearly 98%. mNDWI performed marginally better (0.51%) than the SVM classifiers in terms of overall accuracy.
This research is aimed at improving the detection of water puddles [33]. Based on the results of the two deep learning models selected in this research, which are Faster R-CNN and SSD, Faster R-CNN was able to detect the puddle images with a maximum confidence score of 99% in different conditions. In some cases, SSD failed to detect all the puddles that were present in the image. In [34], this research deals with the detection of water surface objects in natural scenes using faster RCNN. Experiments showed that the mean average accuracy (MAP) of the proposed method was 83.7%, and the detection speed was 13 fps. This makes this algorithm accurate for detecting small objects, and therefore, its accuracy will be much higher when detecting water locations.
The requirement to train the neural network (NN) for every conceivable circumstance (kind of water, weather circumstances, etc.) is a downside of these approaches, and there are not many ready-to-use models available globally (DeepWaterMap 2.0 is one of them) [35, 36]. Additionally, there are times when we just need a simple, unsupervised tool to get the job done without having to deal with the difficulties of model training. In such situations, however, this tool has a number of disadvantages for detecting the locations of water, including that it only supports images taken by satellites, so it is not possible to capture aerial images from the drone and apply them directly to it, in addition to the fact that the processing of the images cannot be done in real time as it requires manual processing on the device after taking pictures from the satellite.
From the above, we summarize the efficiency of the selected algorithms as follows:
CNN was able to detect the puddle images with a maximum confidence score of 99% in different conditions. In some cases, SSD failed to detect all the puddles that are present in the image. The algorithms used are CNN and SSD to detect watersheds [33].
Faster R-CNN classification achieved 82.14% accuracy, 91.38% precision, and 91.36% recall. Meanwhile, the CNN approach achieved 76% accuracy, 74.1% precision, and 72.3% recall. The quicker R-CNN outperformed CNN in all parameter tests, with a difference of 6.14% in accuracy, 17.28% higher precision, and 19.06% in recall value. The Faster R-CNN outperformed CNN in all parameter tests [37]. The use of the DRL algorithm for autonomous flight makes UAVs effective for monitoring wide environments and enables the management of all kinds of unforeseen emergencies [20].
Gao et al. [38] proposed a low-cost long-range wide-area network (LoRa)–based IoT platform for smart farming modular IoT architecture called LoRaFarM that is aimed at improving generic farm management in a highly customizable way. The proposed LoRaFarM platform has been evaluated on a real farm in Italy, where it collected environmental data (air, soil, temperature, and humidity) related to the growth of farm products (e.g., grapes and greenhouse vegetables) over a period of 3 months. A web-based visualization tool for the collected data is also presented to validate the LoRaFarM architecture.
An IoT application (NB-IoT) system is proposed in [39] to collect underground soil parameters in some crops using a UAV network. Around 2000 sensors deployed under and above ground are connected to the UAV using a low-power wireless personal area network (LPWPAN). Simulation results show that due to UAV altitude and path loss, the link quality between the ground sensor and UAV is reduced.
Implementation of a system that collects data periodically using smart sensors located underground and above the ground in the farms and sends it to the gate. After that, the drone containing a piece of LoRa inside it transfers the obtained readings to the cloud for storage, analysis, and monitoring of the condition of crops and farms and then sends the readings to the user-controlled ground station to improve smart farming [40].
Designing a system, drones can fly over large farms, collect data from different sensors deployed on the farm, and transmit it to the cloud, where the Lo-RaWAN is integrated into the drone to capture data from the water inspection sensors to monitor the quality of water supply on the farm and the SODAQ solar–powered LoRa cattle tracker V2, and that is for large-scale livestock monitoring in rural areas [41].
The existing farm monitoring systems use a variety of wireless technologies to connect IoT devices, covering short-range and high installation costs. To solve the issue of LoRa communication between IoT devices in the current setup, more access points are required. A farm monitoring system can transmit short-range data using the same short-range communication technology. Wi-Fi, Zigbee, Bluetooth, and other short-range communication technologies are some of those in use today. However, even soon, these technologies will require more access points to connect. On the other side, long-distance communication can be done via radio-based protocols like LoRa and NB-IoT. Compared to short-range protocols, LoRa protocols have a wider coverage area [42].
Although LoRa has the advantage of covering larger areas, it has several disadvantages that prevent us from using it in a project that requires transferring a large amount of data in real time because LoRa’s latency and boundary jitter are too high to be used in real-time applications. It has a low transmission rate since the duty cycle limits the size of the LoRa WAN network. It also works well for both periodic and short-term exchanges. Its data transport rate is sluggish. A LoRa module’s enhanced transmission range is commonly advertised, yet few people understand how or why it works. It specifically lowers the data transfer rate in the air to allow for extremely long transmission distances. Wireless communication transmission distance decreases as unit transmission rates increase. Because a weaker signal can be transmitted at a higher rate and a stronger password can be transmitted at a lower rate, if our project demands a high data transfer rate, using a LoRa module might be inappropriate. It carries a tiny payload. LoRa’s data transfer payload is quite tiny, with a maximum of one byte: A study of using a LoRa network as a low power transfer method for IoT application is presented in [43, 44].
Mobile networks can enhance the efficiency and effectiveness of drone operations, with 5G networks poised to support diversified applications beyond the visual line-of-sight range [45].
5G-connected drones show an average throughput of 600 Mbit/s in downlink, with peaks above 700 Mbit/s, but lower throughput in uplink compared to 4G [46].
5G cellular networks can effectively support large numbers of drones for commercial and public safety applications, with research findings enhancing security, reliability, and spectral efficiency [47]. 5G for drone networking offers high bandwidth, low latency, high precision, wide airspace, and increased security, enabling more application scenarios and meeting user needs [48].
The integration of drones and AI gives rise to more robust and dynamic network topologies, thanks to their advantages and capabilities. The advantages of drones also include their ability to bridge digital divides and pave the way for IoT and 5G technologies. Several studies have focused on optimizing UAVs for all-wireless connectivity by tuning the input parameters, so that analysis along with GA optimization over 5G mobile networks is possible [49, 50]. Unfavourable weather conditions like fog, rain, and high winds can seriously hinder drone performance in agricultural applications. This is especially true for drones that use optical sensors and cameras for tasks like mapping and crop monitoring, which can lead to erroneous data collection and misinterpretations. Moreover, drone flying can become unstable due to severe winds and turbulence, necessitating the need for extra power to maintain altitude and path. Large agricultural fields become more difficult to manage as a result of the drone’s reduced operational range and flight duration caused by this increased energy cost. Turbulence that obstructs the drone’s course, even in mild winds, can lead to higher power consumption and less effective operation [51, 52]. When deploying drones, power management is crucial, particularly in inclement weather. They increase the power needed for stability and navigation, which exacerbates limitations on flying time and operating range. Strategies for conserving energy are crucial to reducing these effects. To extend battery life, this entails maximizing flying trajectories and reducing pointless maneuvers. Even though the current system does not use hybrid power technology, it is still important to carefully plan missions and monitor sensors to ensure effective power utilization [52, 53]. The suggested drone model leverages AI for energy efficiency and adaptation, utilizing deep RL to dynamically modify flight patterns in response to weather, to lessen these effects. Under low vision conditions, stability is ensured by ground distance and ultrasonic sensors. The Pixhawk module allows for extended flight and coverage in bad weather by offering power management, safety features, and flight modes. Optimal battery utilization is necessary for long-term operation in large agricultural environments, and the proposed model is expanded upon in the next sections of the paper. Table 1 shows a comparison between related works in relation to the proposed work.
| Ref. | Autonomous drone | Objects detection | Faster RCNN | NVDI model | Count objects | Highlighted issues |
|---|---|---|---|---|---|---|
| [11] | × | × | × | × | × | The remote control requires a human to interact with the drone to transmit and collect data. |
| [12] | × | ✓ | × | × | × | Drone path planning is ineffective for detecting objects in unexpected places. |
| [13] | ✓ | ✓ | × | × | × | |
| [14] | ✓ | ✓ | × | × | × | Unable to take real-time aerial photos of water, trees, and plants. Not accurate enough to detect surface objects. |
| ✓ | ✓ | × | × | × | Not using GPS makes the drone vulnerable to loss. | |
| [17] | × | × | × | × | × | Trees and watersheds and their locations cannot be discovered and counted. |
| × | × | × | ✓ | × | Conventional satellite data cannot provide the required spatial resolution even with the use of NDVI. | |
| [20] | ✓ | × | × | ✓ | × | There are no techniques for object detection or counting. |
| [22] | × | ✓ | × | × | ✓ | Using multiaccuracy segmentation for tree detection and counting with 87% accuracy is not enough for a drone to fly autonomously and process data in real time. |
| [24] | × | ✓ | ✓ | × | ✓ | Not an autonomous drone, which means that the drone’s movement is limited, and it is not possible to analyze the image to determine the plant’s problems and needs. |
| [25] | × | ✓ | × | × | × | The accuracy of YOLO water detection is not compatible with the purposes of accurate real-time detection. |
| [26] | × | ✓ | × | × | × | Remote sensing using satellites to detect objects is not accurate in areas crowded with trees and watersheds covered by obstacles. |
| [29] | × | ✓ | × | × | × | Not an autonomous drone; no image processing using NDVI; and no counting techniques used. |
| [30] | × | ✓ | × | × | × | Not an autonomous drone; no image processing using NDVI; and no counting techniques used. |
| [31] | × | ✓ | ✓ | × | ✓ | Not an autonomous drone; no image processing using NDVI. |
| × | ✓ | × | × | × | It is not an autonomous drone; there is no image processing using NDVI, but rather MNDWI technology is used. | |
| [38] | ✓ | ✓ | × | × | × | No image processing using NDVI; no counting techniques used. |
| [39] | ✓ | ✓ | × | × | × | Not an autonomous drone; no image processing using NDVI. |
| [40] | × | ✓ | × | × | × | No image processing using NDVI; no counting techniques used. |
| [41] | × | ✓ | × | × | ✓ | Not an autonomous drone; image processing technology is not mentioned. |
| [48] | ✓ | × | × | × | × | No image processing is done using NDVI. There are no techniques for object detection or counting. |
| Proposed work | ✓ | ✓ | ✓ | ✓ | ✓ | Autonomous flight, detection and classification, counting, image analysis, and collecting data using the Faster RCNN algorithm, NDVI, and 5G Wi-Fi. |
3. Proposed Model
Let us start by dissecting the proposed system that facilitates the monitoring of vegetative ecosystems, as shown in Figure 1, by deploying an autonomous UAV incorporating advanced ML technology. When the UAV is positioned near the terrestrial surface, it will harness rapid wireless communication capabilities, rendering it well-suited for extensive coverage of the designated area. The UAV’s operational functions encompass four distinct tasks, which are tree monitoring and enumeration, leaf observation, soil assessment, and detection of residual water bodies. For leaf analysis, the system will employ spectral analysis techniques to gauge the proportion of green pigmentation in specific locations, thereby enabling a comprehensive evaluation of foliage health.
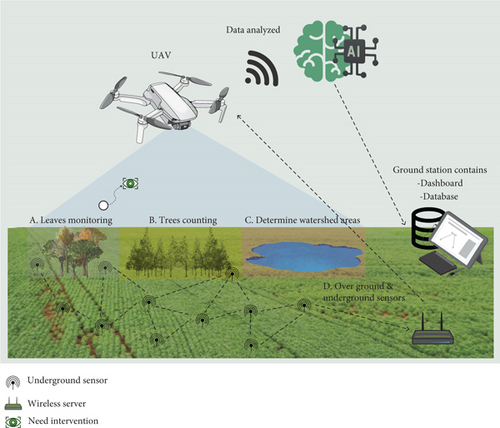
Vital indicators of soil conditions will be captured through specialized sensors, providing real-time insights into soil state, while concurrently surveying water remnants to optimize their utilization. Subsequently, the acquired data will undergo rigorous analysis, and the resultant findings will be transmitted to relevant stakeholders, facilitating ongoing monitoring and informed decision-making. Ultimately, the integration of these cutting-edge technologies will serve to actualize the principles of sustainable tourism, thereby contributing to the preservation of ecological equilibrium.
3.1. The AI Framework
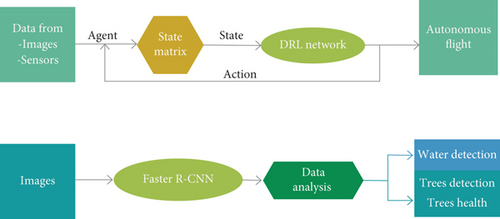
This subsection describes the proposed pioneering approach to develop smart agriculture using multimission drones equipped with dual cognitive modules (brains) that are powered by ML framework, as Figure 2 illustrates.
3.1.1. First Brain
Fully autonomous drones provide a significant advantage by autonomously navigating locations with trees and shrubs, imperceptible to farmers. Our project employs a Pixhawk flight controller [54] for autonomous flight, addressing the challenge of potential drone loss with a GPS global tracking system.
Engineers in the aviation and aerospace sectors have to work on various aspects such as reducing the weight of airplanes for easy flying, increasing satellite security and surveillance, reducing aircraft emissions and noise, and ensuring good stability as well as control of aerospace vehicles because it is required from a performance and safety point of view. It demands the application of high-level, effective control systems and designs that assure longitudinal as well as transverse stability. The design of aerial and space vehicles faces a big issue related to energy savings since these vehicles need high load-carrying capacity, that is, they require robust and highly powerful sources, so that their engines and other systems can be operated efficiently. For this purpose, energy-saving technology needs to be used along with the energy-saving equipment.
To give the drone outstanding stability and control, we selected an aviation controller with high efficiency and low energy consumption. In addition, the GPS was chosen due to its effectiveness, low power usage, improved security, and satellite tracking. Because they are both lightweight, the drone can fly with ease without weakening the chassis.
- •
32-bit Pixhawk PX4 Autopilot Open Code Flight Controller V2.4.8: A 32-bit ARM chip, which runs Pixhawk 2.4.8, gives the power needed to run smart flight rules and self-flying modes. This flight control kit can work with many UAV types, like fixed-wing planes, large multicopters, or small quadcopter. An extra backup inertial measurement unit (IMU) comes as a norm on the Pixhawk 2.4.8 for more backup and trustworthiness. When a sensor stops working, redundant sensors help to maintain exact flight control. Many flying styles, like steadiness, height hold, and go back to start (RTL), are backed by the Pixhawk. These setups allow for both self-flying and hands-on flight control. The sky control tool lets folks make self-flying routes and tasks by choosing points and task plans. Telemetry systems for the drone’s real-time monitoring and control are available on Pixhawk. Assisted by the flight controller, barometric pressure, magnetic fields, and speed sensors help refine performance and orientation. Integration of extra sensors or peripheral devices like distance meters and cameras is made easier due to design modularity in Pixhawk 2.4.8. The Pixhawk platform runs on open-source firmware PX4 or ArduPilot, which allows users to modify its operation according to their needs. The Pixhawk 2.4.8 set is known for its endurance and reliability, even when subjected to different weather conditions. It always consists of high-quality materials as a default option. It secures much better flights with such features as low-rated voltage or failsafe warnings, thus ensuring safety during these air travels.
- •
NEO-M8N Ready-to-Sky GPS Module with Compass for APM/Pixhawk: The new module that has the HMC5883L digital compass included is called Pixhawk FC. The NEO-M8N GPS module is a GPS receiver module with an integrated compass for APM. This device has active circuits for the ceramic patch antenna and a high degree of sensitivity. To shield the device from objects, a plastic case is also included. It is a small, dependable receiver unit that is frequently utillized in drones and UAVs. Its main job is to give the flight controller precise location and compass data so that precise navigation and flight planning are possible. This device features a rechargeable backup battery for warm starts in addition to producing precise position updates at a rate of 10 Hz. NEO-M8N may be utillized with Pixhawk and is set up to operate at 38,400 baud. The GPS drones have a GPS module installed, which enables them to track their location on a satellite network in orbit. Signals from the satellites are sent for communication, which makes it possible for the drone to perform such functions as flying autonomously, suspending in one position, returning home, and navigating road points. This ensures that the drone is never lost and has an idea of where it is at all times, with some chance of returning. A GPS module that gives accurate global positioning information is included in the kit; this module often utillizes a U-blox M8N chipset. It can support various satellite constellations like GPS, GLONASS, Galileo, or BeiDou. The NEO-M8N module uses the u-blox NEO-M8N chipset, which is known for its high accuracy and fast acquisition of GPS signals. One way this chipset enhances the accuracy and reliability of the module is by allowing the reception of signals from multiple satellite constellations, including GPS, GLONASS, Galileo, and BeiDou. The directional orientation of the drone within Earth’s magnetic field can be determined by an embedded compass (magnetometer) in this module. For tasks like waypoint navigation and return-to-home (RTH) functionality, this is essential. Dual antennas are a common feature of NEO-M8N modules, which improve signal reception. To reduce multipath interference and boost signal strength, these antennas are often positioned apart. The NEO-M8N is easily compatible with renowned flight controllers such as APM and PIXHAWK. It typically connects to these controllers through a standard connector and communication protocol. Depending on the configuration, it supports RTK high-precision positioning, which is accurate up to the centimetre level. For such applications as surveying or mapping that need great precision, RTK is best used as it needs a base station for differential correction. For regular GPS and compass data updates, the module usually offers a high update rate. This ensures responsive and stable flight control. It is simple to incorporate the module into a drone’s frame without significantly increasing its weight because of its compact and light construction. To lessen the effect of drone vibrations on GPS and compass performance, certain NEO-M8N modules might have vibration-damping devices. The module’s LEDs can display status information that is helpful for troubleshooting and diagnostics, such as GPS fix status and communication with the flight controller. Installing and connecting the module to your flight controller is easy because it usually comes with a mount and cable.
Autonomous drone control relies on RL, as depicted in Figure 3(a). RL defines the training environment, specifies states, and articulates drone actions. Deep learning trains the drone to navigate obstacles using extensive datasets, with RL crucial for trial-and-error learning. DRL integrates artificial NN and RL for optimal action determination, varying with the problem and input.
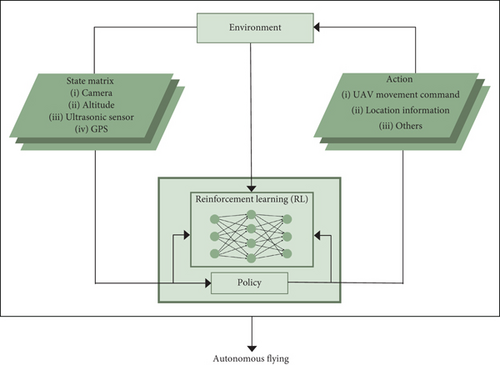
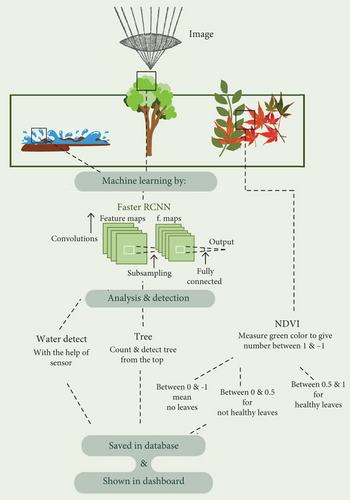
Figure 3(a) illustrates an RL agent for UAV navigation, utilizing various input devices. The RL agent generates action values, corresponding to UAV movements. After executing an action, the agent receives a new state and a reward based on a predefined function aligned with desired outcomes.
Path planning constitutes a crucial aspect of the autonomous navigation of UAVs to ascertain the optimal trajectory, adeptly circumventing obstacles in route to the predetermined destination. We have seamlessly integrated the functionalities of obstacle detection and avoidance with the systematic surveying of specific geographical regions. The UAV is subjected to rigorous training to adeptly capture images throughout its flight trajectory, commencing from a predefined initiation point and concluding at the termination point, thereby ensuring the identification of the most efficient and concise path.
Subsequently, the UAV strategically identifies waypoints, continuously capturing images during the surveying process until it attains the predetermined endpoint. In the occurrence of an obstacle, the UAV promptly suspends the survey, executes a navigational detour around the impediment, and subsequently resumes the scanning process and capturing and processing images seamlessly. The concluding phase involves the UAV’s return to the initial starting point, culminating in a safe and precise landing.
Focuses on obstacle avoidance, emphasizing the UAV’s role in navigating surroundings and circumventing obstacles. Distance sensors (ultrasonic sensors) and depth information from cameras provide foundational input for the RL algorithm. Operational boundaries are defined by a geofence, and obstacle identification employs the Canny edges detection algorithm, enhancing object edges and engaging distance sensors for effective obstacle detection.
3.1.2. Second Brain
In Figure 3(b), the UAV follows a tripartite sequence: observation (data collection), data analysis, and data transmission. In the observation phase, the UAV captures high-resolution images across a predefined geographical expanse to assess vegetation, watershed, and foliage well-being. In the subsequent analysis, a pretrained OpenCV model classifies images, expediting outcomes.
- •
Leaves monitoring: The UAV analyzes tree photographs, computing the green degree percentage through the NDVI. NDVI, calculated using a user-defined algorithm, measures vegetation density indices for nuanced crop analysis and variable-rate farming recommendations.
- •
Trees counting: The system accurately counts. Trees by incrementing a counter upon recognizing a shrub or tree in the image. The final count is transmitted to the administrator, allowing the identification of variations over time.
- •
Detection of watershed: Humidity sensors assess moisture during aerial reconnaissance. At a 90% threshold, indicating water presence, a training model enables the drone to recognize water locations in images. CNN or Faster R-CNN expedites this classification. The drone transmits water–related information to authorities after successful detection.
3.2. Formatting of Mathematical Components
3.2.1. The Autonomous Flying Components
Depth information is obtained using an enhanced Canny edge detection algorithm, replacing the image gradient in the original algorithm with the strength of the gravitational field. This updated approach retains the benefits of the Canny algorithm, notably improving noise suppression and preserving intricate details, leading to a higher signal-to-noise ratio (SNR). The detection outcomes of this technique surpass those of conventional first-order edge detection and standard Canny algorithms, making it a recommended choice for implementation in the project under investigation.
The collective gravitational field intensity, formed by the neighboring pixels, influences the overall gravitational field intensity at a specific point in the image. The resultant gravitational field intensity is interpreted as an image gradient, and pixels surpassing a defined threshold are considered edge points.
In this formula, r_i denotes the position vector of the i-th pixel in the 2 × 2 neighboring region, and n represents the total number of pixels in that region. The gravitational field intensity produced by pixels at a greater distance is considered negligible. Figure 4 illustrates the pixel locations in a 2 × 2 neighboring area, with pixel distances defined as 1 for horizontal or vertical pixels and 2 for diagonal pixels.
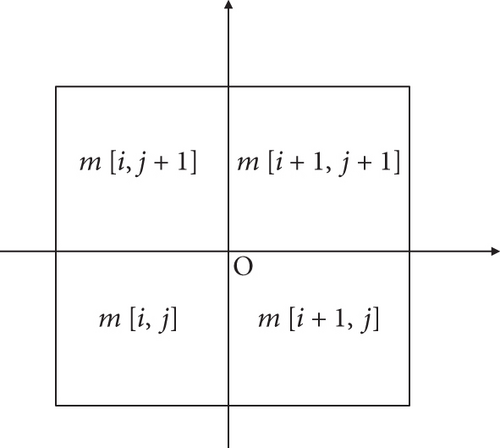
In the context of gravitational field intensity calculation, where i and j represent unit vectors in the horizontal and vertical directions, respectively, the direction of the gravitational field intensity is denoted by →. The gravitational constant, G, may be adjusted for specific conditions, and if G = √2/2, Equation (10) reveals that the gravitational field intensity calculation template aligns with the standard Canny gradient computation operator for a 2 × 2 neighboring region. Expanding the neighboring area from 2 × 2 to 3 × 3 windows enhances the preservation of edge information. The pixel positions in the 3 × 3 window are detailed in Table 2.
| I[i − 1, j + 1] | I[i, j + 1] | I[i + 1, j + 1] |
| I[i − 1, j] | I[i, j] | I[i + 1, ] |
| I[i − 1, j − 1] | I[i, j − 1] | I[i + 1, j − 1] |
In the context of image processing, let E [i, j] represent the image gradient size, reflecting the strength of the gravitational field. Th and Tl correspond to the high and low thresholds, respectively, while σ denotes the image’s standard deviation, and k is its modulus. Eave signifies the average gradient size, with m and n denoting the pixel dimensions in the image’s width and elevation directions, respectively. The experimental determination of the k value range is recommended. In instances where the gradient size distribution is dispersed, and the image contains rich edge information, adjustments to σ and k values are essential. Specifically, a higher σ implies a larger k value, preserving more edge information, while an alternative approach involves a lower σ and a higher k value.
For images characterized by a wide field of view, abundant edge information, and a sparse gradient size distribution, traditional dual-threshold methods may not be effective due to uneven contrast and a high standard deviation of the image gradient. To address this, [49] proposed a pixel-specific dual-threshold approach. Initially, the average gradient amount eave for the entire image is determined. A nondirect edge point is identified if the pixel gradient size I[i, j] is within 15%–20% of eave. This approach ensures that in areas with minimal edges, the optimized method avoids introducing excess noise. The gradient of the N × N matrix image, centered at pixel I[i, j], is computed using the average gradient size and standard deviation of the elements, where N is an odd number typically exceeding 22. Threshold values for each pixel are then calculated accordingly. In cases where a pixel is situated in the image border region and the matrix is smaller than N × N, null values are assigned to insufficient sections. Subsequently, mean and standard deviation calculations for this matrix are employed to determine the threshold. This dual-threshold strategy is applied to each pixel, facilitating edge detection and connection for the entire image.
3.2.2. Faster R-CNN Algorithm
As discussed in the Related Studies section, Faster R-CNN surpasses alternative object detection algorithms in both speed and accuracy. Unlike its predecessors, Faster R-CNN substitutes the selective search algorithm with the region proposal network (RPN), which markedly reduces the time required for generating region proposals. Consequently, this enhancement enables real-time object detection applications to be effectively implemented using the Faster R-CNN algorithm.
The main parts of the Faster R-CNN are the RPN, ROI pooling, a classifier, and a regressor head in order to obtain the predicted class labels and bounding box locations.
3.2.2.1. RPN
- -
Anchor boxes: Anchor boxes are predefined, fixed-size boxes with specified height, width, and aspect ratio, strategically placed across the input image. In R-CNN, a set of k anchor boxes is systematically generated for each spatial position in the input image, represented as k (h, w) pairs with corresponding aspect ratios denoted as r:
- -
Objectness score: For each anchor box, the RPN yields a prediction of the objectness score, indicative of the likelihood of an object being present within the given anchor box. Let p_i represent the objectness score for the ith anchor box. The computation of the objectness score is accomplished through a logistic regression function.
- -
Bounding box regression: In tandem with predicting the objectness score, the RPN within the Faster R-CNN algorithm is crucial for refining the coordinates of bounding boxes around detected objects, such as trees and water locations, in large agricultural areas. Let (x_i, y_i) represent the center of the ith anchor box, h_i denote the height, and w_i indicate the width. The RPN predicts four parameters for each anchor box, denoted as (t_xi, t_yi, t_hi, t_wi). These parameters signify the offset from the anchor box to the actual object bounding box. The projected bounding box coordinates are calculated using the following ensuing equations:
Here, the function exp denotes the exponential function.
Here, r represents the ground-truth label for each anchor box, t signifies the predicted bounding box coordinates, t∗ denotes the ground-truth bounding box coordinates, L_obj is the binary cross-entropy loss for objectness classification, L_reg is the smooth L1 loss for bounding box regression, and λ is a hyperparameter regulating the balance between the two losses.
In the context of smart agriculture, especially in monitoring tasks such as tree counting, water location detection, and plant health analysis, careful application of bounding box regression formulas is essential. The primary role of bounding box regression here is to ensure the accuracy of the bounding boxes encapsulating detected objects, which is crucial for making informed environmental decisions, enhances the accuracy and reliability of aerial monitoring, and contributes to the overall goal of sustainable and efficient agricultural management.
Formulas are applied in calculating the displacement where the displacements (t_xi, t_yi, t_hi, t_wi) predicted by the RPN adjust the position and size of the anchor boxes, aligning them more accurately with actual objects, such as trees or bodies of water. This modification transforms the initial fixation boxes into more accurate bounding boxes, which is critical for reliable observation. In bounding box optimization, formulas are applied to optimize bounding boxes, making them fit the detected objects precisely. This is especially important in agriculture, where objects may vary in size, shape, and orientation due to natural variations and different environmental conditions.
This has implications for monitoring tasks in agriculture such as improved resolution. Accurate bounding boxes are vital to correctly identify and monitor objects such as trees and water sources. This accuracy ensures the system’s ability to provide reliable data for agricultural management and environmental conservation.
- •
RoI pooling: After that, in the classification module, region proposals are received and predict the category of the object in the proposals. A straightforward convolutional network can accomplish this, but there is a catch: Not every suggestion has the same size. In order to generate outputs of the same size, we split the proposals into approximately equal subregions (albeit they might not be equal) and perform a max pooling operation on each of them. We refer to this as ROI pooling. Following their resizing via ROI pooling, the suggestions are fed through a convolutional NN that generates category scores via a convolutional layer, an average pooling layer, and a linear layer. Using a softmax function applied to the raw model logits, the object category is predicted during inference, and the category with the highest probability score is chosen. Cross-entropy is used to compute the classification loss during training.
Here, j and k signify the spatial coordinates of the RoI region, while l and m represent the spatial coordinates of the spatial bin within the fixed-size feature map.
- •
Faster R-CNN loss: The R-CNN loss is a multifaceted, multitask loss function addressing classification and bounding box regression errors. The classification loss involves a cross-entropy loss measuring the disparity between predicted class probabilities (p) and ground-truth labels (y). Simultaneously, bounding box regression loss is calculated using a smooth L1 loss, evaluating the difference between predicted (v_i) and ground-truth (t_i) bounding box offsets. The overall Fast R-CNN loss is expressed as:
- •
Multitask loss: In the broader context of the Faster R-CNN, the overall loss amalgamates three distinct components: the RPN loss, the classification loss, and the regression loss.
- •
RPN loss: The RPN loss is defined as follows:
Here, p_i is the predicted objectness score for anchor box i, p_i∗ is the true objectness score, t_i is the predicted bounding box offset, and t_i∗ is the true bounding box offset. N_cls and N_reg are normalization factors for the classification and regression losses, respectively. L_cls is the binary cross-entropy loss for objectness classification, and L_reg is the smooth L1 loss for bounding box regression. The hyperparameter λ controls the balance between these losses.
3.2.3. NDVI
Here, n denotes the sample size, y represents the actual data value, and (y) ̂signifies the predicted data value. The mean squared error calculation aids in refining the drone’s ability to accurately count and differentiate between various vegetation types.
4. Experimental Implementation
This section provides a thorough and practical presentation of the suggested model using two major methodologies: the simulation portion, which concentrates on creating and evaluating the algorithms in a controlled setting prior to field implementation. In this phase, image analysis methods, communication simulation, and UAV flight dynamics are modelled using simulation software. The implementation phase, during which we worked on the UAV model’s hardware deployment. This entails combining many parts, including the space segment that has the Pixhawk flying controller and ultrasonic distance sensors for precise navigation and the ground segment that has ground sensors for soil property analysis and data acquisition.
4.1. Simulation
- a.
Autonomous flight.
- b.
Image analysis
- c.
Communications
4.1.1. Autonomous Flight Simulation
In this study, we verified Flight UAV using AirSim to create an environment that simulates reality. We created software code that instructs the drone to lift off, travel to the survey’s designated beginning location, and then return to the starting point after scanning the region to verify the drone’s ability to fly itself. A square with dimensions of 30 m × 30 m was designated as the survey area. Based on the average size of the agricultural plots that are usually monitored in precision farming missions, these particular dimensions were selected. The 30 × 30 m2 is a manageable size for preliminary testing and big enough to replicate any real-world scenarios the drone might face. This decision balances trade-offs between coverage, battery life, and accuracy of data collection, enabling the drone’s capacity to cover a representative region efficiently to be assessed. We can precisely assess the drone’s flight path planning and obstacle avoidance capabilities while conducting an extensive survey by scanning this confined area. These dimensions are significant because they may mimic actual agricultural monitoring situations, which guarantees the robustness and efficacy of autonomous drone navigation algorithms in real-world use.
- •
The first stage: We must select the objects in the image. First, we extracted the depth information to display the image objects. Then, we made the binary image contain only the objects that are obstacles, so we decided to use the Canny edges detections algorithm to determine the edges of the nearest object.
- •
The second stage: For drone training, at the beginning of our training, we created a small environment using pixels (500 × 500 × 500) and distinguished several obstacles. We employed a Monte Carlo approach to simulate 50,000 loops and perform value iterations to determine the optimal Q value for each state within the environment. The Q value, representing the expected reward of taking a specific action in each state, plays a crucial role in guiding the drone’s decision-making process during training. The Q values that accurately predict the expected rewards of various actions enable the drone to make effective decisions, leading to successful navigation and obstacle avoidance. The Q value is dynamically calculated and updated by the RL algorithm as the drone interacts with the environment, rather than being predetermined by the user. This value evolves over time as the drone learns from its experiences, with initial Q values often being random or set to zero. Throughout the training process, Q values are iteratively refined based on the rewards received and feedback from the environment. As training progresses, these values converge toward their optimal state, guiding the drone to make the best possible decisions and forming what is known as the optimal policy. The learning process requires a balance between exploration—where the drone tries new actions—and exploitation, where it selects the best-known actions based on current Q values. Initially, Q values may vary significantly as the drone explores different strategies. However, as the drone gains experience, these values stabilize, leading to more consistent and reliable decision-making. The influence of the Q value on drone training is evident in its ability to help the drone assess which actions yield the best results. For instance, if a particular action in a given state has a high Q value, the drone is more likely to select that action to maximize its cumulative reward. During the training phase, Q values are updated based on the rewards obtained from the environment. This iterative refinement process enables the drone to learn the most effective actions for different scenarios. As Q values become more accurate, they enhance the drone’s policy, improving performance in tasks such as navigation and obstacle avoidance. Through repeated simulations, the drone learns to make the most effective decisions in varying conditions, thereby enhancing its navigation and obstacle–avoidance capabilities. The drone determined its actions using the Epsilon Soft Policy methodology, and the code policy developed during training was subsequently integrated into the complete environment. Path planning is required for autonomous UAV navigation to identify the best UAV path to reach the flying destination while avoiding obstacles. We linked the task of detecting and avoiding obstacles with the task of conducting a survey of the specific area to go to. We trained our drone to scan and take pictures of the area during the flight by specifying the starting point and the end point, so that it sees the best and shortest path. Therefore, the drone identifies points to move through and takes pictures of the area during the survey until it reaches the point that has been identified as the end of the area, and when it sees any obstacle, it interrupts the survey work, avoids the obstacle, and then completes the scanning journey, taking pictures and processing them. Then, it returns to the starting point and lands.
4.1.2. Image Analysis Simulation
To verify object detection, we use Detectron2, complemented by Faster R-CNN, which excels in object detection with its user-friendly design. The dataset from Roboflow, featuring 117 preprocessed images of trees and water bodies captured by drones and satellites, underwent noise removal and resizing to 640 × 640 pixels. The dataset is effectively split into training (109 images) and test sets (8 images), enhancing its suitability for diverse applications. The algorithm’s success in accurately detecting objects underscores its effectiveness in computer vision tasks. After real-time detection and counting, the results are saved and processed into the NDVI, which displays a sample of the results, with each color symbolizing the health of the plants. The NDVI uses color to represent vegetation presence and density, with green indicating healthy vegetation, yellow to red indicating lesser presence, and brown to black indicating little to no vegetation (such as urban or barren land). This visual representation quickly assesses the distribution of green vegetation in an area.
4.1.3. Communication Simulation
In this study, we used a 5G-enabled Wi-Fi module and a GSM module for data transmission between sensors, a drone, and a ground station. Employed a Samsung Galaxy A53 for on-drone data reception and forwarding to the ground station. The model was successful in its implementation.
In Figure 5, path loss specifies a decrease in the power density of any given electromagnetic wave as it propagates through space. Path loss shows the value of the loss while the receiver receives the data from the sender, and based on that, we decide whether it is required to increase the transmission power or not. We chose to calculate the path loss using the free-space model.
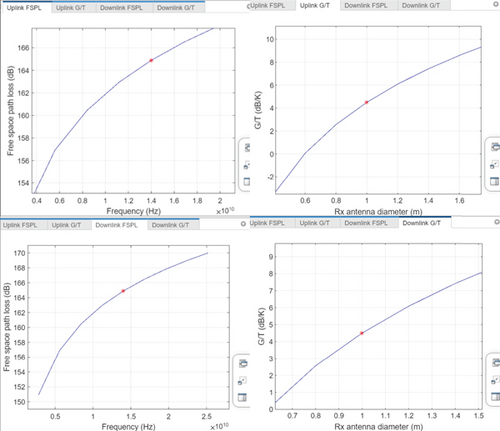
In simulation, we want to know the amount of path loss. We calculate the path loss using the free space path loss. We chose this model because 85% of the environment that the drone will scan, take data from, and analyze will be the line of sight. In FSPL, the measurement was equal in uplink and downlink, which indicates a balance in sending signals when there is a clear path between the transmitter and the receiver, where G is the antenna gain and T is the equivalent noise temperature. This gives good results in gain-to-noise temperature, and G gives 4 dB per kilo in uplink and downlink.
4.2. Implementation
4.2.1. Space Segment Implementation
This part of the project explains the practical and application parts of the multifunctional drone that we have created. We divided the work into three parts: the space part, which contains the stage of installing the firmware and assembling the drone, implementing AI frameworks of the first brain, how the drone moves, fully autonomous, and the implementation of the second brain AI frameworks, how to monitor and count trees, monitor the state of leaves, monitor water, and watershed areas. Then, we worked on the second part, which is the ground part, which consists of implementing the IoT and knowing the most important soil properties. It collects soil data from the drone at a height of 20 m above the ground, and all data is transferred from the drone to the dashboard via the 5G Wi-Fi wireless connection.
4.2.1.1. Implementation of the First Brain Algorithms
To provide data as accurately as possible, drone calibration involves lining up the internal sensors of the aircraft with the exterior sensors. A drone’s internal sensors must be calibrated for them to deliver more precise and trustworthy information about the orientation of the drone. We chose the Pixhawk as the microcontroller to be responsible for the take-offs and landings. As ground control software, we chose Mission Planner with ArduPilot flight control software. We chose these controllers for their many other benefits, which include software support such as PX4 reference hardware. These are our best maintained boards. Flexibility in terms of peripherals that can be installed. And they also support the Raspberry Pi. We downloaded the Python 3, DroneKit, and MavProxy packages to control the drone via the Raspberry Pi command line and by using the Python script, and after completing the necessary download, we were able to communicate with the Pixhawk via the Raspberry Pi.
In our autonomous drone system, obstacle recognition is crucial for collision avoidance during navigation. We employ a DRL algorithm utilizing an 8000-pixel front camera for real-time scene depth extraction. Ultrasonic distance sensors complement the camera data to measure obstacle distance. The algorithm processes this input to determine optimal actions and path adjustments postobstacle encounters.
A lot of challenges in aircraft engineering are intrinsically linked to the obstacle detection and avoidance systems of a drone. Thus, our research outcomes can facilitate innovation both in conventional aircraft and spacecraft and also in UAVs. Using the AI algorithm we built for our project to detect and avoid obstacles, autonomous systems can be optimized in conventional aircraft and spacecraft. So, the need for human pilots will decrease and increase flight safety. Therefore, the application of AI algorithms will enhance the safety advantage of drones, which can also help develop safer and more effective systems for aircraft and spacecraft, reducing the likelihood of unfortunate accidents.
There is a connection between drone obstacle detection and avoidance and aerospace engineering since both disciplines can benefit from these technologies’ capacity to improve safety, effectiveness, and creativity. Drone technological advancements enable the quick testing and implementation of novel ideas, which can subsequently be applied to space and aviation applications, aiding in the resolution of persistent problems facing the sector.
- •
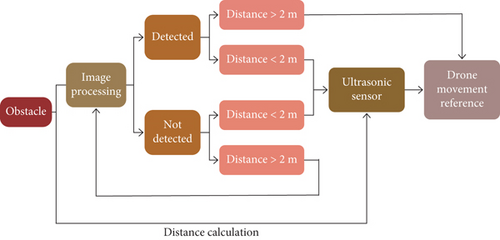
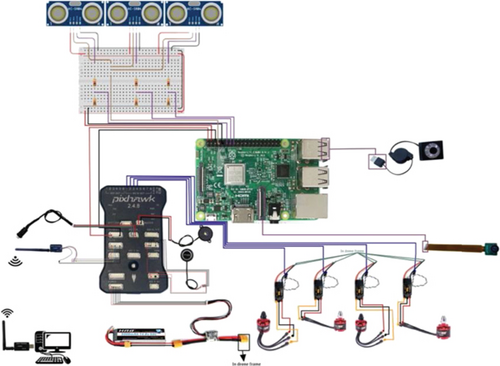
Avoiding obstacles: Our primary objective is to equip the drone with a camera to detect potential obstacles through computer vision and image processing algorithms. Distance sensors provide navigation commands, minimizing detours during obstacle avoidance. The algorithm estimates obstacle size, deciding optimal detour routes for efficient navigation. The flowchart in Figure 6 outlines the obstacle avoidance code, detailing the connection between the camera and ultrasonic sensors.
- •
Image processing: Utilizing the Canny edges detection algorithm, we identify objects in the image and extract binary depth information. In Figure 7, our experiment demonstrates edge identification. To address incomplete object definition, a thickening algorithm enhances the obstacle’s appearance in front of the camera, ensuring a comprehensive representation. This approach optimizes obstacle detection and aids in the seamless execution of navigation tasks.
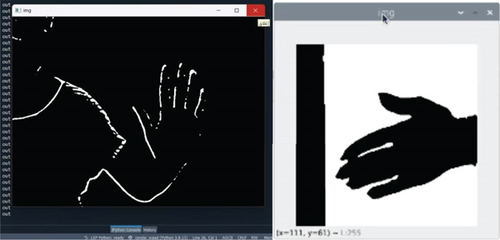
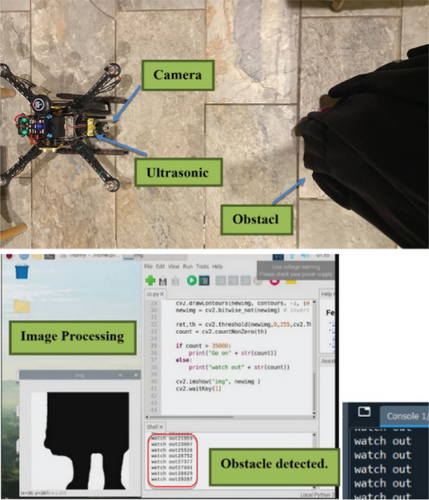
In binary image processing, we employ a morphological technique called thickening to enlarge foreground pixel patches, enhancing shape estimation and skeleton determination. A carefully chosen kernel facilitates a controlled pixel thickness increase. To ensure robustness, a precautionary border is added to image margins to prevent algorithmic challenges due to cut-off object portions. After image processing, obstacle detection results are displayed, and an obstacle’s binary depth information exceeding 35,000 is identified and flagged for avoidance. Ultrasound sensors, exemplified by the HC-SR04 sensor, measure distance by emitting and receiving ultrasound waves. We integrate three sensors (front, right, and left) into the drone project to capture distances from different perspectives, aligning with the drone’s forward-only motion. A coding framework calculates distances simultaneously, aligning with the Master Policy algorithm for obstacle avoidance. Our technology experiment included placing an obstacle in front of the camera a meter away to ensure that the object detects the obstacle using the camera first. We started to show the result of the obstacle detection and that there is indeed an obstacle in front of the camera, regardless of its type. To do this and after extracting the depth information in binary form, the value of the obstacle is increased if it exceeds 35,000, which means that it is an obstacle and should be avoided. Where 35,000 is the closest possible depth value and 0 is the largest possible depth value, Figure 8 shows the connection for the space segment of the drone, as it shows where the camera is connected and how it is connected to the distance sensors in the circuit.
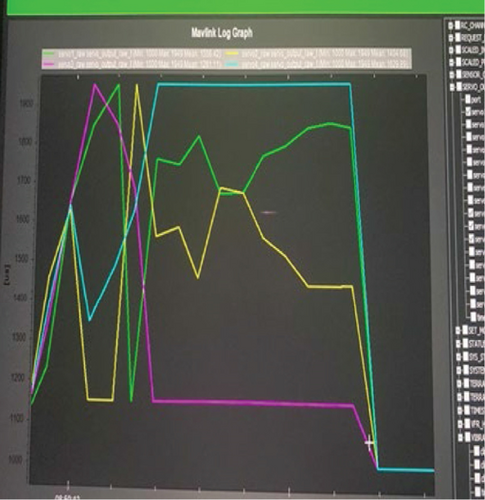
The output is displayed in the form of a “watch out” output shown in Figure 9(a), which indicates that the obstacle has been detected and the distance measurement stage has moved on. Experiments involving raising the drone 2 m above the surface and placing obstacles in front validate the successful integration of image processing and sensor data. When the camera detects an obstacle, the sensors measure distance, triggering appropriate actions as per the integrated flowchart. Notably, the drone effectively avoids obstacles, as evidenced by experiments where the calculated distance from the front sensor was less than 200 cm. The Pixhawk and MAVLink log graphs are essential tools for deciphering drone behaviour in the event of an obstacle collision or unstable conditions. The popular open-source autopilot Pixhawk logs a variety of flight parameters, which MAVLink log graphs can be used to examine. In y-axis for PWM in “us”, Pixhawk records motor outputs in microseconds, which are equivalent to pulse widths that are used to operate motors. PWM signal analysis during y-axis collision occurrences can provide insight into how the flight controller modifies motor outputs in response to impacts to preserve stability. Pixhawk records information from many sensors, such as gyroscopes and accelerometers. To comprehend how the drone’s sensors detect and react to collisions, sensor values on the y-axis measured in microseconds might be examined. In velocity and altitude: x-axis in meters per second or meters, Pixhawk records data on height and velocity, giving insights into variations during collision occurrences. Examining the x-axis altitude and velocity on MAVLink log graphs facilitates the analysis of the drone’s obstacle-avoidance maneuvers. It is clear from the figure after the first and second experiments that the movement is normal for the drone while flying and raising it at two meters without any collision or obstacle. During the third and fourth experiments, a sudden, perfect movement can be observed after the drone flips over after seeing an obstacle in front of it. The connection was immediately cut off, and the perfect movement occurred, as shown in Figure 9(b). After that, we completely reset the drone and conducted the final experiment as described in the results section.
4.2.1.2. Implementation of the Second Brain Algorithm
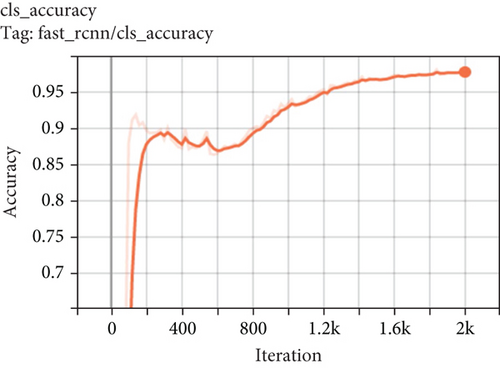
We configured our object detection algorithm using the Detectron2 library. We loaded the default configuration file for the Faster R-CNN model from the COCO detection model zoo and merged it with our custom configuration using the get_cfg and merge_from_file functions, respectively. To specify our training dataset, we set the DATASETS.TRAIN attribute of the configuration to the name of our training dataset (in this case, “my train”) and left the testing dataset attribute (DATASETS.TEST) empty, as we did not use a separate testing dataset. We used the pretrained weights for the Faster R-CNN model from the COCO detection model zoo as our initial model weights, which we specified using the MODEL.WEIGHTS attribute. We also set the batch size to 2 using the SOLV ER.IMS_PER_BATCH attribute and set the base learning rate and gamma for the learning rate scheduler using the SOLV.BASE_LR and SOLV.GAMMA attributes, respectively. We set the SOLVER.STEPS attribute to a single value of which represents the number of iterations at which the learning rate is reduced by the gamma factor. We set the maximum number of iterations for training (SOLVER.MAX_ITER) to 942 2000 and the number of classes for the ROI heads of the model (MOD EL.ROI_HEADS.NUM_CLASSES) to 3, which includes the background class in addition to our two classes of interest (trees and water). Finally, we set the device for our model to run on the GPU using the MODEL.DEVICE attribute, which enables faster training and inference times. Overall, configuring our Detectron2 model using these parameters allowed us to effectively train and evaluate our object detection algorithm on our annotated dataset. During inference, we loaded the trained model’s weights and set the score threshold to 0.5. We evaluated our model on a separate test dataset using the DefaultPredictor class of the Detectron2 framework and recorded the results. The test dataset was registered with the DatasetCatalog and MetadataCatalog classes in the same way as the training dataset. The get_data_dicts function was used to load the test dataset’s annotations from the JSON files, which were also created using LabelMe. The accuracy chart included in the Results section of Figure 10 shows that the model was trained until it achieved more than 95%. Accuracy on both datasets and that accuracy has continued to rise over the last few epochs, becoming 98%. For testing the model and cropping the detected images, we used the trained model to predict 958 on the test dataset and evaluated the performance of the model on six randomly selected images. We also tested it in real time. For each image, we extracted the number of tree and water spot detections and displayed them as text overlays on the image. We also visualized the predicted bounding boxes for each detected object using the visualizer class. Additionally, we saved the cropped images for each detected object to further analyze the accuracy of the model. The NDVI is a widely used index for monitoring the health and vitality of vegetation, including trees. By analyzing the reflectance of near-infrared and red light from a tree’s leaves, NDVI can provide an indication of its photosynthetic activity and overall health. In this project, we used object detection techniques to detect trees from a top-view image and then calculated the NDVI of the detected trees using digital image processing techniques. By applying a contrast stretch to the NDVI image and mapping it to a pseudocolor image, we were able to visualize the health of the trees in the image. The results of our study demonstrate the potential of NDVI as a tool for monitoring and assessing the health of trees, which can be useful in a variety of applications, such as forestry, agriculture, and urban planning. With further research and development, NDVI can be integrated into automated monitoring systems for trees, providing valuable information for environmental management and conservation efforts. We tested two hypotheses (the scenario) for the state of vegetation: dry plants and green plants. So there is an area in the image resulting from testing the hypothesis that does not contain plants (trees) or grass. Also, there is a region with green trees. The dry regions that have no trees (dead trees) are represented by a grey color, and the other regions that have trees are represented by the colors in the NDVI scale. The red color represents very healthy or green trees, and as it becomes orange or yellow, the tree color will be light green and so on. To illustrate the color NDVI scale and how it represented it, we tested another scenario. The grass in the center is light brown (not healthy), and the grass in the boundary is green (healthy). The center region that has light brown grass is represented by yellow and light green, and that means the grass is not dead; it is so dry (not healthy).
4.2.2. Ground Segment Implementation
- •
Temperature and humidity sensor DHT22: The DHT22 includes a humidity sensor in addition to a highly accurate temperature sensor that is coupled to a powerful 8-bit microprocessor [58]. It uses humidity and temperature sensing technology, as well as digital module acquisition technology [58]. As a result, it offers excellent quality benefits, rapid reaction, high-cost performance, and strong interference resistance. Also, its size is ultrasmall, and its power consumption is extremely low, coupled with a signal transmission of over 20 meters [59].
- •
Soil sensor HW-080: This sensor detects the moisture content of the soil in which the plant is being held. It has two electrodes embedded in the ground. We put this solid sensor into the soil to be measured, and the volumetric water content of the soil in percentage is recorded.
- •
Water level sensor T1592P: It is used to measure the water level in the soil. It features a measuring range of 1–200 m for the water level; other ranges can be adjusted as well. It has a wide range of applications, such as monitoring liquid levels at high pressures and temperatures, high contamination levels, and severe corrosion [60]. Firebase was utilized to extract data from sensors on a Raspberry Pi attached to a ground segment and send it directly to the application. The real-time nature of Firebase allowed us to monitor and analyze the data as it was received, enabling us to make informed decisions and provide users with a dynamic and responsive experience.
The number of sensors the Raspberry Pi can effectively manage depends on various factors, including sensor types, communication protocols, processing capabilities, and GPIO pin availability. It is worth noting that the Raspberry Pi 4 Model B features 40 GPIO pins, providing a wide range of sensor interactions. Each GPIO pin can be configured to interface with various sensor types, including, but not limited to, temperature, humidity, and soil moisture sensors. Furthermore, interfaces such as I2C, SPI, and UART make it easy to connect multiple sensors to a single Raspberry Pi, thus increasing its sensor-handling capability.
In addition to these capabilities, it should be noted that the sensors used in our study are portable and interchangeable, providing greater flexibility in deployment. This feature allows for improved sensor distribution and may reduce the total number of sensors and Raspberry Pi cards required. However, the practical limit of sensors that the Raspberry Pi can accommodate is subject to considerations such as processing power, memory availability, and project-specific requirements. Although Raspberry Pi boards inherently have the ability to manage multiple sensors simultaneously, the actual number may vary depending on these factors.
For a 200-square-meter floor area scenario, determining the sensor and Raspberry Pi requirements entails determining an appropriate sensor density per unit area. Assuming detailed soil monitoring is desired, sensors placed at regular intervals throughout the area can provide comprehensive coverage. To calculate the total number of sensors needed, the required spacing between sensors must be determined. For example, deploying sensors at 5 m intervals would create a grid-like coverage pattern as a single agricultural area has the same characteristics. Dividing the total area by the coverage area of each sensor, such as an area of 5 × 5 square meters (25 square meters), results in the total number of sensors required.
Once the total number of sensors is determined, the number of Raspberry Pi cards needed can be derived based on each Raspberry Pi’s ability to interface with multiple sensors. For example, if a Raspberry Pi can manage 4 sensors and 40 sensors are needed, 10 Raspberry Pi cards would be needed to accommodate all the sensors.
As for the scenario we worked on—a farm with an estimated area of 16 square meters—we designed the calculations accordingly. To meet the sensing requirement, each sensor covers a square area with sides of 4 m, which gives high accuracy of detection. Thus, with each Raspberry Pi capable of managing four sensors, a single Raspberry Pi card is sufficient to satisfy the spatial dimensions under consideration. Although these calculations provide a foundational framework, they emphasize the need for adaptability to accommodate project nuances and different soil conditions. These considerations are of paramount importance in improving sensor deployment strategies for agricultural monitoring initiatives.
Rechargeable batteries are a great way to power agricultural monitoring systems’ ground sector, and they also help agricultural monitoring systems achieve their sustainability objectives. Rechargeable batteries help to make ground-sector operations more economical and environmentally friendly by lowering the requirement for throwaway batteries and their negative effects on the environment. Rechargeable batteries do not require frequent battery changes because they are simple to refill. It lessens the influence on the environment. They also offer deployment flexibility, enabling off-grid or distant installations in situations where access to a steady power source may be restricted. For the sake of our study, the Raspberry Pi and the sensors it is connected to are powered by rechargeable batteries, which guarantees the monitoring system’s ongoing, unbroken operation. The design of an effective and dependable power supply solution was conducted by considering various elements, including device power consumption, battery capacity, and frequency of charging. This approach ensures a successful initial trial.
The agricultural monitoring systems’ ground element was powered by a 100,000 mAh rechargeable battery, which provided notable advantages in terms of increased operating duration and dependability. The high capacity of the battery enables it to store a significant amount of energy, enabling extended periods of continuous operation without frequent recharging. This feature guarantees that the monitoring system can function continuously for extended periods of time, even in isolated or off-grid locations that might not have access to a power source.
Figure 11 shows the connection of ground sensors with an IoT system that sends all data through the application in the results section of this paper.
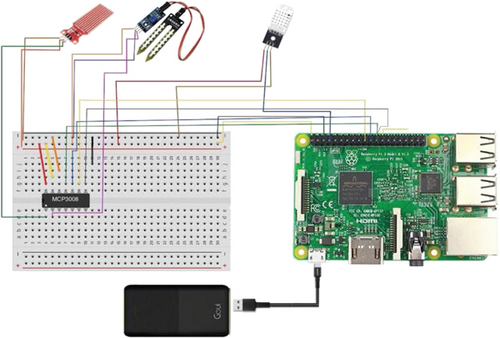
5. Experimental Results
Lastly, we have reached the results of our experiment with the autonomous drone system. Three perspectives are taken into consideration while presenting the results: space segment, ground segment, and communications,
5.1. Space Segment
5.1.1. Results in First Brain
As we mentioned in the implementation part of this paper, the drone is enabled to recognize the obstacles it faces while moving so that it does not collide with anything while heading to the desired destination. We associate the task of detecting and avoiding obstacles with the task of scanning the specific area where we want to go, taking pictures, and performing the rest of the second brain tasks. The bottom line is that the drone navigates a certain area in a scanning manner, and when it sees any obstacle, it interrupts the scanning work, avoids the obstacle, and then continues the scanning journey, taking images and processing them.
During our experience, we chose to fly the drone over several adjacent and small trees to test the detection that we worked on. Also, we had to make sure of the appropriate timing, so the drone would not fly in rainy weather or when there is wind. We made sure to make the propellers stable by putting blue thread locker material on the four nuts, which works to mitigate shocks and vibrations and prevent them from falling suddenly when the motors are moving.
Using the mission planner program, we made sure that the propellers were installed in the correct directions, the drone was balanced, and the GPS worked after connecting it to the Pixhawk. After that, we tested the flight by performing a rise and fall at 2 m using the guide mode, which makes the drone wait for orders from you during the flight before we turn on the flight code as in Figure 12(a).
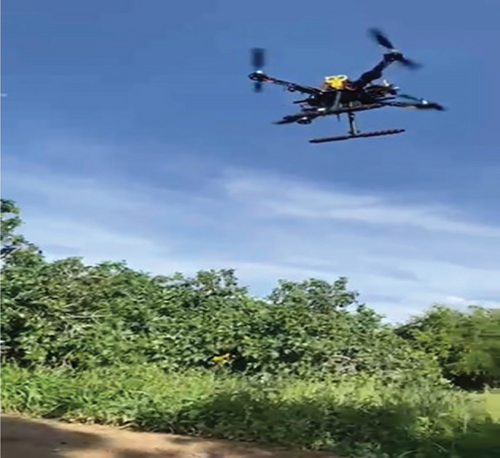
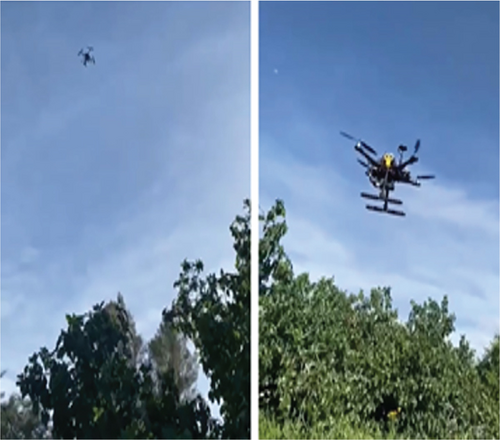
After verifying the drone’s flight in a balanced way, we started the mission 12 m above the surface using the flight code that we had previously programmed on the Raspberry Pi. Figure 12(b) shows the drone flight during the mission and the survey process of the area.
The primary restriction on UAVs is their flight time, which is determined by battery capacity, which is likewise influenced by the weight and size of the UAVs. This is important to note [61]. According to [62], the market for lightweight aerial vehicles is presently dominated by lithium polymer (LiPo) batteries because of their high energy density and high current discharge capabilities. We used a 6000 mAh 4S LiPo battery. Over 90% of power is used by the motors that supply thrust, according to Mandel, Milford, and Gonzalez [62]; however, it is also important to take computing capabilities into account [61]. Studies demonstrate that an efficient system design can enhance battery longevity. Boroujerdian et al. [63] claim that faster calculation capabilities can considerably reduce total power consumption for the same work due to reduced time spent at hover and lower accelerations. Drone energy consumption may be nearly halved by doubling processing speed to five times. For instance, given a tiny quadrotor, an average flight time of 10 min can be achieved with a 4-cell lithium-polymer (4S LiPo) battery with a capacity of 2200 mAh. This can be further extended to 30 min by speeding up processing [61]. With our 6000 mAh 4S LiPo battery, we can expect an average flight time of approximately 27.27 min. The coverage area in our experiment was 20 m in 6 min and 15 s. So, every drone can scan a crop of 20 m in 6 min and 15 s and go back for recharge. If we have a farm of 120 m, it will be divided into 6 crops, and we can use one drone for each crop to scan it considering the return time.
Although flight time is a constraint, we have thought of several strategies to mitigate its impact. Increasing battery capacity may extend flight time but adds weight which can negate the benefits by reducing the drone’s manoeuvrability and efficiency. Therefore, to maximize flying time without sacrificing performance, a precise balance between battery size and weight must be struck. Research is also being done on fast-charging solutions to minimize downtime in between missions. Reducing the negative effects of flight duration limitations on overall operational efficiency can be achieved by including a quick charging device into the docking station. Furthermore, we are investigating power-saving methods to preserve electricity while doing duties. This entails streamlining the schedule, cutting down on traffic, and eliminating pointless stops. Furthermore, we are thinking about incorporating low-power modes for computational units and on-board sensors when they are not in use. By doing these steps, the drone’s operational capabilities can be increased, and its overall battery life can be greatly increased. Combining solar panels and batteries to create hybrid energy systems is another interesting strategy. By adding more power during the flight, this method can increase operational time without requiring regular recharging. These techniques seek to maintain the effectiveness of our drone system for surveying wide areas while optimizing its efficiency.
We previously confirmed that the camera is working for the second brain by running it on the Raspberry Pi with the command lib camera-vid -t 8000 -o FinalTest.h264. To photograph trees for a period of 8000 ms, which means 8 s, which is sufficient time to verify an appropriate number of trees vertically or like an eye bird view. In obstacle avoidance, an algorithm is used to identify objects by identifying the object and extracting depth information using the camera to try to estimate the size of the obstacle before trying to get around it and finishing the flight with the few turns required by the drone. The ultrasonic sensor estimates the distance in front of the drone and makes decisions as shown in Figure 6, which we discussed in the previous section.
In our experience, as shown in Figures 13(a) and 13(b), the drone saw and recognized the obstacle through the algorithm, and the distance was calculated to choose the shortest path. Accordingly, the drone made the decision to turn to the right and complete the journey.
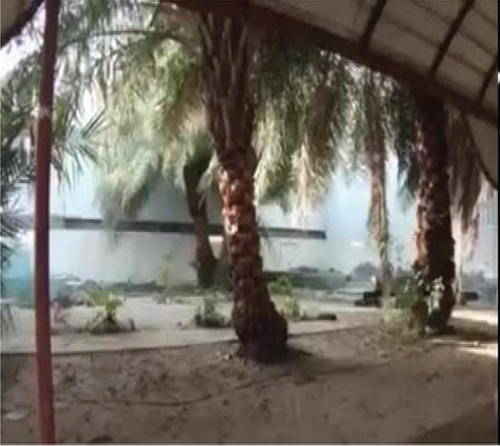
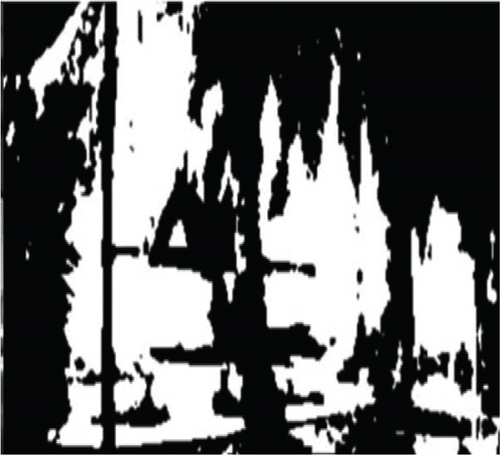
5.1.2. Results in Second Brain
We used the model that we trained to recognize trees and water spots during the survey. We extracted the number of tree and water spot detections in the area, analyzed the captured images in real time, and recorded them on the dashboard.
5.1.2.1. Detection Result
During the drone survey of an area, our focus is on real-time tree detection. The high-quality imagery captured by the camera ensures accuracy in tree recognition, contributing to the efficiency and effectiveness of the survey process. This real-time approach enhances the overall capabilities of the survey by providing timely and precise information about the presence and distribution of trees in the surveyed area. Figure 14(a) shows the vision of the drone during the survey before processing, and Figure 14(b) shows the result after implementing the experiment in real time. We can observe high accuracy in detecting trees, which enables us to know their number within the area covered by the study, in addition to performing analyses on them.
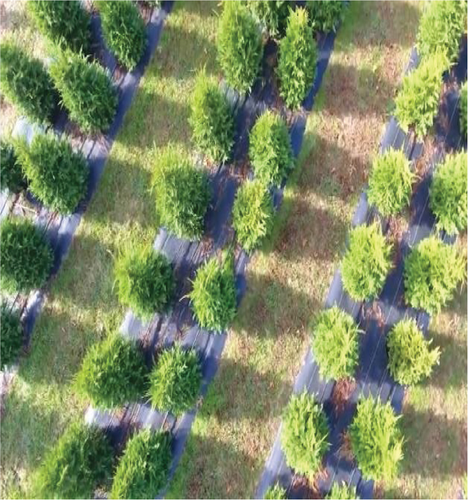
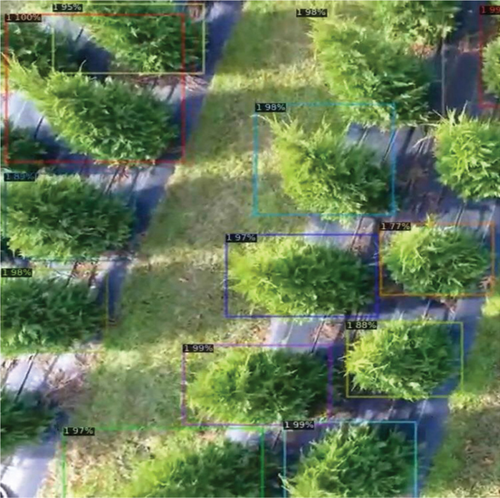
5.1.2.2. NDVI Results
After real-time detection and counting, the results are saved and processed into the NDVI. Figure 15 displays the results, with each color symbolizing the health of the plants. The NDVI uses color to represent vegetation presence and density, with green indicating healthy vegetation, yellow to red indicating lesser presence, and brown to black indicating little to no vegetation (such as urban or barren land).
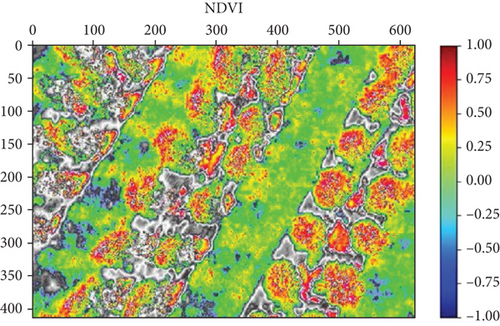
The scale from 0 to 1 shows that when the score is from 0.5 to 1, the plant is completely healthy, the leaves are growing well and do not need intervention, and the agricultural system is doing well. When the result is from −0.25 to 0.25, this means that the plant is at the onset of drought and the leaves are not receiving good and sufficient nutrition, so it needs intervention before the plant dies. As for the result from -1 to -0.25, this means that the plant is dilapidated and not healthy at all and needs a change in the agricultural system and the tree watering system on the farm.
In our experience, the trees appeared in a proportion between 0.5 and 0.75, and some places on the tree were at a ratio of 0 to 0.25, which means that the plant is healthy and needs little irrigation at the present time, and this indicates that the farm is running a good agricultural system. There are light-colored areas between the trees, which are a slightly dry vegetation corridor that needs irrigation because its ratio ranges from −0.25 to 0. It shows completely black areas on the grass paths, which means that its ratio is −1, which indicates that the plant here has died and these grasses must be replaced. This visual representation quickly assesses the distribution of green vegetation in an area.
5.1.2.3. Discussing the Training Accuracy
Figure 10 shows the plot of accuracy. During the model’s training, when the sample training was 650 iterations, the accuracy was 87.5%; when it was 1200 iterations, it achieved an accuracy of 95%; and when the training was repeated by 2000 iterations, the accuracy reached 98%, so we notice that the more iterations the training, the greater the accuracy.
5.2. Ground Segment
While performing this part, we made sure that the Raspberry Pi ground code works with the ground sensors to measure moisture, temperature, water level, and humidity. We first planted the sensors on the ground before the drone flew, so that there would be a connection between the drone and the ground sensors, and then the drone would send the data it picked up from the ground to the ground station. Figure 16 shows the preparation of the ground segment system before the drone flight process. To display sensor readings, we used Blynk, which is intended for use with an IoT. It can store and visualize data, display sensor data, operate devices remotely, and do many other things. And dashboard to display the results for the space and ground segments.
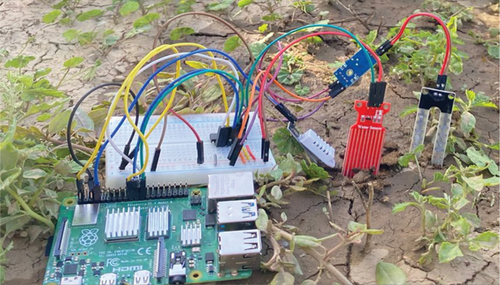
5.2.1. Results in Blynk
In Figures 17(a) and 17(b), the soil moisture sensor is 100%, which means the soil is dry, that is, there is no water, so we have the water level sensor at 0%. The temperature and humidity here are also good for cultivation because plant growth is highly affected by exposure to ambient temperature and humidity. In general, warmer days stimulate plant growth, while cooler days stunt growth. In Figures 17(c) and 17(d), a lot of water has been added to the soil, and as a result, the soil moisture sensor showed 2.15%, which means the humidity is high. The water level sensor has also become 100%, which means that the water level is high, so the soil moisture will last for a week or two, depending on the need of each plant for water, and the temperature and humidity influence that.
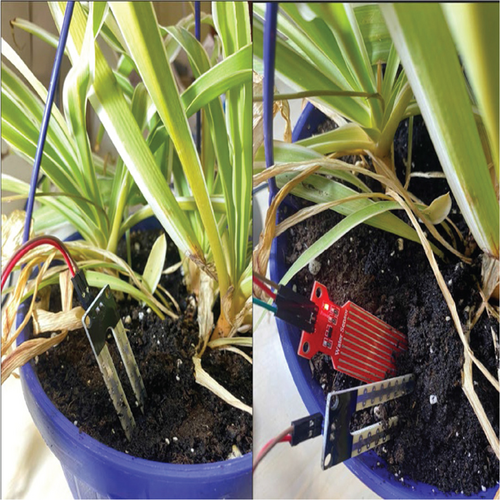
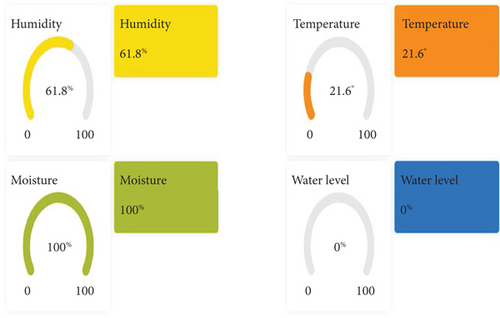
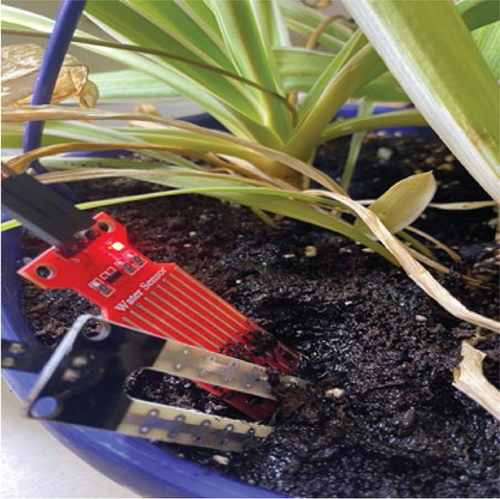
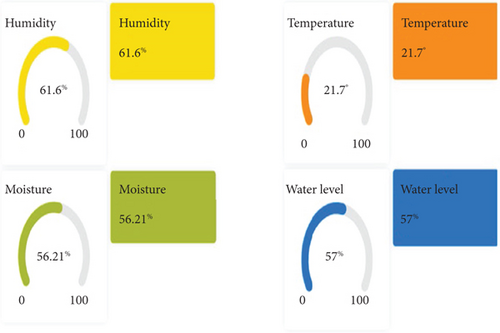
Through the readings of all the sensors on Blynk, these readings are useful for farm owners to know the soil condition and make decisions based on the sensor readings to produce good agricultural crops.
5.2.2. Dashboard Results
To guarantee reliable data collecting, processing, and real-time display, we created a full dashboard application that interfaces with Blynk and Firebase with ease. Precision agriculture depends on this connectivity to give users accurate and current information. The dashboard application starts by gathering information from temperature, humidity, water level, and soil moisture sensors on the ground. The core center for data collecting is a Raspberry Pi, which is connected to these sensors. A drone simultaneously gathers aerial data, which it transmits to the ground station. This data includes pictures and environmental readings. The dashboard application’s internal middleware capability, which connects the various parts of the system, is one of its main features. With the help of this functionality, the program may get data from the drone and the Raspberry Pi, process it as needed, and make sure that it is accurately recorded and shown in real time on all platforms. The dashboard’s middleware function communicates with the Blynk API to retrieve real-time data from the drone and sensors, which is then updated in the Firebase database. Firebase serves as the primary storage location for all gathered information, which makes it easier for the dashboard application and the Blynk interface to synchronize. This guarantees that the most recent information is displayed on both platforms. Through Blynk’s user-friendly interface, users may monitor sensor readings and other pertinent metrics by enabling Blynk to get data straight from Firebase. A comprehensive view of sensor data, drone footage, and analytical outputs like the NDVI, which is used to evaluate plant health, is provided by the dashboard application, which was created with Android Studio and Java. The middleware’s internal mechanism is always on the lookout for fresh information, so Blynk and the application are always up to date. For efficient agricultural management, this coordinated data flow is essential since it enables users to make decisions based on the most recent conditions. The middleware functionality includes error-handling algorithms that assure successful data transmission to Firebase, hence assuring data reliability. Both the dashboard and Blynk always display accurate and up-to-date information since the middleware automatically retries until the data is appropriately stored in the event of a transmission failure. Furthermore, Firebase’s offline storage and real-time database features allow for continuous data collecting even in the event of network outages. The middleware synchronizes the data after connectivity is restored, preserving the system’s continuity and integrity. By opening the application, the welcome and introductory window of “IFE- Intelligent Falcon Eyes” will appear, and then, the login window will appear as a user, as shown in Figure 18.
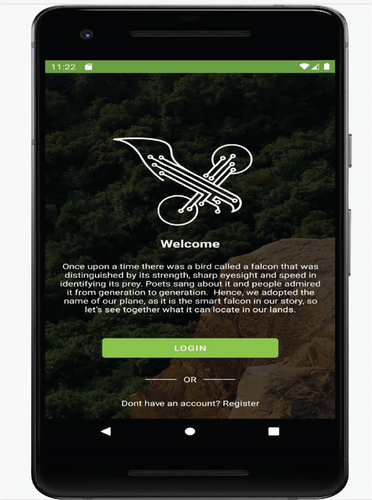

Then, we will start by selecting a new flight and writing the flight number as shown in Figure 19(a). After the drone has flown and photographed the area and captured the sensor data, the results will appear on the same selected flight. Figure 19(b) shows the results of the dashboard and is an image of the NDVI.
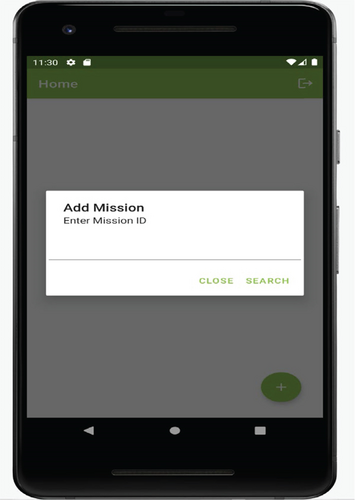
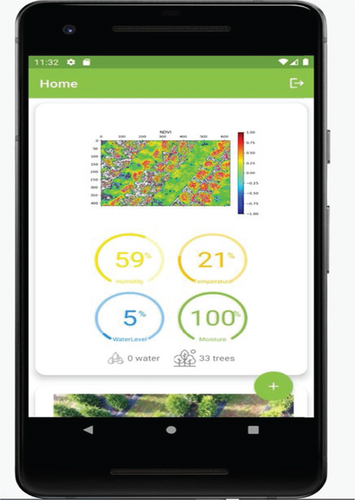
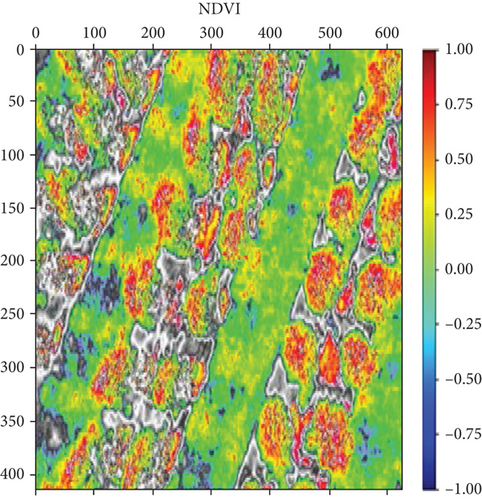
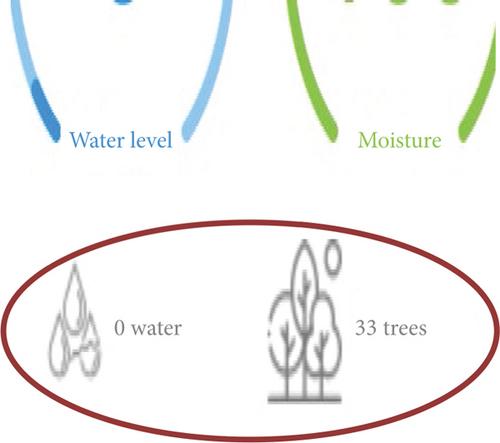
The lateral gradient in Figure 19(c) shows the NDVI measure of plant health taken from the aerial photographs of the specific flight we discussed earlier in Figure 15. Here, it shows that the plant is healthy and needs little irrigation at the present time, and this indicates that the farm runs a good agricultural system. There are light-colored areas between the trees and a slightly dry vegetation corridor that needs watering. Completely black areas appear on the grassy paths, indicating that the plant here has died and that this grass must be replaced. At the bottom of Figure 19(d), it is shown the number of trees in the area, which is 33 trees that have been monitored after the detection process, and no water spot was detected or has been monitored. And in the middle of the interface, we are shown the percentages of the ground sensors. The percentages indicate that the land was watered a short time ago. It seems to be because of the rain that the soil moisture is 100% and the temperature is 21%, which means the ground is not dry. The humidity of the air around the soil, which was monitored by the humidity sensor, was 59%, which means that the soil was irrigated a short time ago, and it also shows us the result of the water level on the surface, which was equal to 5%, which means that the soil will hold water in it for a good period of time and does not need irrigation. On this day, at least, you will continue to save water until the humidity level decreases and the water level drops to zero.
The results of our experiment showed that it was 98% accurate, and thus, our project achieved an excellent percentage as it was our first experiment.
5.3. Communication
We used an acrylic Wi-Fi analyzer in the app Acrylic Wi-Fi. It is a tool used to analyze wireless networks and improve their quality and performance. It can help identify RSSI and identify network vulnerabilities so you can fix them and improve the speed and stability of your wireless network. Figure 20(a) shows the RSSI test, which has a value of −43 dbm before flying the drone, which means that the connection to the device was strong and there is a very high speed in data transmission. In Figure 20(b), we find important information about the signal strength at this moment, as we note that the signal was very strong, and its stability was excellent before the operation of the drone flight. Figure 20(c) shows the change in RSSI when piloting a drone taking off and landing at a height of 2 m as the rate dropped to −57 dbm and then came back after the drone descended to −18 dbm, which means the signal is still very strong. Figures 20(d) and 20(e) show the signal strength and the RSSI value after the drone has flown for the mission at a height of 12 m above the surface. We note that the higher the drone is, the lower the signal strength, in addition to the RSSI. When the drone rose, the RSSI value became −76 dbm, which is not a very weak value. This means that the receiver on the drone is strong enough to receive data from ground sensors and transmit it to the ground station. In our experience, the ground station was the IFE phone application, which means that the distance between the drone and the ground station is the same as the distance between the ground sensors and the drone, because in our experience we were standing next to the sensors and the IFE application with our hands, which means that the distance from the drone to the ground station is 12 m. Figure 20(f) shows the quality of the signal in general during the experiment, which represents the yellow color in the circle, which means that it was good enough to receive data.
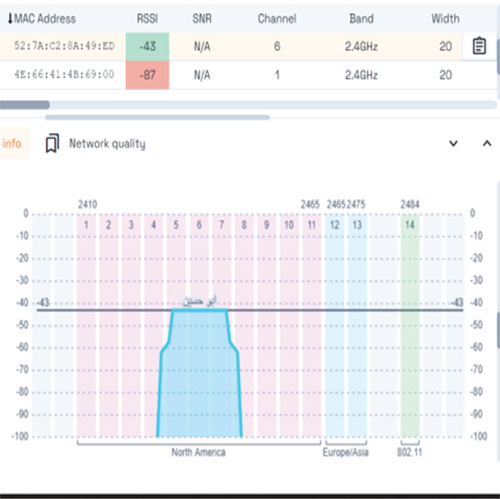
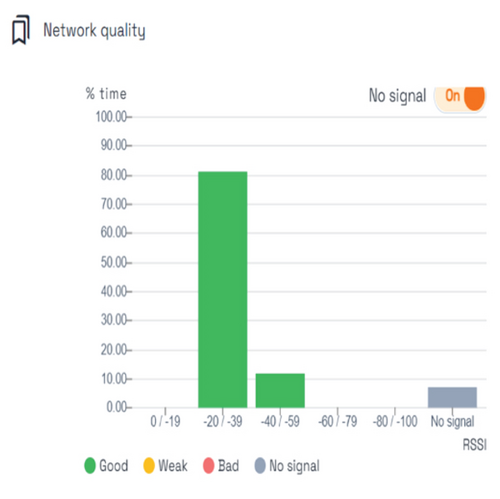
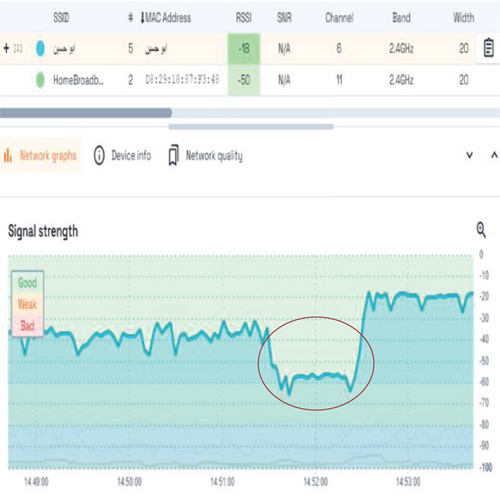
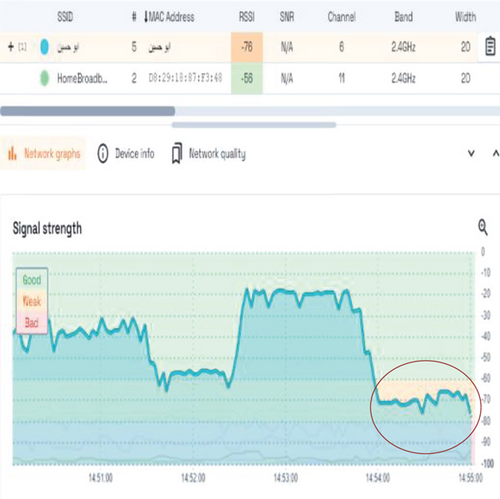
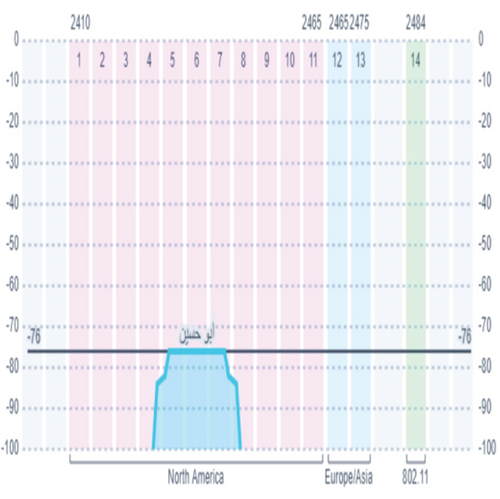
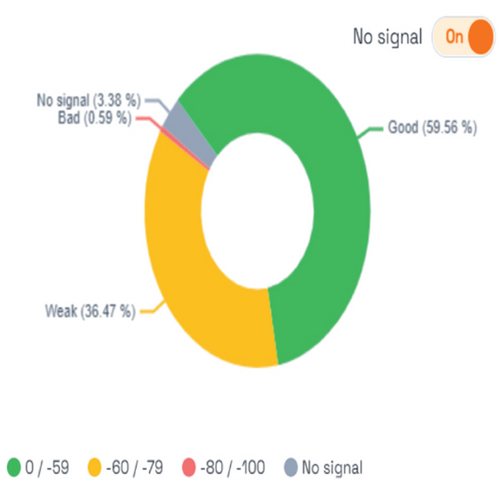
6. Conclusions
The design and development of multimission drones with dual cognitive modules is approached in a novel way by this research, greatly expanding the field of aerospace engineering with applications in smart agriculture and other areas. The suggested technology offers a workable approach to accomplishing intricate airborne operations and high precision in autonomous flight over difficult agricultural terrain. AI-driven control systems have the potential to improve the operating efficiency of UAVs due to their incorporation of deep RL, which enables the first brain to navigate in an agile and adaptable manner. This development emphasizes how autonomous systems can adapt to changing and difficult conditions, which is an important factor in aeronautical technology.
With an astounding 98% accuracy rate, the second brain, which makes use of the Faster R-CNN algorithm, demonstrates the efficacy of sophisticated machine learning approaches in crucial tasks including plant health assessment, water detection, and tree counting. This highlights the promise of UAVs in precision agriculture, where precise and rapid data collection is essential, as well as in environmental monitoring.
Furthermore, the integration of UAV systems with state-of-the-art communication technologies is demonstrated by the deployment of an IoT infrastructure in conjunction with 5G Wi-Fi technology. This configuration improves data processing and gathering efficiency and dependability, which is essential for the ongoing development of cutting-edge aeronautical systems.
The system’s versatility and scalability are highlighted by this technological fusion, which makes it a good fit for a range of aeronautical applications, from specialized agricultural missions to extensive environmental monitoring.
Future developments in UAV design, notably in the domains of autonomy, sensor integration, and AI-driven decision-making, will be built upon the development process this study presents. The system’s versatility makes it a useful tool for both agricultural and aeronautical engineers, as it may be applied in a variety of meteorological and geographical settings.
Even though the existing system shows promise, more study and improvement will be needed to increase its precision and functions. Investigating different algorithms and sensors, like hyperspectral imaging and sophisticated machine learning models, can improve the system’s capacity to carry out increasingly intricate and accurate operations. Furthermore, the system’s deployment in more expansive aerospace contexts will depend on improving its scalability and flexibility across various environmental and geographical situations.
To sum up, this study adds to the continuing development of air and space vehicle design by providing a thorough framework that combines AI, IoT, and cutting-edge aeronautical engineering concepts. The developments covered here could influence UAV technology in the future and open the door to more environmentally friendly, economical, and intelligent aerospace solutions.
Conflicts of Interest
The authors declare no conflicts of interest.
Funding
This research was funded by Taif University, Taif, Saudi Arabia (Project No. TU-DSPP-2024-139).
Acknowledgments
The authors extend their appreciation to Taif University, Saudi Arabia, for supporting this work through project number TU-DSPP-2024-139. The authors extended their thank to the students who also worked with them on this project: Taif Al-Shamrani, Kholoud Al-Thabeti, Sumaya Al-Sufyani, and Fatun Al-Obaidi. Also, the authors confirm that no AI tools have been used to prepare this manuscript.
Open Research
Data Availability Statement
The data used to support the findings of this study are available from the corresponding author upon request.


