Pore-Scale Modeling of Pressure-Driven Flow and Spontaneous Imbibition in Fracturing-Shut-In-Flowback Process of Tight Oil Reservoirs
Abstract
Tight oil reservoirs are characterized by multiple pore spaces where nano-micropores and multiscale fractures coexist, and each type of medium varies in scale, implying a tight coupling of multiscale fractures with matrix and giving rise to extremely complicated flow patterns. To further investigate its flow mechanism, we first construct three two-dimensional (2-D) fracture-pore geometry models based on microfocus computed tomography (CT) imaging of a typical tight rock. A pore-scale modeling workflow is thereafter developed using the Shan-Chen lattice Boltzmann model (SC-LBM) to simulate the pressure-driven flow and spontaneous imbibition. The influence of fracture-pore geometry on the pore-scale fluid exchange dynamics in the fracturing-shut-in-flowback process is clearly clarified. Results show that, for the porous medium model without fracture, the fracturing fluid can displace and replace some crude oil by spontaneous imbibition while a large amount of crude oil droplets remains unexploited away from the oil/water contact line, resulting in a low oil imbibition recovery. The injected fracturing fluid migrates into the deep position along the fractures, only a few entering the matrix pore space near the fractures. Small pores are the main channel for fracturing fluid to imbibe into the matrix pores, and the replaced crude oil droplets flow into fractures through large pores as intermittent or continuous pipe flow. The complexity of fracture network typically exerts a significant impact on the fluid exchange dynamics during pressure-driven flow and spontaneous imbibition. The more complex the fracture network, the larger the volume of fracturing fluid injected, the easier for oil droplets replaced from the matrix pores, and the more difficult for the flowback of fracturing fluid in the fracture-pore geometry model. Our understanding will provide a basis for explaining the underlying mechanisms of oil replacement by pressure-driven flow and spontaneous imbibition in the fracturing-shut-in-flowback process.
1. Introduction
Abundant tight oil reservoirs exist in China, with large amounts of exploration discoveries in basins such as the Ordos, Junggar, Songliao, and Bohai Bay [1, 2]. To effectively exploit these tight oil reservoirs, the use of horizontal wells combined with volume fracturing techniques has become widespread, typically treated as one of the most promising ways for effective development of this type of reservoir. Tight oil reservoirs have complex storage spaces and strong heterogeneity and consist of matrix and multiscale fractures. The matrix is mainly composed of micrometer-nanometer pores, characterized by low permeability and limited flow distance. A large number of micro-nano-scale pore throats and cracks cause hydraulic fracturing fluid to undergo infiltration, suction, and oil drainage effects under capillary force, thereby increasing oil well productivity and improving recovery rate. Except for micro-nano-scale matrix pores, various fractures including hydraulic fractures, natural fractures, and microfractures are simultaneously observed. Each type of medium varies in scale, implying a tight coupling of multiscale fractures with matrix and giving rise to extremely complicated flow patterns [3].
Previous studies [4–6] indicated that spontaneous imbibition is one of the primary underlying mechanisms for crude oil extraction in the tight oil reservoir. In recent years, a large number of researchers have adopted the development method of “horizontal well + volume fracturing + shut-in well” to develop tight oil, which involves immediately shutting down the well after volume fracturing and shutting it for a period of time before opening the well for production. This has achieved good oil increase effects and effectively reduced water production. During the volume fracturing, shut-in, and subsequent flowback process in tight oil reservoir, fracturing fluid can spontaneously imbibe into the matrix pore space from the fractures motivated by the capillary force, replacing the crude oil droplets occupied in matrix pores. The pilot practice also proves that when sufficient imbibition is achieved by shut-in, oil production of horizontal well can significantly increase. However, the underlying mechanism of pore-scale fluid exchange influenced by pressure-driven flow and spontaneous imbibition within fracture-porous medium of tight oil reservoirs remains unclear, leading to the ineffective scheme design of increasing oil production and sharp difference in individual well productivity [7–9]. It is of great importance to perform pore-scale simulation of multiphase fluid flow during the fracturing-shut-in-flowback process in tight oil reservoirs. These understandings can reveal the underlying mechanisms of pore-scale fluid exchange during pressure-driven flow and spontaneous imbibition.
Modeling pore-scale flow is a complex fluid dynamic problem involving phase interface tracking and multicomponent and multiphase transport [10, 11]. It is typically affected by various factors, such as pore structure, wettability, and fluid properties. In recent decades, several efficient methods were widely utilized for pore-scale flow simulation [12], including pore network simulation, lattice Boltzmann method (LBM), volume of fluid method (VOF), smoothed particle hydrodynamics (SPH), level set method, and phase-field method. Pore network simulation [13] has significant advantages such as repeatability, quantifiability, and high computational efficiency. The pore network models include quasistatic pore network models and dynamic pore network models. The quasistatic pore network model is a simplified form of the dynamic pore network model, primarily used to obtain the material properties of porous media, such as relative permeability and capillary pressure. Compared with quasistatic pore network models, dynamic pore network models are more complex and entail higher computational costs. However, pore network models require topological description of actual rock microstructure; it remains a great challenge to accurately extract equivalent pore network models from images of tight rock microstructure. As a mesoscale method, LBM [14, 15] directly starts from a discrete model and constructs a bridge between macroscopic and microscopic, continuous and discrete based on molecular dynamics and statistical mechanics. It is pretty efficient to handle the complicated fluid interaction and impose boundary conditions and parallel programming, which has become an effective method for solving fluid flow and heat transfer problems in porous media. Other methods such as VOF, SPH, level set, and phase-field [16] are classified into the category of direct numerical simulation (DNS) methods. They are based on discretization of multiphase Navier-Stokes (N-S) equations and coupling other partial differential equations to describe various physical and chemical phenomena occurred in porous media. The more fluid components are considered and the larger the computational domain, the more complex the pore-scale flow simulation and the more difficult in tracking fluid phase interfaces.
When using lattice Boltzmann method to solve the multiphase flow problem, four LBM calculation models are typically categorized [15]: color-gradient model, pseudopotential model, free energy model, and incompressible multiphase flow model. As the earliest model introduced, the color-gradient LBM model [17] utilized two sets of particle density distribution functions (“blue” and “red”) to represent two fluids and their flow states. The interaction between fluids is characterized by an additional collision term, making this model suitable for two-phase fluid flow with the same density ratio. The pseudopotential LBM model [18] also known as the Shan-Chen model introduced the concept of “long-range interaction potential between particles” in collision term, which represents the microscopic interactions between two-phase fluid particles and induces the formation of phase interfaces, mixing and diffusion between fluid phases. Due to its simplicity, ease of implementation, and Galilean transformation invariance, SC-LBM has become the most widely used multiphase LBM model. By introducing different equations of state (EOS) to calculate the interaction potential, the SC-LBM model can be utilized to calculate cases with density ratios higher than 1000. When the original SC-LBM method is employed to simulate two-phase fluid flow, surface tension, density ratio, and viscosity ratio are numerically calculated, but they are not independent. Sbragaglia et al. [19] pointed out that in order to estimate the interaction potential, a wider range of grid points than the adjacent ones can independently adjust surface tension and density ratio, which makes the simulated results better fit with the actual situation. The third LBM model is the free energy model, first proposed by Swift [20], and it tracks the evolution of the two-phase fluid interface by calculating the Poisson equation. Inamuro et al. [21] improved the free energy model, making it possible to calculate large density ratios. However, since it requires the calculation of the Poisson equation, it loses the original simplicity of the lattice Boltzmann method. The final type is the incompressible multiphase flow model [22], which employs two sets of particle distribution functions for calculation. One set of particle distribution function is used to invert the incompressible Navier-Stokes equations, and the other set is to invert the Cahn-Hilliard phase-field equation [23–25], which is utilized for interface tracking. The model has high accuracy, but its computational efficiency is relatively poor due to the use of complex difference scheme. It can be concluded that because of easy programming and high capacity for pore-scale simulation of multiphase fluid flow with high density ratio, the SC-LBM model has provided an effective approach to understand the underlying mechanisms of pressure-driven flow and spontaneous imbibition in the fracturing-shut-in-flowback process of tight oil reservoirs.
At present, the research pertaining to tight oil reservoirs lacks consideration for the intricacies of pressure-driven flow and spontaneous imbibition during the fracturing-shut-in-flowback process. Moreover, the models used lack typical pore-throat characteristics of tight reservoirs. To address these issues, we have conducted research at the pore-scale level. Based on high-resolution microfocus CT imaging and digital image processing of a typical tight rock, three 2-D geometric models of different fracture-pore media are firstly constructed. By considering the synergistic effects of capillary and viscous forces, a SC-LBM is then proposed for pore-scale modeling of multiphase flow in tight fracture-porous medium. After verifying the accuracy of the SC-LBM model, pore-scale simulation of pressure-driven flow and spontaneous imbibition in the fracturing-shut-in-flowback process of tight oil reservoir is conducted. The influence of fracture-pore geometry on fluid exchange dynamics caused by pressure-driven flow and spontaneous imbibition in the fracturing-shut-in-flowback process is fully studied.
2. Methodology
2.1. Fracture-Pore Geometry Model
The experimental devices [26] used for obtaining the images of rock microstructure mainly include magnetic resonance imaging (MRI), ultra-high-resolution imaging combined with focused ion beam and scanning electron microscopy (FIB-SEM), and industrial microfocus CT (micro-CT) imaging. MRI is commonly used in the medical field, but its resolution is relatively low. FIB-SEM [27–29] is a powerful technique that involves cutting ultrathin rock slices using FIB and then observing the new cutting surfaces by SEM. This process is repeated to obtain a series of 2-D slice images of the rock, which are then overlapped to establish a three-dimensional rock microstructure. It allows for acquisition of the internal 3-D micro-nano-meter pore structure of rocks with high precision. In last decades, due to its rapid development, X-ray CT imaging has been widely used to obtain the microstructure of different kinds of rocks. In contrast to FIB-SEM, the industrial microfocus CT [30–35] is a nondestructive measurement device that uses X-rays to penetrate rocks from different angles. FIB-SEM is limited to depicting small sample sections, making it difficult to accurately investigate the differently sized structures in tight rock. By using certain efficient algorithms to retrieve slice information from the density of the rock microstructure, a 3-D digital rock can be obtained by overlaying the slice images. The resolution is generally at the micrometer scale. To observe the microstructure of rocks more accurately, X-ray CT imaging technology with nanometer-level accuracy is gradually gaining attention.
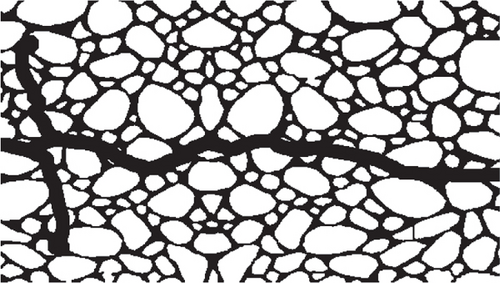
In this study, the microstructure information of a typical tight rock is obtained by the industrial microfocus CT imaging. The 2-D grayscale CT images, with a resolution at the micrometer scale, are processed using the ImageJ software. In the X-ray microfocus CT scanning experiment, there is a significant difference in the penetration ability of the pore space and rock skeleton to X-rays. The high density of the rock skeleton results in weak penetration, while low density of the pore space leads to strong penetration. Consequently, within the CT grayscale image, areas of high brightness depict the rock skeleton, whereas areas of low brightness denote the pore space. Appropriately selecting a threshold facilitates effective segmentation between the pore space and rock skeleton. This enables the binarization and threshold segmentation of the raw images, effectively dividing into fractures, pore space, and rock skeleton to obtain the fracture-pore geometry model. Based on pixel analysis of binary images, pixels within pores are designated a value of 0, while those on rock skeletons are assigned a value of 1. This binary coding effectively represents rock cores as a combination of 0 s and 1 s, forming the fundamental data used in reconstructing digital rock cores. This geometry model will be utilized for subsequent pore-scale flow simulations. The basic properties of the microfocus CT scanner used in this study are listed as follows: the sample diameter ranging from 1.0 mm to 70 mm, the voltage ranging from 40 kV to 150 kV, the scanning resolution ranging from 0.5 μm to 35 μm, and the working energy ranging from 1.0 W to 10 W. In order to systematically explore the effect of fracture network on fluid exchange caused by pressure-driven flow and spontaneous imbibition in the fracturing-shut it-flowback process of tight oil reservoirs, three representative fracture-pore geometry models are constructed here by inserting fractures of different shapes into the same matrix pore space with a resolution of 1.0 μm.
2.2. SC-LBM Computational Model
Due to its limitation in handling large density ratio problems, scholars made great effort to improve the applicability of the original SC-LBM computational model. By introducing multiple relaxation operators, using long-short range interaction potentials, and enhancing the equation of state [36–38], the single-component multiphase flow SC-LBM model was extended to high density ratio cases over 1000. Because of its origin from the traditional lattice Boltzmann equation, the SC-LBM computational model is relatively simple and easy to deal with the interaction between particles, which has a clearer physical meaning compared to the color-gradient LBM model. Therefore, we employed the SC-LBM computational model and utilized the C programming language for implementation. By simulating pressure-driven flow and spontaneous imbibition in the fracturing-shut-in-flowback process of tight oil reservoirs, we aimed to explore the dynamics of fluid exchange.
3. Model Validation
3.1. The Young-Laplace Equation
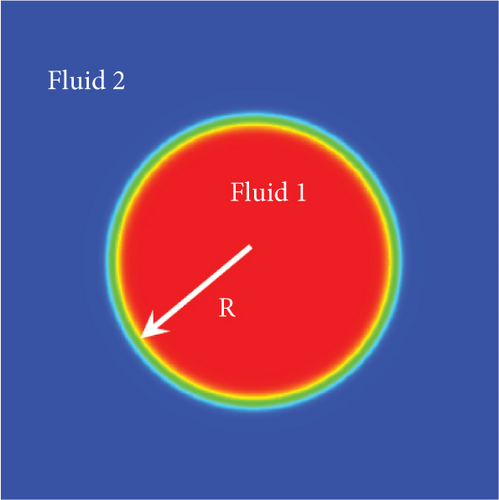
In order to simulate this two-phase system, the following parameters are defined in Table 1.
| Lattice size | 220 lu × 220 lu | Physical size | 22 mm × 22 mm |
| Kinematic viscosity 1 | 0.001 m2/s | Interface tension | 0.03 N·m-1 |
| Kinematic viscosity 2 | 0.001 m2/s | Interface thickness | 5 lu |
| Density 1 | 1000 kg/m3 | G1 | 2.0 |
| Density 2 | 50 kg/m3 | G2 | 0.6 |
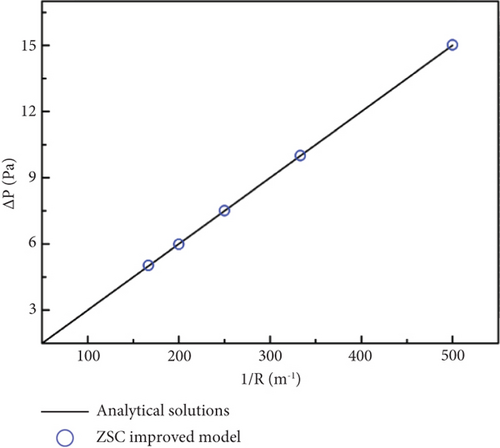
For five cases where the radius of fluid 1 changes from R = 2 mm to R = 6 mm, the SC-LBM model is applied to determine the inside and outside pressure difference of two-phase fluids at the interface, and the calculation results are shown in Figure 1(b). The analysis shows that inside and outside pressure difference ΔP follows a linear relationship with the reciprocal of the fluid 1 radius 1/R, which is highly consistent with the analytical solution of the Young-Laplace equation. This indicates that the SC-LBM model used in this study can accurately simulate the interaction between fluid phases at the interface.
3.2. Contact Angle Calculation
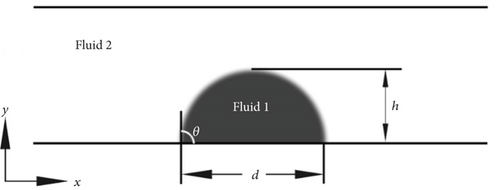
To verify the accuracy of the SC-LBM model in simulating wettability, a domain with a lattice size of 300 × 100 is established as shown in Figure 2; other parameters are shown in Table 2. Periodic boundary conditions are imposed in the x-direction, and standard bounce-back boundary conditions are applied in the y-direction. The liquid droplet (fluid 1) is initially in a semicircular shape (with a diameter of 160 lattice units), located at the center of the bottom wall and surrounded by the gas phase (fluid 2). Here, d is the maximum distance between the two ends of the droplet, h is the maximum height of the droplet, and θ is the contact angle.
| Lattice size | 300 lu × 100 lu | Physical size | 30 mm × 10 mm |
| Kinematic viscosity 1 | 1.006 × 10⁻⁶ m2/s | Interface tension | 0.072 N·m-1 |
| Kinematic viscosity 2 | 1.506 × 10⁻⁵ m2/s | Interface thickness | 3 lu |
| Density 1 | 998.2 kg/m3 | G1 | 2.0 |
| Density 2 | 1.205 kg/m3 | G2 | 0.6 |
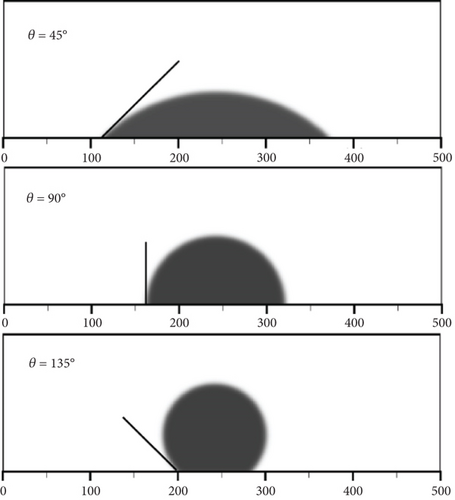
The dimensionless wetting parameter is 0.47611091, 0.0, and -0.47611091, respectively. The theoretical static contact angles of the droplet on the solid wall are 45°, 90°, and 135°, respectively. The droplet will spontaneously change from its initial state of θ = 90° to the corresponding static contact angle.
The SC-LBM model is used to simulate the different wettability of rock surface, and the results are shown in Figure 3. When the simulation becomes stable, the contact angles under three different dimensionless wettability parameters are measured to be 44.8°, 90.1°, and 134.9°, respectively. The error between the measured contact angles and the theoretically estimated values is less than 0.45%. This demonstrates that the SC-LBM calculation model can accurately simulate the contact angle of a rock surface under three different conditions: wetting, neutral wetting, and nonwetting.
3.3. Layered Two-Phase Flow between Parallel Plates
In order to verify the accuracy of the SC-LBM model in calculating fluid velocity distribution, LBM simulations were conducted and compared with analytical solutions for problem of layered two-phase flow between infinite parallel plates [40–42]. As shown in Figure 4, fluid 1 (white) is located at the center of the plate with a density of ρ1 and a dynamic viscosity of ν1, driven by the x-directional volume force F1; fluid 2 (blue) is symmetrically distributed on both sides of fluid 1, with a density of ρ2 and a dynamic viscosity of ν2, driven by the x-directional volume force F2. The distance between the two infinite parallel plates is 2H, and the coordinate of the two-phase interface position is Yi.
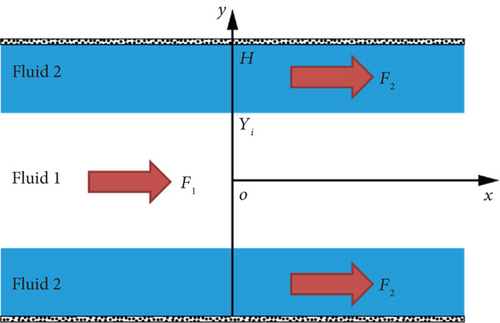
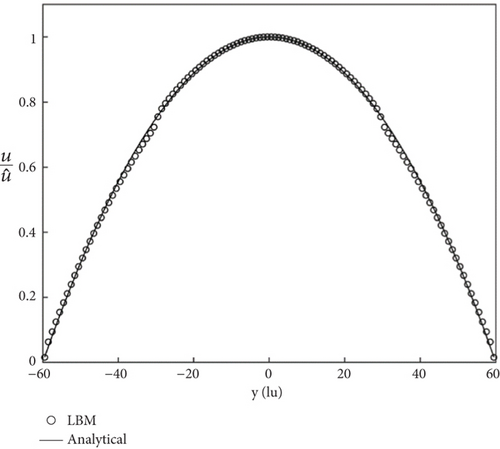
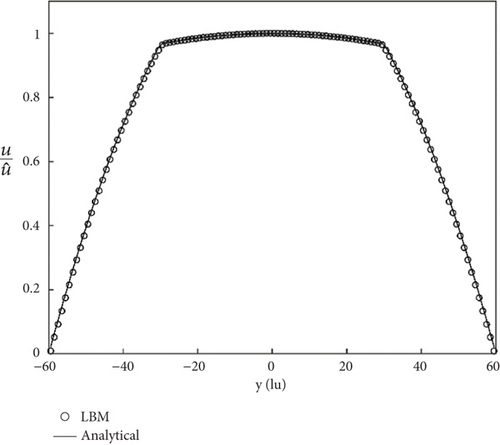
A research area with lattice units of 100 × 201 is established, corresponding to a physical fluid region of 100 mm × 200 mm. In the x-direction, periodic boundary conditions are imposed, while standard wall bounce-back boundary conditions are utilized in the y-direction. Only a volume force F1 = 15 kg·m-2·s-2 is applied to fluid 1, and F2 = 0 is applied to fluid 2. The density of fluid 1 is ρ1 = 50 kg·m-3, and the density of fluid 2 is ρ2 = 1000 kg·m-3. The kinematic viscosity of two fluids is same ν1 = ν2 = 0.01667 m2·s-1, and the interfacial tension is σ = 0.03 N·m-1. The interface thickness W is set to 5 lattice units, and the grid velocity c is c = 100 m·s-1. The calculated velocity values and theoretical values under different fluid viscosity ratios were compared and analyzed, as shown in Figure 5; it can be seen that they are in good agreement. Through various simulations, the accuracy of the SC-LBM computational model used in this paper is fully demonstrated, and it can accurately calculate key parameters such as capillary force, velocity, and contact angle.
4. Results and Discussion
During the development of tight oil reservoirs, the interaction between multiphase fluids is inevitably involved. Due to the micro-nanosize of pore throats, the capillary-driven interaction between fluid and rock wall surface cannot be ignored. Influenced by the capillary pressure, the wetting-phase fluid enters the fracture-pore geometry model and displaces the non-wetting-phase fluid; this phenomenon is known as spontaneous imbibition [43–46], which has been widely recognized as a key mechanism for oil replacement in the fracturing-shut-in-flowback process of tight oil reservoirs. In this paper, using the SC-LBM model, two-phase flow simulations are performed in the fracturing-shut-in-flowback process of tight oil reservoir in order to unveil the fluid exchange dynamics at pore scale.
4.1. Simulation of Countercurrent Imbibition
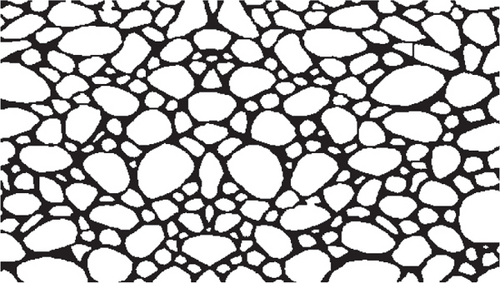
We conducted pore-scale flow simulations of countercurrent imbibition in a typical tight rock using the SC-LBM. The porous medium depicted in Figure 6(a) was chosen as the geometry model. The model parameters used for flow simulation are listed in Table 3. In the study, the tight rock wall is strongly water-wet, and the contact angle between fracturing fluid and rock wall is 10.61°. The model is initially saturated with crude oil and placed in the fracturing fluid. Activated by the capillary pressure, the wetting-phase fracturing fluid imbibes into matrix pore space from the four boundaries of top, bottom, left, and right and gradually replaces some of the crude oil. The simulation results are shown in Figure 7.

| G1 | G2 | τw | τo | ρw | ρo | β |
|---|---|---|---|---|---|---|
| 2.0 | 0.6 | 1.5 | 1.6 | 0.97 | 0.97 | -0.25 |
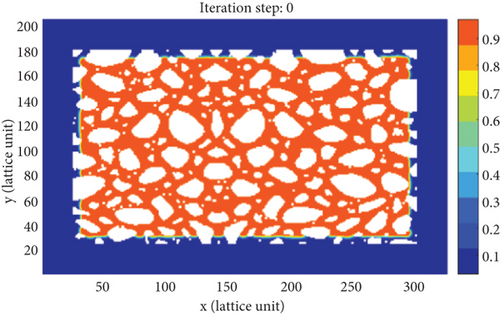
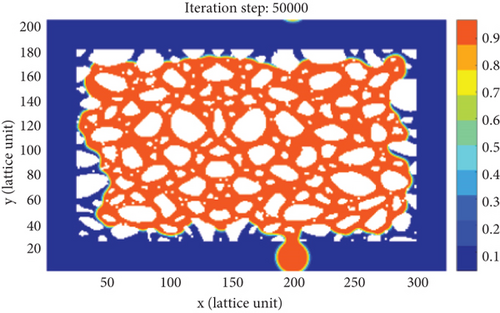
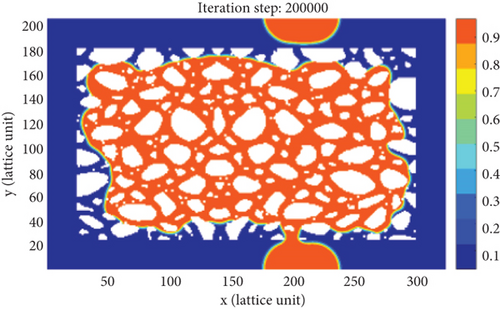
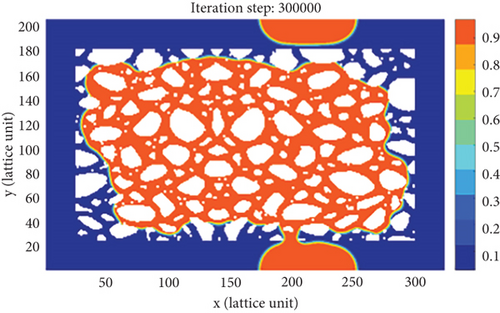
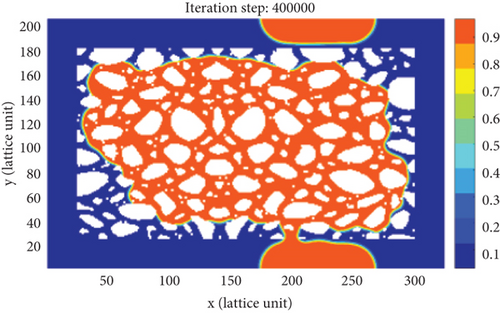
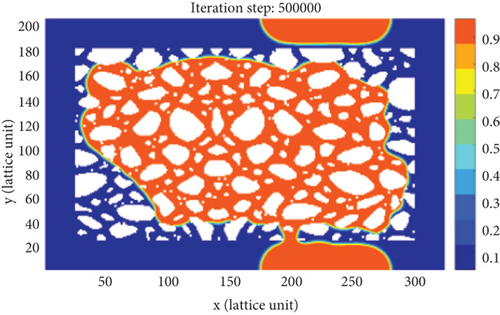
As shown in Figure 7, in the early stage of countercurrent imbibition (t = 0, 50000), the fluid pressure distribution in the tight porous medium model is extremely uneven. The smaller the pore-throat radius, the greater the capillary pressure, forming a high-pressure zone in the small pores and a low-pressure zone in the large pores. In this model, a large number of connected and complex small pores are distributed in the lower left corner, and the wetting-phase fracturing fluid preferentially enters these pore spaces through the small pores, driven by high capillary pressures, while the non-wetting-phase crude oil droplets are gradually displaced from the large pores, resulting in the formation of trapped oil droplets. As the remaining oil occupied in matrix pore spaces is continuously recovered, the trapped oil droplets attached to the wall surface of the rock gradually increase (t = 200000, 300000, and 400000). Therefore, the small pores in the high-pressure zone are the main channels for fracturing fluid to imbibe into the matrix, while the large pores in the low-pressure zone are the main channels for crude oil to be extracted. As the countercurrent imbibition process continuously proceeds, the fluid pressure distribution in matrix pore space will tend to be consistent, eventually reaching a steady state (t = 500000). When the countercurrent imbibition is ended, only the crude oil droplets reached by the fracturing fluid in the matrix pore space can be effectively recovered, and a large amount of remaining oil trapped in the middle zone of the porous medium model cannot be extracted. It implies that the countercurrent imbibition process occurred in the tight porous medium model can merely reach a very low oil recovery.
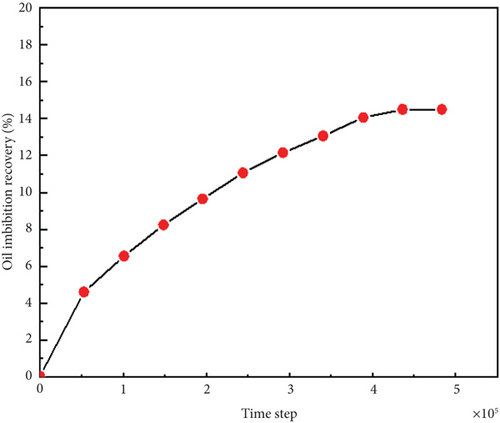
Figure 8 shows the variation of oil imbibition recovery in the tight porous medium model. It indicates that at the beginning of countercurrent imbibition, the driving force of spontaneous imbibition is largest and more oil droplets are produced, resulting in a rapid increase in oil imbibition recovery. As the process continues, the oil imbibition recovery increases gradually and ultimately reaches a stable value. It is mainly due to the nano-micro-size distribution of pores and throats that relatively short transport distances, and high flow resistances are monitored for crude oil droplets difficult to be recovered from the matrix pore space. Once the pressure difference between the wetting-phase fluid and non-wetting-phase fluid reaches equilibrium, the countercurrent imbibition process will weaken.
4.2. Simulation of Pressure-Driven Flow and Spontaneous Imbibition
To reveal the pore-scale fluid exchange dynamics in the fracturing-shut-in-flowback process of tight oil reservoirs, two fracture-pore geometry models as shown in Figures 6(b) and 6(c) are constructed, and the SC-LBM model is used to conduct pore-scale modeling of pressure-driven flow and spontaneous imbibition occurred in three different stages as follows: hydraulic fracturing, shut in, and flowback for fracturing fluid. The influence of fracture-pore geometry on pore-scale fluid exchange in the different development stages of tight oil reservoirs is further clarified. The input parameters are listed in Table 4.
| G1 | G2 | τw | τo | ρw | ρo | β | Δρ |
|---|---|---|---|---|---|---|---|
| 2.0 | 0.6 | 1.5 | 1.6 | 0.97 | 0.97 | -0.25 | 0.0485 |
In the fracturing stage, both the two fracture-pore models are initially saturated with crude oil (nonwetting phase). Driven by a constant pressure gradient, the fracturing fluid (wetting phase) is injected from the left side of the fracture-pore geometry model. In the shut-in stage, the oil-water distribution is the same as that obtained at the end of the fracturing stage. No external force is considered in the shut-in stage. The only driving force is the capillary pressure between fluid and rock wall surface, which induces spontaneous imbibition between fracture and matrix pore space. In the flowback stage, the initial fluid distribution is identical with that obtained at the end of the shut-in stage, the same pressure gradient is imposed reversely on both sides of the geometry model. Driven by the reverse pressure gradient, the remaining oil droplets occupied in the fracture-pore geometry model will be gradually recovered.
Figure 9 displays the oil-water exchange process in the pressure-driven fracturing stage of the straight-shaped and branch-shaped fracture-pore geometry models. In addition, the pressure profiles at the end of pressure-driven fracturing stage of different models can be found in Supplementary Material Figure S1. It can be seen that driven by a positive pressure gradient, the fracturing fluid mainly enters the fracture-pore model as a continuous pipe flow. The presence of fractures effectively expands the fluid flow path inside the tight matrix pore space, and the flow resistance of fracturing fluid in fractures is far less than that in the matrix pores. As a result, the injected fracturing fluid preferentially transports along the fractures towards to the deep positions of tight rock, and few fracturing fluid imbibes into the pores nearby the contact line between matrix and fractures. The more complex the fracture network is, the larger the contact area between matrix and fractures, and the greater the volume of fracturing fluid injected, the easier it is for crude oil droplets occupied in the matrix pore space flow towards the wellbore through the fractures. The results of straight-shaped fracture-pore geometry model and branch-shaped fracture-pore geometry model show that the injected fracturing fluid flows along the fracture, and only the crude oil in the fracture is displaced. Finally, cross-flow occurs in the fracture. In addition, the simulation results of branch-shaped fracture-pore geometry model show that the fracturing fluid tends to flow along the original path rather than entering the branching fractures. The outcomes from both the straight-shaped fracture-pore geometry model and the branch-shaped fracture-pore geometry model reveal a consistent pattern: the injected fracturing fluid predominantly follows the fracture, displacing only the crude oil within it. Eventually, a cross-flow phenomenon emerges within the fracture. The fracturing fluid exhibits a preference for following the original pathway instead of entering branching fractures.
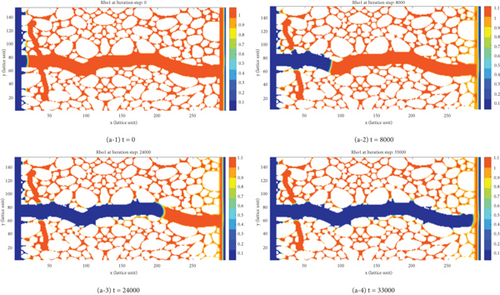
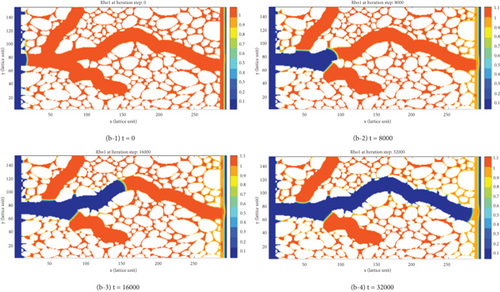
Figure 10 shows the dynamic oil saturation variation in the fracturing flow stage of different fracture-pore geometry models. It can be seen that the fracturing fluid preferentially enters the deep positions of the geometry model along the fractures, typically leading to a gradual decrease in oil saturation; the more complex the fracture network, the larger the contact area between matrix and fractures. Driven by the positive pressure gradient, the flow resistance of fracturing fluid injected inside the geometry model is smaller, and oil droplets initially occupied in the fractures are displaced into the matrix away from the injection side.
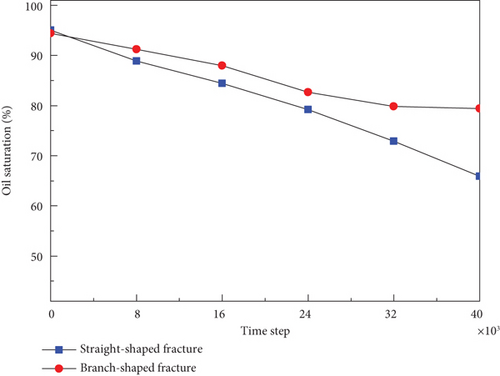
Figure 11 depicts the oil-water exchange process in the shut-in imbibition stage of the straight-shaped and branch-shaped fracture-pore geometry models. In addition, the pressure profiles at the end of shut-in imbibition stage of different models can be found in Supplementary Material Figure S2. As can be seen, at the beginning of shut-in imbibition stage, the fracturing fluid mainly spread over the fractures and the pore space nearby the matrix-fracture contact line. Controlled by nano-macrosizes of pore throats, the capillary pressure in small pores is greater, typically leading to the countercurrent imbibition process of the fracturing fluid from fractures into small pores. Capillary action serves as the primary driving force for oil droplets to migrate into the fractures. The recovered oil droplets flow into fracture through large pores, gradually accumulating into oil banks that move intermittently in fracture. The more complex the fracture network, the larger the matrix-fracture contact area, and the easier it is for the fracturing fluid to undergo countercurrent imbibition and oil replacement between fracture and matrix pores in the shut-in imbibition stage. The recovered oil droplets accumulate in fracture and flow outlet as pipe flow. In the branch-shaped fracture-pore geometry model, due to the effect of branching fractures, there are almost no trapped oil droplets, which continuously gather and flow towards large pores. During the spontaneous imbibition stage, branching fractures exert a more significant influence compared to the pressure-driven stage (Figure 11(b-4)).
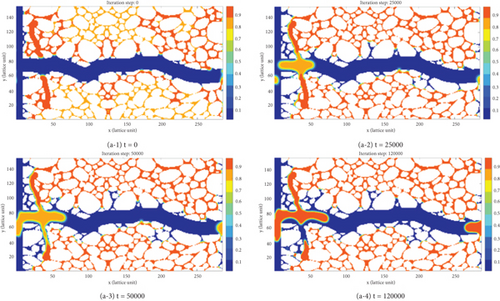
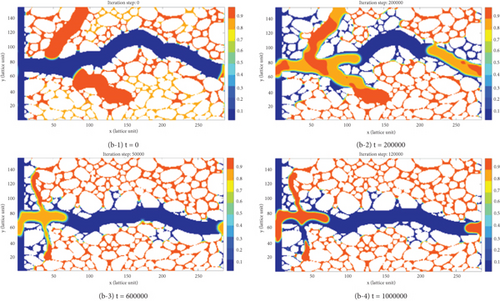
Figure 12 shows the dynamic oil saturation variation in the shut-in imbibition stage of the two fracture-pore geometry models. It can be seen that the oil saturation changes slightly in the shut-in imbibition stage. The more complex the fracture network, the larger the contact area between matrix and fractures; the more fracturing fluid can imbibe into the matrix pores driven by the capillary pressure. In addition, as the number of cracks increases within a tight rock sample, the fractal nature of pore structure will be augmented. This leads to a reduction in the scale of pore channels, thereby decreasing the flow resistance experienced by oil droplets within these pores and consequently enhancing flow efficiency. The remaining oil droplets are gradually replaced and accumulated in the fractures. However, there exists no driving force at both sides of the geometry model, so the oil droplets replaced by countercurrent imbibition continuously accumulate in the fractures.
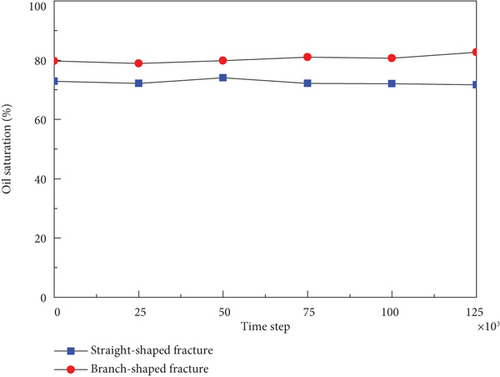
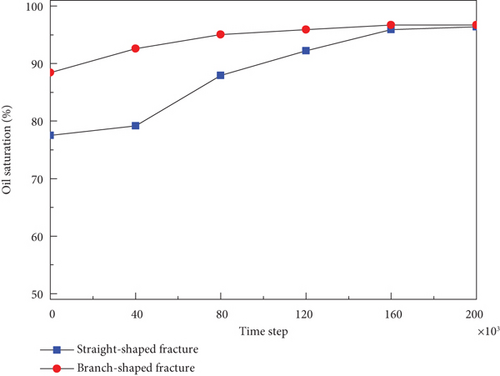
Figure 13 reflects the oil-water exchange process in the flowback production stage of the straight-shaped and branch-shaped fracture-pore geometry models. In addition, the pressure profiles at the end of flowback production stage of different models can be found in Supplementary Material Figure S3. It demonstrates that in this pressure-driven flow stage, driven by the negative pressure gradient, the oil droplets occupied in matrix pores away from the inlet position preferentially enter the fractures as continuous pipe flow, and the fracturing fluid nearby the matrix-fracture contact line is gradually back flowed. Influenced by the competition between the viscous force and capillary pressure, the more complex the fracture network, the more likely the fracturing fluid preserved inside the branch-shaped fractures and deep matrix pores is unable to flowback. In addition, the fracturing fluid is also prone to retention in the pores where the large fractures intersect with the matrix.
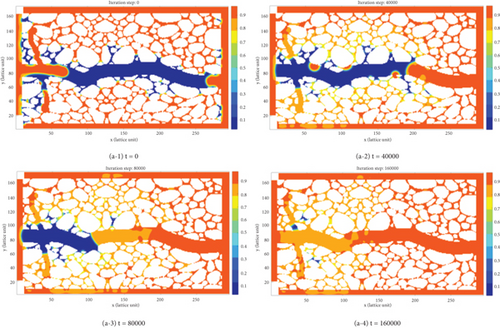
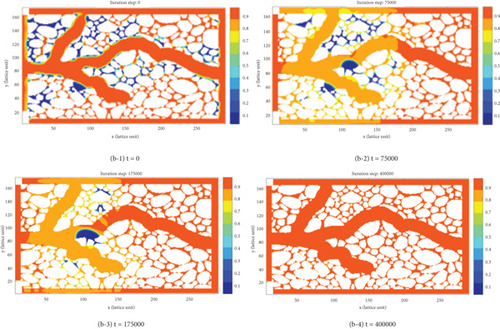
Figure 14 shows the dynamic oil saturation variation in the flowback production stage of the two fracture-pore geometry models. It can be observed that the oil saturation gradually increases in the flowback production stage. The more complex the fracture network, the higher the initial oil saturation during the flowback production stage. The main reason is that, driven the same negative pressure gradient, the crude oil droplets in the deep matrix pores are displaced by the fracturing fluid and quickly flow into the fractures as continuous pipe flow. The fracturing fluid nearby the matrix-fracture contact line is continuously displaced and produced.
5. Conclusion
- (1)
The simulated results of the proposed SC-LBM model are highly consistent with the theoretical solutions of the classical equations, which demonstrates that the SC-LBM computational model used in this study can accurately calculate key properties such as the capillary pressure, flow velocity profile, and contact angle
- (2)
For the porous medium geometry model without fracture, only the oil droplets occupied in the matrix pores swept by the fracturing fluid can be recovered by the countercurrent imbibition effect, and a large amount of crude oil droplets remain unexploited, implying a relatively low oil imbibition recovery. At the beginning of countercurrent imbibition, the oil imbibition recovery increases rapidly; as the capillary-driven imbibition continues, the oil imbibition recovery increases slowly and finally reaches a steady value
- (3)
The existence of fracture can effectively enlarge the fluid flow path in the tight matrix pore space, thus obviously reducing the fluid flow resistance. In the pressure-driven fracturing stage, the fracturing fluid mainly enters the fracture as continuous pipe flow, and few flow into the matrix pores nearby the matrix-fracture contact area. In the shut-in imbibition stage, the fracturing fluid occupied in fracture preferentially enters the small pores for countercurrent imbibition while the replaced crude oil droplets flow into the fractures through large pores and gradually accumulate into large oil banks that transport in the form of intermittent or continuous pipe flow inside the fractures. In the flowback production stage, the oil droplets trapped in the matrix pores away from the inlet preferentially enter the fractures as continuous pipe flow, and the fracturing fluid retained in matrix pores and fractures will be gradually produced
- (4)
The complexity of fracture network can exert a significant influence on the pore-scale fluid exchange by pressure-driven flow and spontaneous imbibition in the fracturing-shut-in-flowback process of tight oil reservoirs. In the pressure-driven fracturing stage, a more complex fracture network usually results in a larger volume of fracturing fluid injected. In the shut-in imbibition stage, the injected fracturing fluid can interact with more oil droplets trapped in the matrix pores, and the recovered oil droplets gradually accumulate and flow into the wellbore as pipe flow. In the flowback production stage, the fracturing fluid occupied in the branch-shaped fractures and matrix pores tends to be retained and is difficult for flowback
- (5)
There are some limitations to our study. First, the traditional filtering methods and image segmentation methods used in this study to process micro-CT images with strong heterogeneity have limitations. In addition, the association of grayscale information with mineral components remains unresolved. Second, our use of a two-dimensional geometric model necessitates the development of a three-dimensional counterpart for future simulations and analysis
Conflicts of Interest
The authors declare that there are no conflicts of interest.
Acknowledgments
The authors are very grateful to the Research Institute of Petroleum Exploration and Development, PetroChina, for allowing the publication of this paper. This research is funded by the National Natural Science Foundation of China (No. 52174043 and U22B6005), the CNPC Innovation Foundation (No. 2022DQ02-0208), the Beijing Natural Science Foundation (No. 3242019), and the Prospective and Fundamental Science and Technology Project of PetroChina.
Open Research
Data Availability
The data used to support the findings of this study are included within the article.


