Pore Evolution Law and Gas Migration Characteristics of Acidified Anthracite in Liquid CO2-ECBM: An Experimental Study
Abstract
The high gas pressure, low permeability, and strong gas absorption of coal seams in China complicate gas extraction, severely restricting the efficient development of coalbed gas. Liquid CO2 (LCO2) has a dual effect of cracking and enhancing the permeability of coal rock, thus, enhancing gas recovery. In this study, experimental testing and comparative analyses were performed to analyze the LCO2 acidification of antireflection coal, for which reference and variable experimental groups were designed. The acidification effect was quantitatively analyzed by examining changes in the pH value of the reaction solution, mineral content of coal, and pore structure during the experimental process. The experimental results indicated that a higher pressure resulted in a greater amount of CO2 being dissolved and a stronger acidity of the reaction water sample. As the reaction time increased, the minerals in the coal gradually dissolved and more H+ ions in the solution were consumed. The calcite (carbonate) and illite (clay mineral) contents significantly decreased, which is the main reason for the change of coal pore structure. The minerals on the pore surface of coal react with (CO2–H2O) weak acid, which increases the development of pore branches, improves the complexity of coal pores, and roughens the pore surface. Acidification significantly increases the number of micropores (<10 nm) and small pores (10–100 nm) in coal; furthermore, pore development is simple, the surface is smooth, and the pore connectivity is improved, which makes this part of pores have fractal characteristics. CO2–H2O–coal acidification increases the pore volume corresponding to the CO2/CH4 gas slippage flow in coal and strengthens the mass and energy transfer of CO2/CH4 in coal. CO2 can enter more pores than CH4 and displace the adsorbed and free CH4 in the pores.
1. Introduction
China has an abundance of coal and coalbed methane (mine gas) resources. According to statistics, China’s geological resources of shallow coalbed gas buried 2000 m deep are approximately 30.05 × 10¹² m3 in size, whereas as the recoverable resources are 12.50 × 10¹² m3. The coalbed methane geological resources that are buried at depths of greater than 2000 m are approximately 40.71 × 10¹² m3 in size, whereas the recoverable resources are 10.01 × 10¹² m3 [1, 2]. According to an analysis by the BP Energy Company, China’s external dependence on natural gas will continue to increase over the next 15 years, reaching 42% in 2020 and 55% in 2035 [3], significantly threatening the national strategic security of natural gas. Therefore, the efficient development of coalbed methane is a reliable means of ensuring the strategic security of national energy, while considering “three kills with one stone”, which is not only conducive to the safe production of coal mines and decreased coal mine gas accidents, but also to optimize the energy structure, supplement clean energy, and reduce carbon emissions by promoting peak carbon neutrality [4, 5].
Gas extraction is the most fundamental measure used to prevent gas disasters [6]. However, China’s coal field geological conditions are complex, with 95% of the total coal production obtained from underground mining at a depth of 500–1000 m, where the coal seam gas pressure is high, the permeability is low, gas absorption is strong, and gas extraction is significantly difficult. Most coal seams, such as the Huainan coalfield, have permeabilities ranging from 0.1 × 10⁻¹⁸ to 1.0 × 10⁻¹⁸ m2, which are four and three orders of magnitude lower than those in the United States and Australia, respectively [7–10]. Therefore, coalbed methane must be prepumped, which is mainly divided into the following two types of processes: (1) The pressure gradient naturally generated between the underground coal seam and atmosphere is used to drive the CH4 flow in the coal seam; however, this is only a portion of the initial gas, which is usually between 20% and 60% [11]. (2) The second type of process utilizes permeability increasing coal seam and gas drainage technology. Scholars have recently developed various coal seam permeability-enhancement and gas drainage technologies, mainly including protective layer mining [12, 13], hydraulic fracturing [14, 15], hydraulic slotting [16, 17], presplit blasting [18, 19], shock wave fracturing [20], liquid CO2 (LCO2) blasting [21, 22], and other pore fracture reconstruction technologies, as well as heat injection [23], microwave [24], displacement desorption (CO2 and N2) [25, 26], and other gas-enhanced desorption technologies, which effectively improve the extraction efficiency of coalbed methane. Among these, CO2 has the dual effect of cracking and enhancing the permeability of the coal seam, thus, strengthening the desorption of gas. The coal seam is not only a source but a reservoir of gas, which is mainly stored in the coal matrix via adsorption. Based on the occurrence of coal seam gas and referring to the fracture reflection enhancement and oil displacement technologies used in the industry [27, 28], the “LCO2 cracking coal and phase-change displacement CH4 technology of the coal seam” is proposed. Six functions including pressure cracking, low temperature impact, physical and chemical extraction, phase-change supercharging, low-viscosity permeability, and displacement desorption are summarized and have been applied in field engineering, achieving remarkable results [29–31]. Under the combined action of the LCO2 transfer-pump and phase-change pressures (0–40 MPa), new pore cracks or repore cracks are generated, changing the permeability of the coal seam. Studies have shown that the initiation pressure of LCO2 is 15%–35% lower than that of hydraulic fracturing [32]. The temperature of LCO2 (−35°C) is lower than that of the coal seam, which causes coal body damage and strengthens its permeability. In addition, low temperatures increase the strength of coal, making it more prone to damage. After LCO2 treatment, the average increments in the total pore volume, total pore area, and average pore diameter of the coal samples were 18.60%, 3.24%, and 29.90%, respectively. The increase in the specific surface area and pore volume of the porous pores was higher than that of the adsorption pores, and the seepage capacity of the pores increased [33]. LCO2 is a nonpolar solvent that can extract organic matter (ethers, esters, lactones, and epoxides) from coal [34, 35]. Compared with hydraulic fracturing, the LCO2 viscosity (10%–16% of water) and surface tension are low, it is easier to connect the microcracks in the coal seam, and easier to penetrate and spread around the coal seam [36]. Heat-exchange occurs between the LCO2 and coal in the pores and cracks, LCO2 phase-transition vaporizes, and the gas pressure in the pores and cracks increases, which effectively improves the percolation power in coal cracks and increases the “driving” effect of free CH4 [21]. The LCO2 in the pore fractures is transformed into a high concentration of gaseous CO2, which diffuses into the coal matrix under the action of a concentration gradient and replaces the adsorbed CH4 on the surface of the coal seam with its strong adsorption capacity [37, 38]. In terms of CO2 storage, the supercritical CO2 (scCO2)–H2O–coal geochemical reaction system in coal reservoirs has attracted the attention of many scholars. From the migration of major elements and trace elements, the minerals in coal have undergone geochemical changes [39, 40]. The dissolution of carbonate minerals was found by scanning electron microscopy, which led to the opening and connectivity of fractures [41]. The dissolution of minerals in coal occurs in a short time after scCO2 injection, and the precipitation is the long-term effect of scCO2–H2O–minerals, which is similar to the process of CO2 deep brine reservoir storage [42]. Many simulation and experimental studies have found that in the process of CO2 storage in deep brine reservoirs, minerals mainly undergo three changes: mineral dissolution [42], conversion of clay minerals [43], and formation of new minerals [44]. However, in terms of CO2-enhanced coal bed methane recovery (ECBM), studies regarding the acidification and corrosion of LCO2 are limited.
In summary, a comparative experiment of LCO2 acidification was designed in this study to quantitatively investigate the effect of LCO2 acidification on antireflection coal by analyzing the pH value of the aqueous solution, changes in the mineral content of coal, and changes in the pore structure.
2. Analysis of Acidification Mechanism of LCO2
LCO2 undergoes a phase change and dissolves in water to form an acidic fluid. Chemical reactions occur between the minerals in the coal and the acidic fluid, causing the minerals to detach from the coal, which increases the development of pores and fissures. The evolution mechanism of the mineral components in the process of the LCO2 acidification of coal was analyzed as follows:
2.1. Mineral Dissolution
2.1.1. Clay Minerals
2.1.2. Carbonate
2.1.3. Quartz
2.2. Mineral Conversion and Precipitation
2.3. Hydration Expansion of Minerals
During LCO2 acidification, in addition to the clay minerals (kaolinite, montmorillonite, and illite) in the coal dissolving, transforming, and precipitating, they also absorb water and expand, and their water stability is generally poor. Therefore, the structural stability of clay will decline owing to the expansion of its minerals when in contact with water, resulting in clay detaching from the pores and dissolving.
2.4. Mechanical Migration of Minerals
The mechanical migration of minerals during LCO2 acidification mainly includes the dissolution of mineral particles from the coal pores and cracks or the entry of external particles into the pores and cracks under corrosion, transformation, precipitation, and multifactor collapse.
3. Materials and Methods
3.1. Coal Sample Preparation
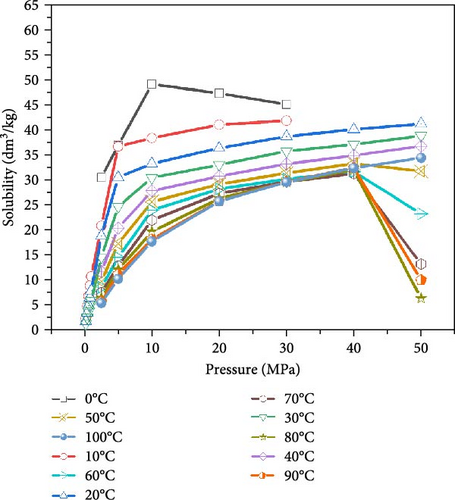
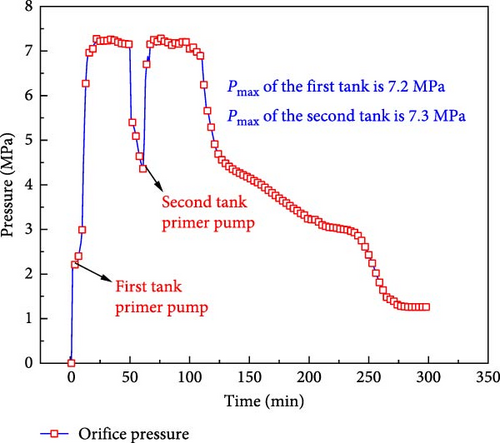
After LCO2 is injected into the coal seam, the phase change increases the pressure in the coal and promotes the dissolution of CO2 in water, as shown in Figure 1. The industrial field test demonstrated that the injection pressure of the coal seam ranged from 2 to 7 MPa, as shown in Figure 2. Large coal samples were selected from the 15 coal seam (anthracite) working face. The industrial analysis of the coal samples was conducted according to the GB/T212-2008 “ Industrial analysis method of coal ”, as shown in Table 1.
| Coal sample | Mad % | Aad % | Vad % | FCad % |
|---|---|---|---|---|
| Anthracite | 0.73 | 6.37 | 8.45 | 84.45 |
- Abbreviations: Aad, ash; FCad, fixed carbon; Mad, moisture; Vad, volatile.
Large coal samples were screened, the surface oxide layer was removed, and 1200 g of 200-mesh coal samples were crushed and screened, placed in a vacuum drying oven, and dried at 45°C for 48 h. The dried coal samples were divided into four groups (200 g each). As shown in Table 2, one was considered as the raw coal sample (WY-0), and the other three (WY-1, WY-3, and WY-5) underwent LCO2 acidification according to the drilling pressure range shown in Figure 1. The pore structure and mineral composition of the coal samples were tested based on the aforementioned.
| Coal sample | Numbering | Pretreatment | Water–coal ratio (mL:g) | External environment (MPa, °C) | Handling time (day) |
|---|---|---|---|---|---|
| Anthracite | WY-0 | Water | 1000:200 | 0.1, 25 | 10 |
| WY-1 | Water + CO2 | 1000:200 | 1, 25 | ||
| WY-3 | Water + CO2 | 1000:200 | 3, 25 | ||
| WY-5 | Water + CO2 | 1000:200 | 5, 25 |
- Abbreviation: LCO2, liquid CO2.
3.2. Experimental Installation
The experimental platform was primarily composed of the following (Figure 3): LCO2 dewar bottle: The tank has a liquid-phase and gas-phase inlet and outlet, which can stably provide liquid and gaseous CO2. The effective volume was 175 L, rated maximum working pressure was 2 MPa, and actual maximum working pressure was 2.2 MPa. Plunger pump: The CO2 gas–liquid two-phase plunger pump used in this experiment was powered by an air compressor with a rated maximum working pressure of 10 MPa. The output pressure of the liquid/gaseous CO2 is proportional to the output air pressure of the air compressor; thus, the corresponding pressure of the pressurized CO2 can be obtained by controlling the output pressure of the air compressor. Air compressor: This was used to provide the driving force for the plunger pump, which utilized a 70-L gas storage tank, 1.5-kW power, 0.8-MPa exhaust pressure, and 240-L/min maximum air supply flow. Vacuum pump: A single suction electric vacuum pump was used, and the ultimate pressure was 1.33 × 10⁻³ Pa. Pressure reactor: The tank body was composed of 304 stainless steel, with an effective volume of 4.5 L and designed pressure of 15 MPa. Water bath heating system: It was mainly composed of a water bath, temperature controller, and heating rod; the maximum heating temperature was 100°C, and the temperature controller had an automatic constant temperature function. Pressure pipeline: Mainly composed of pressure-resistant rubber and is 11 m long with a maximum pressure of 10 MPa; the pipeline is equipped with a ball valve to control the flow of the inlet and outlet liquid and maintain pressure. Temperature and pressure acquisition device: Consisted of a threaded pressure transmitter, maximum detection pressure of 10 MPa, threaded temperature sensor, and detection range of −200 to 200°C.
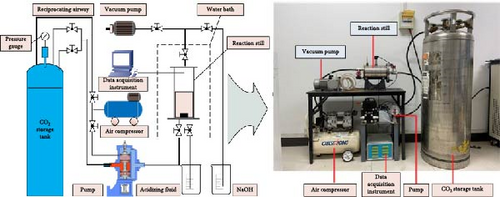
3.3. Experimental Process
- 1.
The experimental coal sample absorbs water during dissolution treatment, resulting in reduced water in the container. Therefore, before the experiment, the coal sample was sprayed with deionized water to moisten it, which was prepared using an ultrapure water mechanism. An 800-mesh nylon net was used to filter free water in the coal powder.
- 2.
Deionised water was placed in the reactor; 1000 mL of water was used for a single experiment. The high-pressure reaction tank was placed into the sink and the water temperature was set at 25°C. The experiment began when the temperature of the deionized water in the container increased to 25°C based on the sensor.
- 3.
The prepared anthracite and long-flame coal (200 g each) were first placed in an 800-mesh nylon bag, then into the tank body, and the high-pressure container was subsequently sealed via the flange.
- 4.
The vacuum pump was adjusted to −0.9 MPa to drain the air, followed by opening the CO2 dewar bottle, and the plunger pump was used to load pressures of 1, 3, and 5 MPa. The pressure change was observed every 12 h, and the pressure was compensated in case of air leakage.
- 5.
Each group was maintained under pressure for 10 days, and the pH values of the water samples were measured every 2 days. During the measurement, the pressure-relief valve of the reactor was first opened slowly, and the outlet valve was opened after the pressure was released. After each measurement, high-pressure gaseous CO2 was added to maintain the original pressure inside the container. After holding the pressure, the samples were used to test the pore structure and mineral content.
3.4. Testing Method
The pH value of the reaction water sample. After the reaction water sample was filtered by qualitative filter paper, it was tested by pH detector.
Relative content of minerals. Coal samples were scanned by type ADVANCE V8 X-ray diffractometer. The diffraction pattern was analyzed by jade 6.5 software, and the mineral species in coal were qualitatively and quantitatively analyzed based on the pattern.
Pore structure. ASAP2020M automatic solid medium pore size, pore specific surface area, and porosity analyzer was used to quantitatively analyze the changes of pore characteristics characterization parameters of coal samples.
4. Analysis of Experimental Results
4.1. pH Value of the Reaction Water Sample During CO2 Injection
The conversion of the LCO2 phase to gas absorbs a large amount of heat energy, which reduces the ambient temperature around the coal seam and increases the ambient pressure. According to Henry’s law, “at a given temperature and pressure, the solubility of a gas in a liquid is proportional to its equilibrium pressure.” Therefore, the solubility of gaseous CO2 will vary under different pressure and temperature conditions, leading to the content of carbonic acid dissolving in water, and the content of ionized H+ of carbonic acid will also be significantly different. Figure 4 presents the change in the pH values of the water sample during the interaction of CO2–H2O–coal, demonstrating that the pH value of anthracite ranges from 7.18 to 7.62 during the acidification test and pressure holding. The soaking water samples of the anthracite control group (atmospheric pressure without CO2) demonstrated a weak alkalinity, indicating that there were numerous alkaline ions in the coal body; therefore, the coal seam water would theoretically present a weak alkalinity.
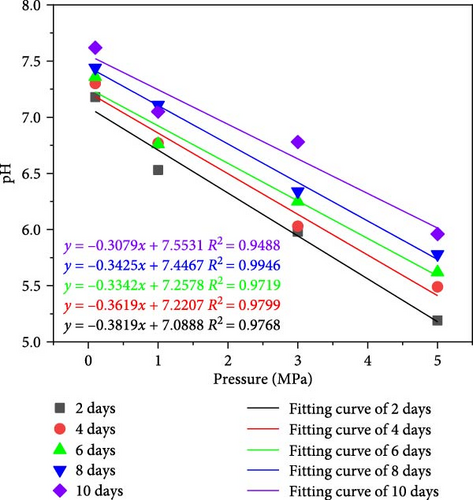
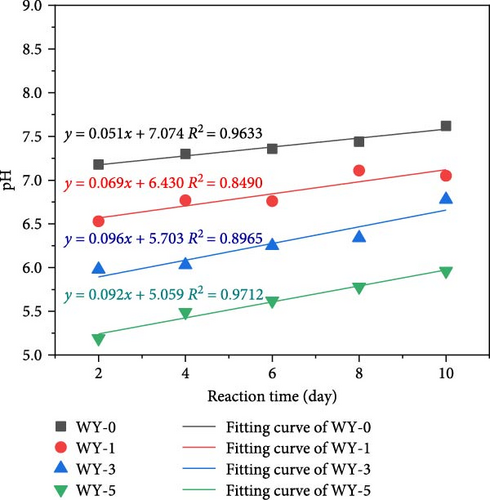
It can be seen from Figure 4a, as the pressure increases, the dissolved amount of CO2 increases, the H+ in the solution increases, and the pH value of the aqueous solution linearly decreases, indicating that the greater the pressure, the stronger the acidity of the aqueous solution. The pH decay rates corresponding to the reaction time 2, 4, 6, 8, and 10 days were 0.3819, 0.3619, 0.3342, 0.3425, and 0.3079, respectively. With the extension of reaction time, the decay rate of pH value of aqueous solution decreases. It can be seen from Figure 4b that with the extension of reaction time, the pH value of aqueous solution corresponding to WY-0, WY-1, WY-3, and WY-5 showed a linear growth trend, and the growth rates were 0.051, 0.069, 0.096, and 0.092, respectively, indicating that the longer the reaction time, the greater the consumption of H+ in aqueous solution and the more minerals involved in the chemical reaction.
4.2. Mineral Relative Amount Changes in Coal Before and After Acidification
An ADVANCE V8 X-ray diffractometer was used to test the mineral relative amount of the coal samples before and after LCO2 acidification. The conditions included a 2θ scanning range of 10°−90°, scanning step length of 0.02, and scanning frequency of 8°/min. The atlas data were imported into jade 6.5 software for the phase retrieval and quantitative analysis of the X-ray diffraction (XRD) patterns, and the mineral components and content of the coal samples were obtained (Figure 5).
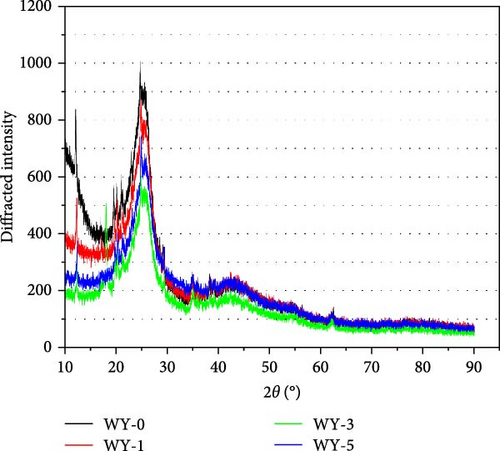
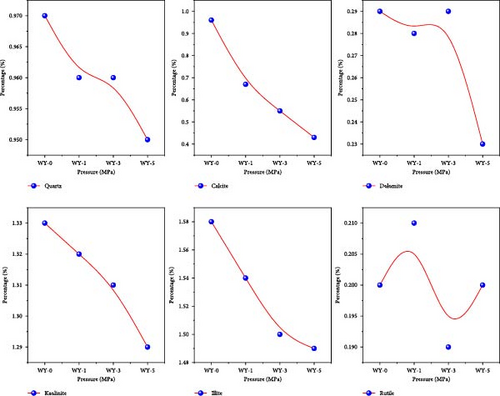
According to the mineral relative amount analysis of each component demonstrated by the XRD pattern, the minerals in the anthracite were mainly polar minerals, including kaolin, illite, calcite, dolomite, quartz, and a small amount of rutile (Table 3). The changes in the mineral relative amount of the coal before and after acidification are shown in Figure 6. Compared with the reference group, the relative amount of quartz changes by 0.02%, which may be caused by the experimental detection error. Quartz cannot be dissolved in acid, which is due to the fact that the cation cannot approach the surface of quartz [48]. John, David, and Marjorie [49] studied the reaction between quartz and CO2 at 200°C and 20 MPa, and found that quartz could not be corroded by CO2. The relative variation of kaolinite is 0.04%, indicating that kaolinite is relatively stable in acidic solution. This is due to the fact that the particle size of kaolinite is less than 1 mm, the crystal is very small and dense [50], and the ion exchange capacity is poor [51]. Tang et al. [52] studied the chemical behavior of kaolinite in acid and found that kaolinite is stable in acid solution because kaolinite is formed in acidic medium.
| Coal sample | Nonpolar minerals | Polar mineral | Total content change | ||||||||||||
|---|---|---|---|---|---|---|---|---|---|---|---|---|---|---|---|
| Silicate | Content changes | Silicate | Carbonate | Clay mineral | Sulfide | Oxide | Content changes | ||||||||
| Pyrophyllite | Total content | Amplification | Quartz | Potash feldspar | Calcite | Dolomite | Kaolinite | Illite | Pyrite | Rutile | Total content | Amplification | Total proportion | Total increase | |
| Raw coal | — | — | — | 0.97 | — | 1.08 | 0.32 | 1.35 | 1.69 | — | 0.21 | 5.63 | — | 5.63 | — |
| WY-0 | — | — | — | 0.97 | — | 0.96 | 0.29 | 1.33 | 1.58 | — | 0.20 | 5.33 | 0 | 5.33 | 0 |
| WY-1 | — | — | — | 0.96 | — | 0.67 | 0.28 | 1.32 | 1.54 | — | 0.21 | 4.91 | −0.42 | 4.91 | −0.42 |
| WY-3 | — | — | — | 0.96 | — | 0.55 | 0.29 | 1.31 | 1.50 | — | 0.19 | 4.74 | −0.59 | 4.74 | −0.59 |
| WY-5 | — | — | — | 0.95 | — | 0.43 | 0.23 | 1.29 | 1.49 | — | 0.20 | 4.49 | −0.84 | 4.49 | −0.84 |
- Abbreviation: LCO2, liquid CO2.
The relative amount of calcite (carbonate) and illite (clay minerals) decreased significantly after acidification. The relative amount of dolomite (carbonate) and rutile (oxide) changes unevenly, and the decrease was not significant. This is because rutile has a stable chemical structure, which makes it difficult to react with weak acids at low temperatures. Therefore, the acidification chemical reaction of calcite and illite is the main reason for the change of coal pore structure.
4.3. Pore Isothermal Adsorption Characteristic Curve of the Coal Sample Before and After LCO2 Acidification
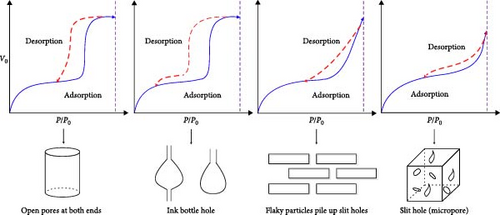
International union of pure and applied chemistry (IUPAC) proposed dividing the pores into four types: H1, H2, H3, and H4 (Figure 7) [53]. The desorption curves of anthracite coal all rapidly declined at first as the relative pressure decreased, and then tended to be stable, similar to the H4-type pore; namely, the main hole is that which is gas-tight with one end closed, as shown in Figure 8. In addition, the adsorption and desorption curves of anthracite did not have closed points, and the inflection point was not apparent. This is mainly owing to the fact that the increased coal metamorphism results in a significant improvement in the directional arrangement and anisotropy of the coal molecules, as well as the appearance of slit-shaped pores that are the main reason for the easy adsorption and difficult desorption of nitrogen.

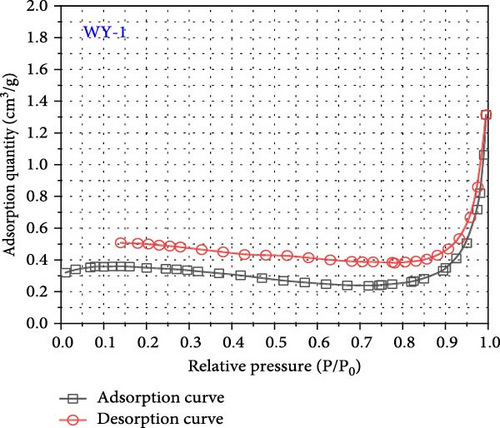
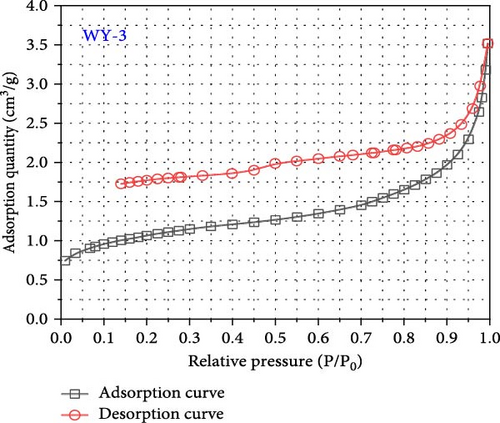
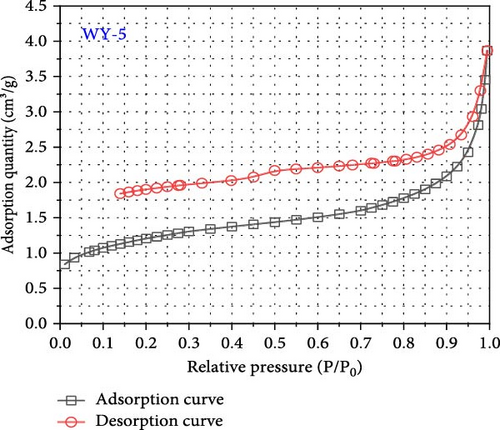
As shown in Figure 8, the maximum nitrogen adsorption capacity of anthracite (WY-0) in the reference group 1.44 cm3/g, whereas those of the coal samples treated with gas injection pressures of 1 MPa (WY-1), 3 MPa (WY-3), and 5 MPa (WY-5) for acidification are 1.31, 3.52, and 3.87 cm3/g, respectively, which were 0.91, 2.44, and 2.69 times, respectively, higher than those of the reference group. Therefore, the antireflection effect of anthracite at 3 and 5 MPa was more evident, indicating that acidification increased the development and number of coal pores.
4.4. Analysis of Pore Size-Specific Surface Area of Coal Before and After LCO2 Acidification
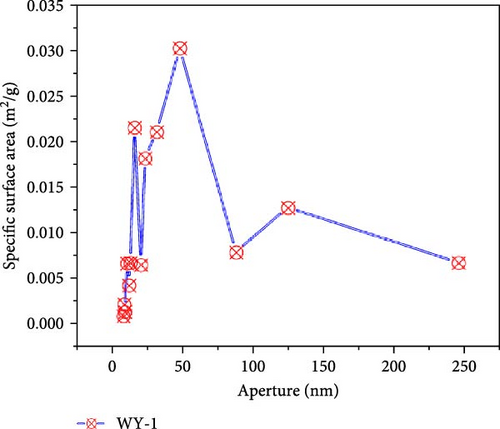
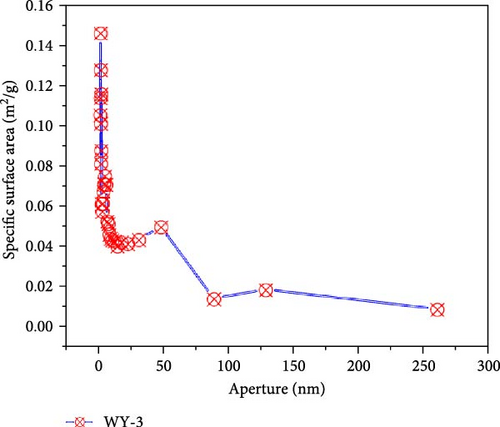
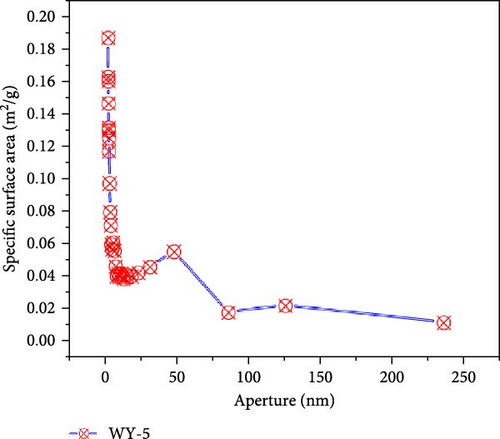
Figure 9 presents the distribution of the pore size-specific surface area of the anthracite before and after LCO2 acidification. It can be seen from Figure 10a that the pore-specific surface area distribution of coal samples in the reference group is mainly concentrated in <10 nm, the maximum specific surface area is near 0.0303 m2/g, and the total specific surface area is 0.1513 m2/g. For the WY-1 coal body, the distribution of the pore-specific surface area remained to be mainly concentrated between 10 and 100 nm, the maximum specific surface area was near 0.0303 m2/g, and the total specific surface area was 0.1464 m2/g, which is 3.35% lower than that of the reference group. The distributions of the WY-3 and WY-5 coal bodies were mainly concentrated below 10 nm, and the pore specific surface area was greater than 0.03 m2/g; the total specific surface areas were 1.8730 and 2.1666 m2/g, respectively, which were 12.38 and 14.32 times, respectively, higher than the reference group. To analyze the changes in the pore-specific surface area in different pore size ranges before and after LCO2 acidification, the pores were classified into ultrafine pores (<2 nm), micropores (2–10 nm), small pores (10–100 nm), medium pores (100–1000 nm), large pores (1000–10,000 nm), and microcracks (>10,000 nm) [54]; the results are presented in Table 4. Compared with the reference group, the specific surface area of the WY-1 coal sample decreased in the pore size range of <10 nm, whereas those of the WY-3 and WY-5 coal samples significantly increased. For the pore size ranges of 10–100 nm, the pore-specific surface areas of the WY-1, WY-3, and WY-5 coal samples increased, among which those of WY-3 and WY-5 increased the most significantly; however, the increase was notably smaller than that in the range of the <10 nm pore size. In summary, the specific surface area of the micropores significantly increased after acidification, pore development was simple, and the surface was smooth (Section 3.4.1), demonstrating a good absorption and storage.


| Coal samples | Pore specific surface area (m2/g) | Total specific surface area (m2/g) | |||||
|---|---|---|---|---|---|---|---|
| <10 nm | Increment | 10–100 nm | Increment | >100 nm | Increment | ||
| WY-0 | 0.0331 | — | 0.0952 | — | 0.0230 | — | 0.1513 |
| WY-1 | 0.0042 | −0.0289 | 0.1228 | +0.0276 | 0.0194 | −0.0036 | 0.1464 |
| WY-3 | 1.5329 | +1.4998 | 0.3137 | +0.2185 | 0.0264 | +0.0034 | 1.8730 |
| WY-5 | 1.8117 | +1.7786 | 0.3216 | +0.2246 | 0.0332 | +0.0102 | 2.1665 |
4.5. Pore Size–Pore Volume Analysis of Coal Before and After LCO2 Acidification
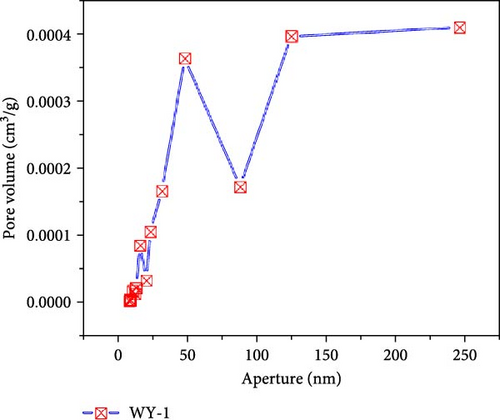
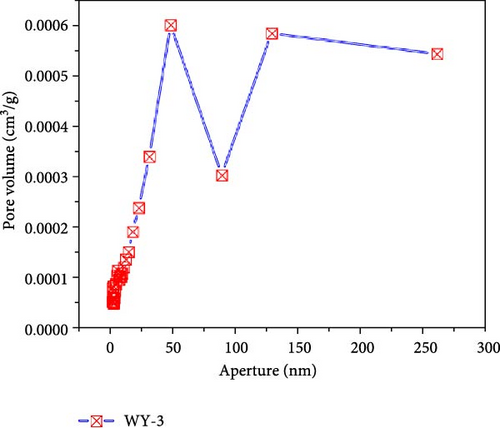
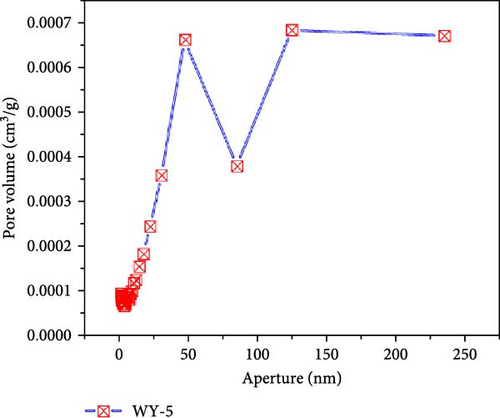
Figure 10 presents the pore size–pore volume distribution of the coal before and after LCO2 acidification. As shown in Figure 10a, the pore volume distribution of the coal samples in the reference group is mainly concentrated between 10 and 100 nm, with a maximum pore volume near 3.9 × 10⁻⁴ m3/g and a total pore volume of 1.60 × 10⁻³ m3/g. As shown in Figure 10b–d, the pore volume distributions of the WY-1, WY-3, and WY-5 coal bodies are still mainly concentrated in the range of 10–100 nm, and the total pore volumes are 1.79 × 10³, 4.7 × 10³, and 5.1 × 10⁻³ m3/g, respectively, which are 1.12, 2.92, and 3.20 times, respectively, larger than the reference group. Table 5 summarizes the changes in the pore volumes for the different pore sizes before and after the acidification of LCO2. Compared with the reference group, the pore volumes of the WY-1, WY-3, and WY-5 coal samples increased in different pore size segments, among which the increase of the WY-3 and WY-5 coal samples was the most significant, but mainly in the pore size range of <100 nm. In summary, the pore volumes of the micropores significantly increased after acidification, which is consistent with the analysis of the specific surface area. Dawson et al. [55] have shown that reactions between CO2 acidified water and minerals within coal, especially mineralized cleats, could potentially create additional pore space, consistent with experimental results.
| Coal samples | Poer volume × 10−3 (m3/g) | Total pore volume × 10−3 (m3/g) |
|||||
|---|---|---|---|---|---|---|---|
| <10 nm | Increment | 10–100 nm | Increment | >100 nm | Increment | ||
| WY-0 | 0.0452 | — | 0.7852 | — | 0.7707 | — | 1.6011 |
| WY-1 | 0.0088 | −0.0364 | 0.9751 | + 0.1899 | 0.8064 | + 0.0357 | 1.7903 |
| WY-3 | 1.4358 | + 1.3906 | 2.0811 | + 1.2959 | 1.1293 | + 0.3586 | 4.6683 |
| WY-5 | 1.5562 | + 1.5110 | 2.2178 | + 1.4326 | 1.3550 | + 0.5843 | 5.1290 |
4.6. Comparative Analysis of the Pore Fractal Characteristics of Coal Samples Before and After LCO2 Acidification
4.6.1. Fractal Theory Analysis
In liquid nitrogen adsorption, the following three methods can be used to determine the fractal Df value:
The size of the fractal dimension quantitatively characterizes the degree of development of coal pores. A fractal dimension closer to two indicates a simpler coal body and smooth surface, whereas that closer to three indicates a coarser pore surface of the coal, higher complexity, and stronger heterogeneity.
4.6.2. Fractal Results of the Coal Pores Before and After LCO2 Acidification
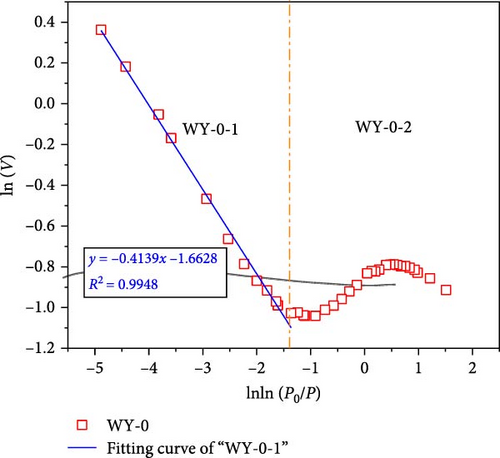
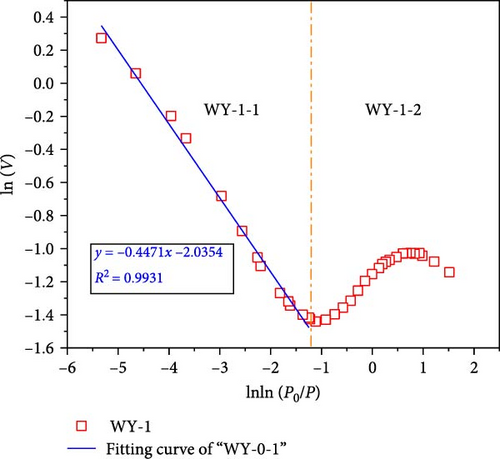
As the relative pressure increases, the adsorption mode also changes. According to Hazra et al. [56], the low-pressure section (p/p0 < 0.5) is primarily controlled by van der Waals forces. In the high-pressure section (p/p0 > 0.5), the interfacial tension plays a major role, and the capillary condensation effect is prominent. As the pore surfaces of the samples under different acidification treatment conditions have different adsorption potential energies, it is not appropriate to simply determine a certain relative pressure as the demarcation point. Therefore, the first apparent inflection point in the fitted data when the relative pressure increased from 0 to 1 was regarded as the demarcation point and was divided into high-pressure and low-pressure segments, where the fractal dimension of the high-pressure segment was D1; the fractal dimension of the low-pressure section is D2.
According to Equations (11) and (12), the relationship curves of lnln (p0/p) and ln (V) were drawn, and linear fitting was performed for the different segments, as shown in Figure 11, demonstrating that when the segmentation p/p0 is approximately 0.7–0.8, the coal samples exhibit better fractal characteristics (Figure 11a,b). This stage is mainly affected by the interfacial tension. The fractal dimension was calculated using Equation (12), where DWY−0−1 = 2.5861 and DWY−1−1 = 2.5529, indicating that the pore development of the coal was simple and the surface was smooth. When p/p0 < 0.7–0.8, the coal sample does not demonstrate fractal characteristics, indicating that the coal heterogeneity is significantly strong. In Figure 9a,b, p/p0 is near 0.35–0.40, and both the high and low pressure segments have good fractal characteristics.
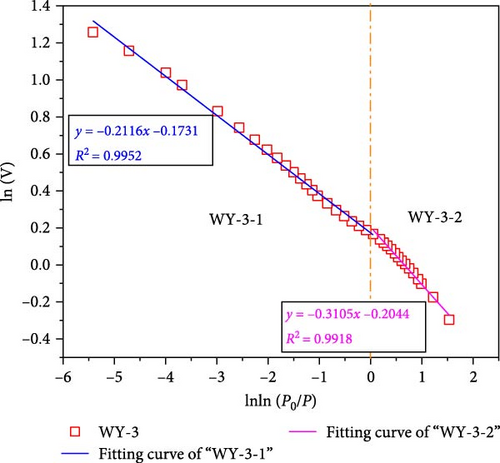
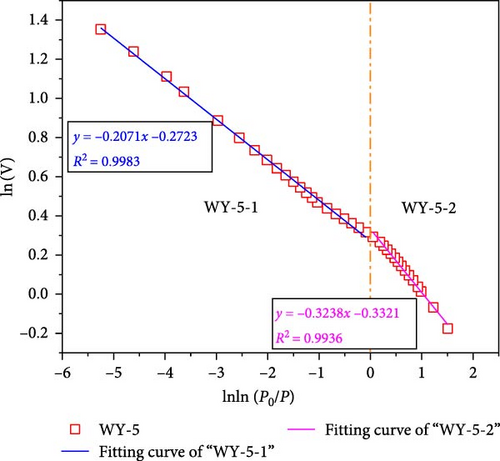
When p/p0 > 0.35–0.4, it is mainly affected by the interfacial tension. The fractal dimensions calculated using Equation (12) were DWY−3−1 = 2.7884 and DWY−5−1 = 2.7927, indicating that the coal body had a high pore complexity and rough surface. After the acidification of LCO2, the minerals on the pore surface of the coal in the high-pressure section reacted with the weak acid, which not only increased the development of branched pores, but also their complexity and roughness of the pore surface. In addition, acidification increases the permeability of coal, range of the high-pressure section, and results in fractal characteristics. When p/p0 < 0.35–0.4, it is mainly affected by the van der Waals force. The fractal dimensions calculated using Equation (11) were DWY−3−2 = 2.0685 and DWY−5−2 = 2.0286, respectively, indicating that the pore development of the coal was simple and the surface was smooth. Combined with the analysis of pore specific surface, after the acidification of LCO2, the pore minerals of coal in low pressure section react with weak acid, which increases the complexity and connectivity of coal pores and makes the pores have fractal characteristics.
5. Discussion
During LCO2-ECBM, the main goal of the acidified coal seam is to strengthen gas extraction. LCO2 enters the coal to form gaseous CO2 and dispels the free CH4 in the pores. Therefore, the flow of two gases, CH4 and CO2, are involved in the pores. Gas migration is related to the porosity of coal in addition to its compressibility. The law of gas migration was analyzed by considering gas migration and the pore size distribution characteristics after the reconstruction of coal pores.
5.1. Analysis of the Transport Characteristics of CO2 and CH4 in the Pores
Whether the gas molecule collides with the porous medium wall is related to the mean free path of the molecule (γM) and the pore diameter (λ). The migration mechanism of gas in microscale channels is generally divided into four types of flows according to the Knudsen number (Figure 12): viscous (Kn < 0.001), slippage (0.001 ≤ Kn < 0.1), transition (0.1 ≤ Kn < 10), and free molecular flow (Kn ≥ 10).
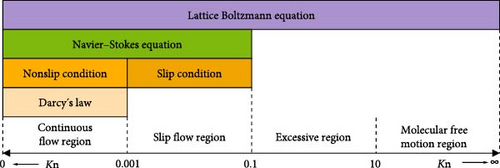
The dynamic viscosity and compression factors of CO2 and CH4 under different pressure conditions were summarized using the reference fluid thermodynamic and transport properties database (REFPROP) software, and the pore size ranges corresponding to the molecular mean free path and critical Knudsen number under different conditions were obtained by calculating Equations (13)–(15). Thus, the viscous, detachment, transition, and free molecular flows can be obtained, corresponding to the aperture scale range, as shown in Table 6.
| Gas | Pressure (MPa) |
Dynamic viscosity (μPa·s) |
Compressibility factor |
Mean free path (m) |
Aperture d (nm) | |||
|---|---|---|---|---|---|---|---|---|
| Viscous flow | Slip flow | Transition flow | Free molecule flow | |||||
| CO2 | 1.00 | 15.265 | 0.951 | 4.46 × 10⁻⁹ | >4463.63 | 44.64–4463.63 | 0.45–44.64 | <0.45 |
| 3.00 | 15.698 | 0.842 | 1.44 × 10⁻⁹ | >1439.39 | 14.39–1439.39 | 0.33–14.39 | <0.33 | |
| 5.00 | 16.778 | 0.704 | 8.44 × 10⁻¹⁰ | >844.00 | 8.44–844.00 | 0.33–8.44 | <0.33 | |
| CH4 | 1.00 | 11.362 | 0.98385 | 5.60 × 10⁻⁹ | >5596.20 | 55.96–5596.20 | 0.56–55.96 | <0.56 |
| 3.00 | 11.706 | 0.95249 | 1.89 × 10⁻⁹ | >1891.00 | 18.91–1891.00 | 0.38–18.91 | <0.38 | |
| 5.00 | 12.155 | 0.9229 | 1.16 × 10⁻⁹ | >1159.67 | 11.60–1159.67 | 0.38–11.60 | <0.38 | |
5.2. Analysis of the Corresponding Relationship Between the Different Migration States of the Gas and Pore Volumes
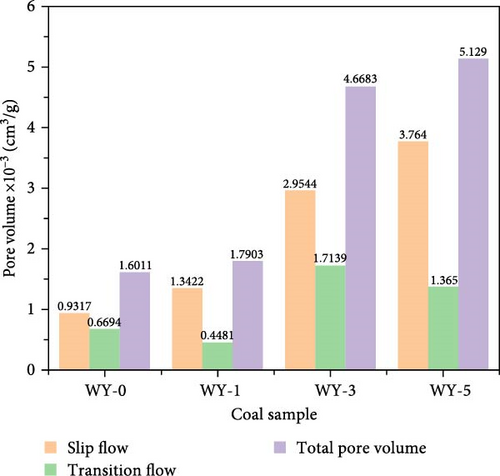
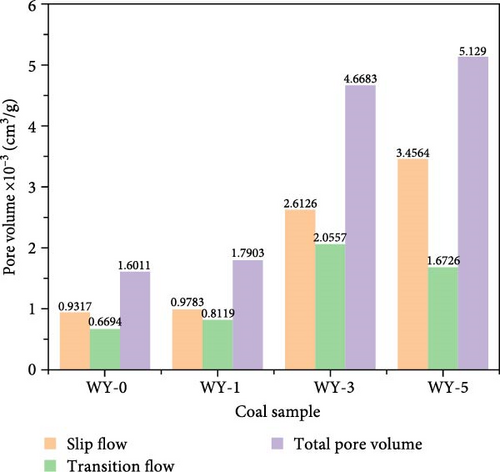
Figure 13 demonstrates the pore volume distributions corresponding to the different gas migration characteristics before and after LCO2 acidification. Figure 13a shows that the pore volumes corresponding to the CO2 gas slippage flow of coal samples WY-1, WY-3, and WY-5 increased as the acidification pressure increased, whereas the pore volumes corresponding to the transition flow increases first and then decreases, respectively. Figure 13b shows that the pore volume variation trends of the CH4 gas slippage and transition flows in coal samples WY-1, WY-3, and WY-5 are consistent with those of CO2 gas. In addition, when comparing Figure 13 a,b, the increase in the pore volume corresponding to the CO2 slip flow was greater than that of CH4, whereas that corresponding to the transition flow was significantly greater for CO2. In summary, acidification increased the pore volume corresponding to the CO2/CH4 slip flow in the coal body and strengthened the mass transfer energy of CO2/CH4. CO2 can enter more pores than CH4 and displace adsorbed and free CH4 in the pores.
6. Conclusions
- 1.
Under the same gas injection pressure, a longer reaction time results in the gradual dissolvement of more minerals in the coal, and more H+ is consumed in the solution. Using the same holding time, the pH value of the water sample of the CO2–H2O–coal interaction rapidly decreased as the gas injection pressure increased; namely, a greater pressure results in a greater amount of CO2 being dissolved and a stronger acidity of the water sample.
- 2.
The calcite (carbonate) and illite (clay minerals) contents significantly decreased after acidification. The variations in the dolomite (carbonate) and rutile (oxide) contents were nonuniform, and the decrease was insignificant because rutile has a stable chemical structure, making it difficult to react with weak acids at low temperatures. The acidification chemical reaction of calcite and illite is the main reason for the change of coal pore structure.
- 3.
The minerals on the pore surface of coal react with (CO2–H2O) weak acid, which increases the development of pore branches, improves the complexity of coal pores, and roughens the pore surface. Acidification significantly increases the number of micropores (<10 nm) and small pores (10–100 nm) in coal; furthermore, pore development is simple, the surface is smooth, and the pore connectivity is improved, which makes this part of pores have fractal characteristics. In addition, acidification increases the pore volume corresponding to slip flow, which increases the permeability of coal. With the increase of pressure, the acidification and corrosion effect of CO2–H2O–coal is more significant.
- 4.
CO2–H2O–coal acidification increases the pore volume corresponding to the CO2/CH4 gas slippage flow in the coal body and strengthens the mass transfer energy of CO2/CH4. CO2 can enter more pores than CH4, displacing and replacing the adsorbed and free CH4 in the pores.
Conflicts of Interest
The authors declare no conflicts of interest.
Author Contributions
Xiaojiao Cheng contributed to writing, review, and editing. Yanhui Xu contributed to equation analysis, writing the original draft. Hu Wen contributed to conceptualization, visualization. Shixing Fan and Bocong Liu contributed to validation and methodology. Wen Wang contributed to supervision and data curation.
Funding
This work was supported by Postdoctoral Fellowship Program of CPSF (Grant GZC20232134), Project funded by China Postdoctoral Science Foundation (Grant 2023MD744246), Natural Science Basic Research Program of Shaanxi Province (Grant 2024JC-YBQN-0581), and Shaanxi Province Postdoctoral Science Foundation (Grant 2023BSHEDZZ288).
Acknowledgments
This work was supported by Postdoctoral Fellowship Program of CPSF (Grant GZC20232134), Project funded by China Postdoctoral Science Foundation (Grant 2023MD744246), Natural Science Basic Research Program of Shaanxi Province (Grant 2024JC-YBQN-0581), and Shaanxi Province Postdoctoral Science Foundation (Grant 2023BSHEDZZ288).
Open Research
Data Availability Statement
The data that support the findings of this study are available from the corresponding author, Xiaojiao Cheng, upon reasonable request.


