Effects of Latent Heat Release from Single-Moment and Double-Moment Microphysical Schemes on the Simulated Intensity of Typhoon Songda
Abstract
This study aims to quantify the magnitude of latent heat release by strong typhoons in the Northwest Pacific region and to identify the key cloud microphysical processes that affect the release of latent heat. The Weather Research and Forecasting mesoscale numerical model was used to simulate Typhoon Songda from 2011. Single- and double-moment 6-class (WSM6 and WDM6) cloud microphysics schemes were used to simulate the 3D structure and evolution of latent heat release. Simulations show that condensation of cloud water is the main source of latent heat release, while the main sources of latent heat absorption are evaporation of rain and cloud water. Depositional heating in cold cloud processes in the upper troposphere also plays an important role in the evolution of typhoon intensity. Latent heat release and absorption simulated by both schemes evolve through the phases of intensifying, maintaining, and weakening during the lifetime of the typhoon. The largest latent heat release occurs at altitudes between 5 and 10 km; condensational heating plays a major role at altitudes below 6 km, while depositional heating is the dominant process at altitudes from 6 to 12 km. Compared with WSM6, the WDM6 scheme produces smaller absolute values of latent heating from condensation and evaporation of cloud water and a more reasonable vertical distribution of cloud water mixing ratio. Positive latent heating from WDM6 is larger than that from WSM6. However, because of stronger processes of evaporation of rainwater and sublimation of cloud ice, total net latent heat release is lower in WDM6, and hence, simulated typhoon intensity is higher in WSM6.
1. Introduction
Typhoons are accompanied by fierce winds, rainstorms, and storm surges, which lead to natural disasters, such as floods and sometimes landslides after typhoon landfall, often bringing great harm to infrastructure and society. The absence of timely predictions of typhoon movement and intensification could result in large numbers of casualties and severe economic consequences or, conversely, unnecessary disruption of normal activities [1, 2]. With the development of numerical models and increased availability of observational data, forecasting of typhoon tracks has greatly improved over the past two decades, but much still needs to be understood about the evolution of typhoon intensity [3]. Studies have shown that latent heat release has an important impact on typhoon structure and precipitation amount and is a key component in typhoon maintenance and intensification via inner-core convective updrafts [4, 5, 6]. While it is acknowledged that the release of latent heat is essential to the development and maintenance of tropical cyclones, there is limited understanding of the characteristics of latent heat release during typhoon intensification. As observations of tropical cyclones in remote locations over oceans are limited, latent heat release from typhoons is most often measured by satellites equipped with passive microwave radiometers. Cloud microphysical schemes have a significant impact on the simulation of hydrometeors. Wu et al. [7] found that single-moment schemes generally perform better in simulating solid hydrometeors, while double-moment schemes perform better in simulating liquid hydrometeors.
Results indicate that latent heat released during convection plays a leading role in storm development and intensification, and the more intense the cyclone is, the more latent heat is released [8]. However, because satellites have coarse resolutions in space and time, the eyewall and rainband regions of a tropical cyclone embedded with deep convective clouds are poorly resolved, leading to large errors in the latent heat field retrieved from satellite measurements. Recently, the Tropical Rainfall Measuring Mission (TRMM) precipitation radar has been used to estimate latent heating rates in tropical cyclones at a horizontal resolution of approximately 4–5 km and has obtained clearer pictures of the vertical structure of total latent heat release [9, 10]. By applying a new algorithm to the National Oceanic and Atmospheric Administration’s P-3 airborne Doppler radar observations, Guimond et al. [11] and Guimond and Reisner [12] reproduced the structure of the latent heat field in a hurricane. They found that considerable uncertainty still exists in observational studies and in the microphysics schemes used in numerical models and that Doppler radar-based latent heat retrievals can be used for convection initialization and data assimilation to reduce errors in numerical simulations of tropical cyclones. Data inversion strategies only reveal macroscopic characteristics of the latent heat field and preclude analyses of typhoon structures at high resolutions. With the development of mesoscale numerical models, some researchers have begun to use explicit cloud microphysics to model tropical cyclones and calculate latent heat release [13, 14, 15], but the work in this area is still in its initial phase.
The dynamic field of tropical cyclones is influenced by physical factors; surface drag force weakens the convection, but latent heat release increases instability [16]. For example, numerical simulations show that the early rapid intensification of hurricanes is very sensitive to the choice of cloud microphysical parameterization schemes in the Weather Research and Forecasting (WRF) model; the warm rain microphysics scheme produces a faster intensification than the mixed ice phase scheme [17, 18]. In addition, numerical experiments show that the evaporation of rain and melting of snow and graupel are responsible for the generation of downdrafts and rainbands; when these processes are included in the model, storms in the numerical experiment develop much more rapidly and reach an intensity similar to that found in nature [19, 20]. With the improvement of computing power, the use of mesoscale numerical models has increased, enabling the deployment of double-moment cloud microphysics schemes for the simulation of typhoons. Double-moment schemes can simulate the evolution of the rain-drop size distribution more realistically than single-moment schemes [21, 22, 23]; different pathways to the production of hydrometeors are assumed, resulting in differences in net latent heat release; however, much uncertainty still exists in the simulation of typhoons using both single-moment and double-moment microphysical schemes [24, 25]. Therefore, the precise impact of microphysical schemes on the simulation of typhoon intensity still needs to be evaluated in greater detail. In this study, we use the mesoscale numerical WRF model to simulate Typhoon Songda. A comparative experiment using the WRF model’s single-moment 6-class (WSM6) scheme and the double-moment 6-class (WDM6) scheme is conducted to simulate the characteristics of latent heat release, focusing on the period of typhoon intensification.
2. Simulation Experiment Design
Typhoon Songda occurred over the western North Pacific Ocean in 2011. It was characterized by strong intensity and rapid intensification; latent heating rates are available from TRMM data for the time when the typhoon reached its strongest stage; therefore, Songda was chosen as the focus of this study. We used the WRF model version 3.3.1. Initial and boundary conditions for the large-scale atmospheric fields were derived from National Centers for Environmental Prediction Final Operational Global Tropospheric Analysis data on 1° × 1° grids. Figure 1 shows the three domains that were employed; domains 1, 2, and 3 have horizontal grid sizes of 36 km (150 × 130), 12 km (154 × 214), and 4 km (271 × 382), respectively; time steps of 90, 30, and 10 s were used for the three domains. The model has 43 vertical levels, with the top level at 50 hPa. The Yonsei University planetary boundary layer scheme was used because it can produce more realistic surface winds under unstable conditions than the local closure planetary boundary layer scheme [26]. The other physics options used in the experiments were the Rapid Radiative Transfer Model for longwave radiation, the Dudhia scheme for shortwave radiation, and the Kain–Fritsch scheme for cumulus convective parameterizations for domains 1 and 2, but not for domain 3, which has a higher resolution.

A comparative experiment using the WRF model’s WSM6 and WDM6 schemes was conducted. It was conducted for the period 00:00 UTC 25 May to 12:00 UTC 28 May 2011 for domains 1 and 2, and 12:00 UTC 25 May to 00:00 UTC 28 May 2011 for domain 3. Conventional ground-based observations and sounding data, as well as mixed surface wind speed data from the US National Climate Center that incorporates various satellite data, were assimilated using the WRF model’s variational data assimilation system to improve initial model states [27, 28].
The comparative experiment was conducted to allow latent heat release from phase transitions in various cloud microphysical conversion processes to be investigated in detail. The WSM6 scheme contains six water species: water vapor, cloud water, rainwater, cloud ice, snow, and graupel; there are 36 cloud microphysics conversion processes, of which 25 involve latent heat through phase changes [29]. Number concentrations for cloud water and rainwater, together with a prognostic variable of cloud condensation nuclei (CCN) number concentration, are also predicted in the WDM6 scheme. Conversion efficiency between water substances changes because of the double-moment scheme; therefore, the WDM6 scheme has two additional microphysical processes: water vapor activating into cloud water (cact) and rainwater evaporating into cloud water (revp_rc). The WDM6 scheme currently used is a hybrid scheme, which uses a double moment description for the warm cloud part and a single moment description for the other parts. The activation process of cloud water and complete evaporation of cloud drops are the only CCN sink–source terms included in the WDM6 scheme, while CCN is held constant in the WSM6 scheme. The two schemes also use different cloud water and rainwater size distributions, as well as different formulas for the conversion process from cloud water to rain and the collection of cloud water by rain [30].
3. Verification and Analysis of Simulation Results
3.1. Track
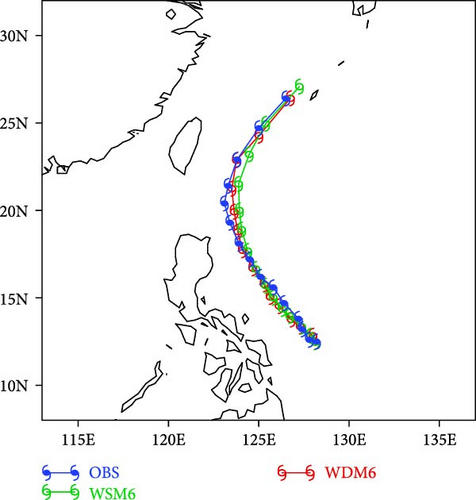
Typhoon Songda originated in the western North Pacific Ocean at 12:00 UTC 21 May 2011 and headed northwest with increasing intensity. The eye was reported to have a minimum sea level pressure of 920 hPa and a maximum surface wind speed of 55 m s−1, making Songda the first category 5 Super Typhoon in 2011 in the Pacific Ocean. The typhoon track and intensity observations used here are from the Japan National Institute of Information (NII). Figure 2 shows the simulated and observed tracks of Typhoon Songda; for 12:00 UTC 25 May to 00:00 UTC 28 May, simulation results from the 4 km domain 3 are shown; results from domain 2 are shown for the rest of the study period. Simulated tracks resemble observed tracks. Typhoon Songda headed northwest before 12:00 UTC 27 May and then turned northeast. Average deviations from the observed track of the WSM6 and WDM6 tracks are 59.1 and 41.6 km, respectively; compared with the WSM6 track, the WDM6 track lies closer to the observed track.
3.2. Change of Intensity
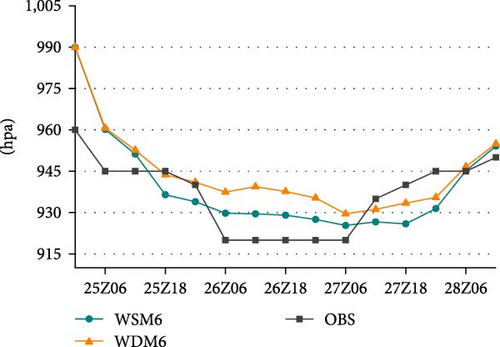
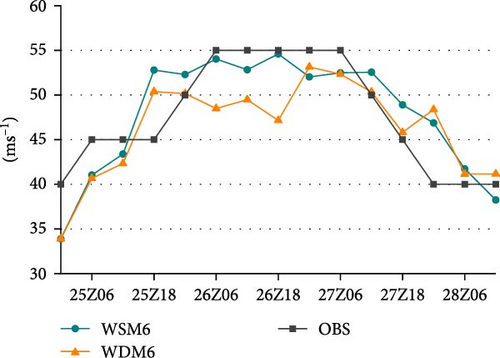
Minimum sea level pressure and maximum surface wind speed from the simulations and observations are shown in Figure 3. In the initial field, the simulated typhoon intensity is far lower than the observed intensity. After a spin-up of 12 hr, the simulated intensity becomes very similar to the observed. The simulated intensity is lower than the observed intensity for 06:00 UTC 26 May to 06:00 UTC 27 May but is higher than observed for 12:00 UTC 27 May to 06:00 UTC 28 May. In general, both simulations show the typhoon first intensifying and then weakening. Observations indicate that Typhoon Songda weakened at 06:00 UTC 27 May, but the simulations have a 12 hr lag behind observations and only show the typhoon weakening after 18:00 UTC 27 May. In comparison, typhoon intensity in experiment WSM6 is higher than that in WDM6; the average difference between the two experiments in minimum sea level pressure is 4.9 hPa, and that in maximum surface wind speed is 1.5 m s−1. For minimum sea level pressure, average deviations from observations are 9.8 hPa (WSM6) and 10.8 hPa (WDM6); for maximum surface wind speed, average deviations from observations are 3.2 m s−1 (WSM6) and 3.7 m s−1 (WDM6). Compared with the simulated intensity from experiment WDM6, the simulated intensity from WSM6 is closer to the observed intensity.
3.3. Precipitation
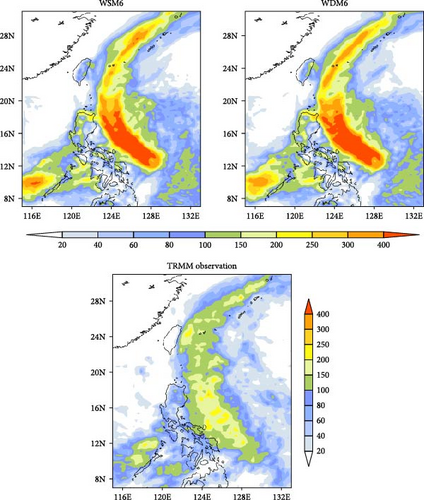
Figure 4 shows the 84 hr accumulated rainfall (mm) distribution over domain 2 from the simulations and TRMM 3B42RT data. It illustrates a clear correlation between precipitation distribution and typhoon tracks with heavy rain mainly located in the typhoon’s inner core. Simulated distributions are similar to observed distributions. Both WSM6 and WDM6 simulations give three strong precipitation belts in the eastern Philippines, the Nansha Islands, and the northeast of Taiwan Island, but simulated precipitation amounts are higher than observed. Most simulated precipitations are above 400 mm, while observed values are at approximately 200 mm. This discrepancy is related to the parameterizations and may also be related to the error in TRMM satellite data in the estimation of heavy rainfall.
3.4. Cloud Distribution
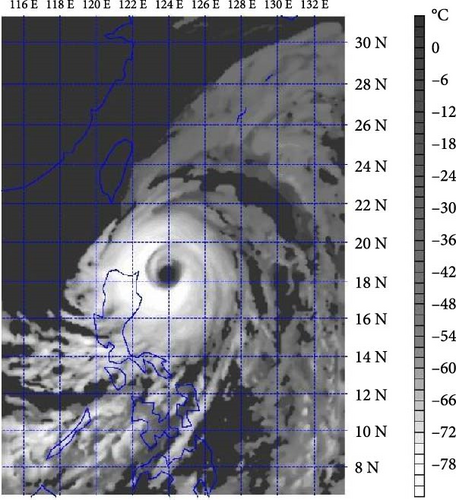
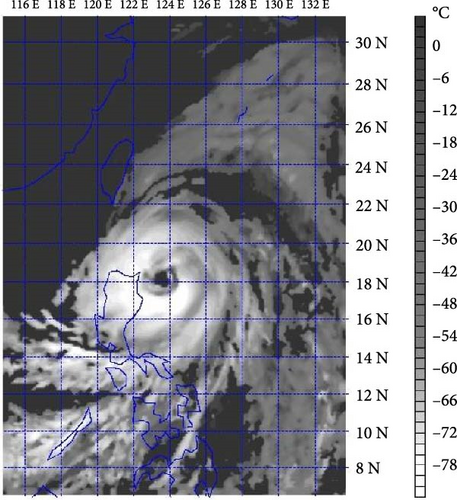
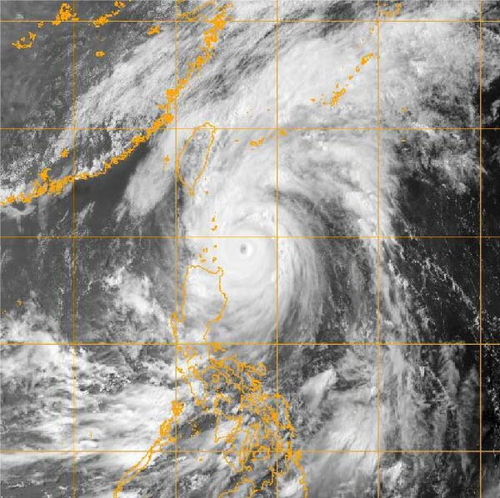
Figure 5 shows the cloud top temperature over domain 2 for 06:00 UTC 27 May from the simulations and satellite cloud imagery from Himawari-7 (Multifunction Transport Satellite-2) (MTSAT-2) for 06:32 UTC 27 May. Generally, cloud top temperature lowers with cloud height; therefore, cloud distribution and convection intensity are consistent with cloud top temperature. There are a few differences between the cloud top temperature distributions from WSM6 and WDM6. The eye of the typhoon is clearer in WSM6. Simulations indicate slightly stronger convective activity on the western side of the eye wall than that on the eastern side. On the northeastern side of the typhoon, there are large cirrus clouds extending from 24°N to 30°N. There are also two distinct spiral bands in the southwestern area of the typhoon. Distributions of the major cloud regions from the simulations are very similar to that from satellite imagery, with the slight difference being that the typhoon eye from the simulations is larger than that observed.
4. Evolution and Structure of Latent Heat Field
| Latent heat rate | Cloud microphysical process | WSM6 scheme | WDM6 scheme |
|---|---|---|---|
| Qcond | Water vapor condenses into cloud water | 5.73 × 10¹⁸ | 5.43 × 10¹⁸ |
| Qidep | Deposition growth of cloud ice | 7.86 × 10¹⁷ | 1.08 × 10¹⁸ |
| Qsdep | Deposition growth of snow | 7.05 × 10¹⁷ | 4.61 × 10¹⁷ |
| Qigen | Initialization of cloud ice | 2.99 × 10¹⁷ | 2.76 × 10¹⁷ |
| Qgdep | Deposition growth of graupel | 2.59 × 10¹⁷ | 2.83 × 10¹⁷ |
| Qaacw | Cloud water is collected by snow, graupel | 1.73 × 10¹⁷ | 7.12 × 10¹⁶ |
| Qrcond | Condensation of rainwater | 5.78 × 10¹⁶ | 6.98 × 10¹⁷ |
| Qiacr | Rainwater is collected by cloud ice | 2.13 × 10¹⁶ | 3.23 × 10¹⁶ |
| Qgacr | Rainwater is collected by graupel | 2.00 × 10¹⁶ | 1.44 × 10¹⁷ |
| Qsacr | Rainwater is collected by snow | 9.46 × 10¹⁵ | 1.71 × 10¹⁶ |
| Qihmf | Homogeneous growth of cloud ice | 1.36 × 10¹⁴ | 5.69 × 10¹³ |
| Qgfrz | Rainwater frozen into graupel | 1.21 × 10¹³ | 2.41 × 10¹⁵ |
| Qihtf | Heterogeneous growth of cloud ice | 1.22 × 10¹³ | 4.06 × 10¹⁵ |
| Qcact | Water vapor activated into cloud water | None | 9.71 × 10¹⁴ |
| The average total positive latent heating rate | 8.06 × 10¹⁸ | 8.49 × 10¹⁸ | |
| Qcevp | Cloud water evaporates into water vapor | −1.22 × 10¹⁸ | −7.11 × 10¹⁷ |
| Qrevp | Evaporation of rainwater | −1.21 × 10¹⁸ | −1.99 × 10¹⁸ |
| Qssub | Sublimation of snow | −4.22 × 10¹⁷ | −4.29 × 10¹⁷ |
| Qgmlt | Melting of graupel | −2.30 × 10¹⁷ | −3.06 × 10¹⁷ |
| Qisub | Sublimation of cloud ice | −1.95 × 10¹⁷ | −3.76 × 10¹⁷ |
| Qgsub | Sublimation of graupel | −1.40 × 10¹⁷ | −1.41 × 10¹⁷ |
| Qgeml | Enhanced melting of graupel | −7.23 × 10¹⁶ | −6.22 × 10¹⁶ |
| Qsmlt | Melting of snow | −7.02 × 10¹⁶ | −4.11 × 10¹⁶ |
| Qgevp | Evaporation of melting graupel | −6.43 × 10¹⁶ | −6.15 × 10¹⁶ |
| Qsevp | Evaporation of melting snow | −1.83 × 10¹⁶ | −1.05 × 10¹⁶ |
| Qseml | Enhanced melting of snow | −3.94 × 10¹⁵ | −7.79 × 10¹⁴ |
| Qimlt | Melting of cloud ice | −1.59 × 10¹⁵ | −1.36 × 10¹⁵ |
| The average total negative latent heating rate | −3.64 × 10¹⁸ | −4.13 × 10¹⁸ | |
4.1. Horizontal Distribution of Latent Heat Release
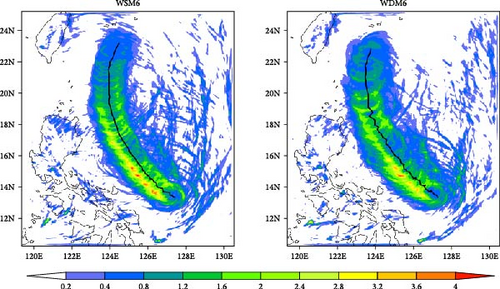
The horizontal distribution of latent heat release associated with Typhoon Songda was calculated by vertically integrating average total latent heating rates for 12:00 UTC 25 May to 00:00 UTC 28 May. Figure 6 shows an uneven distribution. Latent heat is mainly released in the inner core of the typhoon and also in a few spiral cloud bands in the periphery. Latent heat release is clearly greater on the left than on the right side, which may be the result of the typhoon’s asymmetrical structure. Maximum latent heat release rate exceeds 4 × 10⁷ J m−2 hr−1. Convective development to the left of the track is stronger than that to the right (Figure 5). The distribution of latent heating from condensation, freezing, and deposition (processes that release rather than absorb latent heat) is very similar to that of total latent heating, reflecting the dominance of processes that release latent heat. Compared with the WSM6 experiment, the area around the typhoon center with latent heat release rates exceeding 0.4 × 10⁷ J m−2 hr−1 is broader in WDM6.
4.2. Vertical Distribution of Hydrometeors and Latent Heat Release
Figure 7 shows hydrometeor and total latent heating rate profiles obtained from the WSM6 and WDM6 experiments for 07:00 UTC 26 May 2011 and TRMM 2A12 data for approximately 07:03 UTC 26 May 2011. Simulated and satellite results were averaged over 15°N–17°N and 124°E–126°E, which lie within domain 3 of the model. The TRMM 2A12 data were derived using a Bayesian algorithm; despite biases and uncertainties, they are useful for estimating the locations and magnitudes of hydrometeors and latent heat release [31, 32]. Figure 7(a) indicates large differences between cloud water densities estimated from the WSM6 and WDM6 experiments; the maximum cloud water density from WDM6 is 0.02 g m−3, but 0.1 g m−3 from WSM6. Satellite data indicate that cloud water density reached a maximum at an altitude of 5 km; the maximum cloud water density from TRMM data was 0.05 g m−3, which lies between the two simulated values. Rainwater profile from WSM6 is very similar to that from TRMM (Figure 7(b)); below the altitude of 6 km, rainwater density increases with decreasing altitude; maximum rainwater density is about 0.4 g m−3. This is considerably smaller than the value obtained from WDM6, which is close to 0.8 g m−3. Both simulations indicate that maximum cloud ice density is located between 6 and 14 km above sea level (Figure 7(c)), while TRMM data indicate that it was located at a higher altitude with a value of 0.02 g m−3. This is considerably smaller than the maximum cloud ice densities obtained from WSM6 and WDM6; the maximum cloud ice density obtained from WSM6 is smaller than that of WDM6. For snow and graupel (precipitable ice), while densities derived from WSM6 are slightly larger than those from WDM6 at altitudes above 6 km, differences between the estimates from the two experiments are generally small (Figure 7(d)). Both simulated profiles are very similar to that derived from TRMM data. Satellite data indicate that maximum snow and graupel densities were located at an altitude of 6 km.

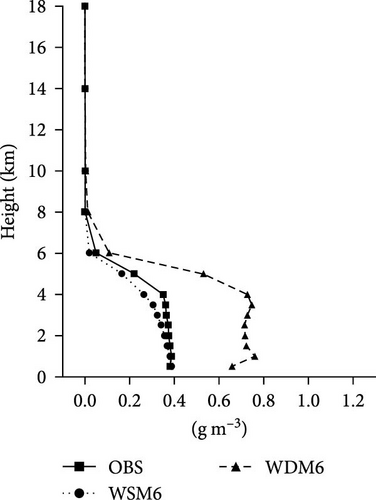
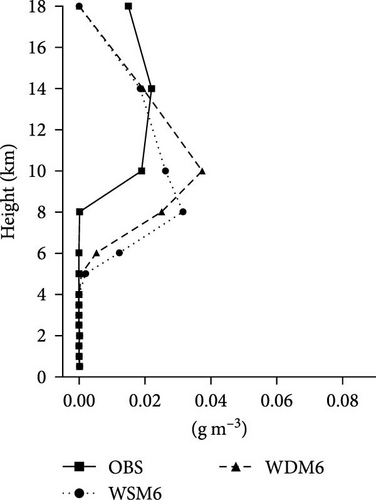
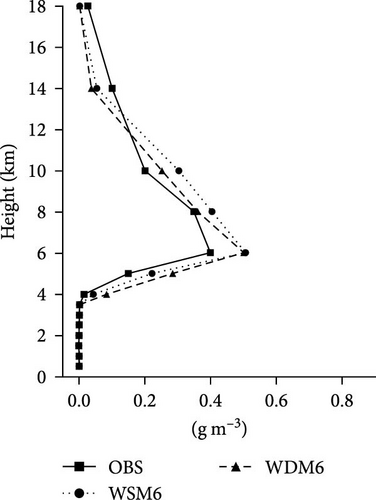
This comparative analysis shows that simulated hydrometeor profiles from the two experiments are similar to that obtained from satellite data, but differences remain. Compared with the distribution of rainwater mixing ratio from WDM6, the distribution from WSM6 is closer to that from satellite data, while the value of the cloud water mixing ratio from WDM6 is more reasonable than that obtained from WSM6. The double-moment parameterization of cloud water and rainwater in the WDM6 scheme considerably changes the warm cloud microphysics; while differences in ice phase particles remain relatively small, there are notable decreases and increases in cloud water and rainwater contents, respectively.
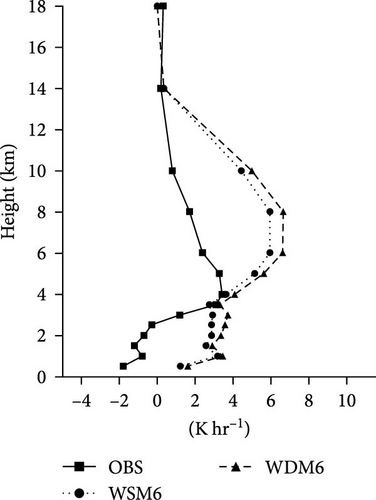
Figure 7(e) shows total latent heating rate profiles obtained from experiments and satellite data. Simulation results show that the maximum latent heat release occurred at an altitude of 6–8 km. Maximum latent heat release from the WDM6 experiment is close to 7 K hr−1, which is slightly larger than that from WSM6 (6 K hr−1). Both simulated profiles are very similar to that derived from TRMM data. However, TRMM data indicate that latent heat absorption was stronger and occurred at higher altitudes (below 2.5 km), and maximum latent heat release was lower (only 3.5 K hr−1) and occurred at a lower altitude (4 km) than indicated by simulation results. Therefore, further cases and more direct observational data are needed to verify the accuracy of the simulation results.
4.3. Evolution of the Vertical Structure of the Latent Heat Field
To understand the characteristics and vertical structure of the latent heat field during the lifetime of Typhoon Songda, the evolution of simulated regional mean total latent heating rate as well as that from condensation, evaporation, freezing, melting, deposition, and sublimation for 12:00 UTC 25 May to 00:00 UTC 28 May were calculated (Figure 8). This period covers the phases of intensification, maintenance, and weakening of the typhoon. Results were averaged over 11°N–25°N and 120°E–130°E, which lie within domain 3 of the model; wherever possible, the entire typhoon was included in the analysis.
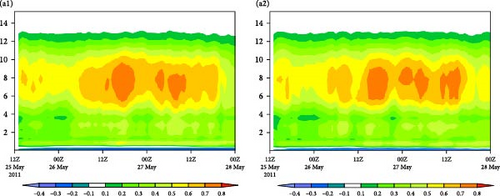
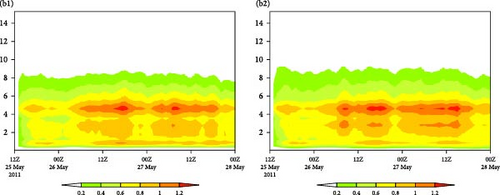
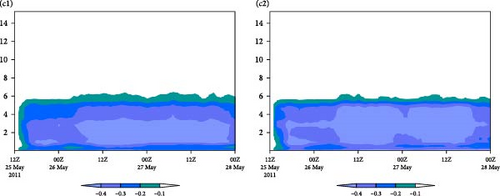
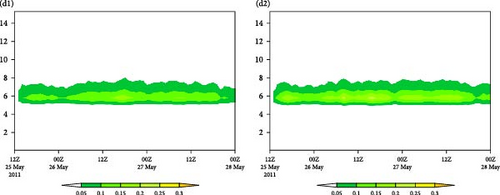
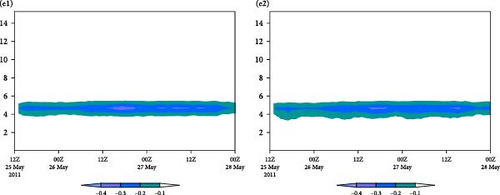
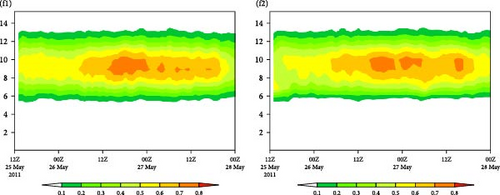
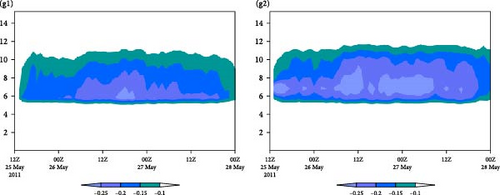
Figure 8(a) shows that large positive total latent heating values are concentrated between the altitudes of 5–10 km, while negative values are concentrated at altitudes below 0.5 km. There is an obvious enhancement of latent heating from 12:00 UTC 25 May to 12:00 UTC 26 May; heating increases in the middle and upper parts of the air column; from 12:00 UTC 26 May to 18:00 UTC 27 May, heating is maintained at a rate of more than 0.6 K hr−1, and finally weakens over the final 6 hr of the simulation. In general, the evolution of total latent heating is in good agreement with that of typhoon intensity. The evolution of total latent heating from WSM6 is almost the same as that from WDM6; nevertheless, in WSM6, heating rates exceeding 0.6 K hr−1 are maintained over a longer period, while there are fewer areas with heating rates exceeding 0.7 K hr−1 (three areas in WDM6 and two in WSM6).
Heating rates from condensation, evaporation, freezing, melting, deposition, and sublimation evolve through the same phases of intensifying, then maintenance, followed by weakening Figures 8(b), 8(c), 8(d), 8(e), 8(f), and 8(g). Condensational heating is highest at altitudes below 6 km with a maximum rate of over 1.2 K hr−1, while depositional heating is the dominant process at altitudes of 6–12 km. Latent heat release from freezing occurs at altitudes of 5–7 km. Condensational heating is high at altitudes below 6 km, but its contribution to total latent heating is small because of latent heat absorption from evaporation at altitudes below 5 km and from melting at altitudes between 4 and 6 km. The evolution of total latent heating is more closely reflected in the evolution of depositional heating, indicating that depositional heating plays a very important role in the evolution of typhoon intensity. Jin et al. [22] also indicated that the uncertainties in the parameterizations of ice phase processes may greatly influence the accuracies of simulated typhoon track, structure, and intensity. Heating rates from condensation, evaporation, freezing, melting, deposition, and sublimation from both experiments show almost the same characteristics; nevertheless, small differences exist between the two experiments in the heating rates from condensation, freezing, melting, and sublimation; in addition, latent heat absorption rates from evaporation and sublimation are considerably greater in WDM6.
4.4. Latent Heat Release during Cloud Microphysical Conversion Processes
Figure 9 shows the volume-integrated regional total net latent heat release rate Qx from WSM6 and WDM6 for 12:00 UTC May 25–00:00 UTC May 28; volume integration was performed over the latent heating from each of the microphysical processes. Total net latent heat release rate increases to approximately 1018 J hr−1 initially and then decreases within the first 12 hr before rapidly increasing between 00:00 UTC and 09:00 UTC May 26, which coincides with typhoon intensification, indicating that latent heat is the main energy source for typhoon enhancement. Hogsett et al. [33] pointed out that an average of 2% of the latent heat energy can be converted to kinetic energy in a typhoon. The results of Brown et al. [25] also suggest an intimate link between latent heating produced by the microphysical scheme and storm dynamics. From 09:00 UTC May 26–18:00 UTC May 27, the latent heat release rate is maintained at 4.5 × 10¹⁸ J hr−1 before decreasing. Overall, the trends of total net latent heat release rate are similar in both simulations. Average net latent heat release rates obtained from WSM6 and WDM6 over 60 hr are 4.42 × 10¹⁸ and 4.36 × 10¹⁸ J hr−1, respectively, and are thus 1% higher in WSM6 than in WDM6.
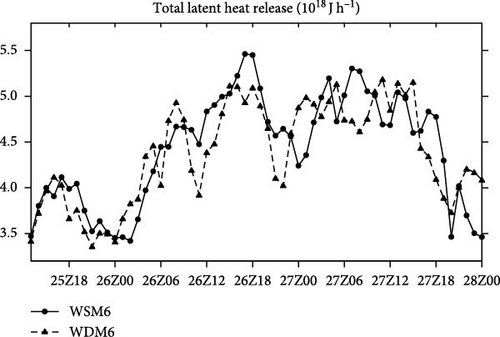
More attention, both WSM6 and WDM6 consider saturation adjustment to calculate the growth of liquid drops. The application of saturation adjustment can result in excessive condensation and latent heat release after each calculation time step, leading to high vertical velocity and convective precipitation rates. Additionally, the bulk cloud scheme may overestimate typhoon precipitation and latent heat [34, 35, 36].
The development of a simulated typhoon depends dynamically on the variations in the diabatic forcing associated with microphysics parameterization schemes. Differences in parameterization lead to different vertical distributions of net latent heat release; these differences result in different intensification and structural evolution of the simulated typhoon and different dynamical feedback to vertical distributions of hydrometeors [24]. Table 1 shows the average latent heating rates over 60 hr of various cloud microphysical processes from the WSM6 and WDM6 experiments. In both experiments, latent heat release rates from mainly condensation of water vapor into cloud water (Qcond) are on the order of 1018 J hr−1, while latent heat absorption occurs mainly in the evaporation of cloud water (Qcevp) and rainwater (Qrevp). In addition, heating rates from deposition and sublimation of cloud ice (Qidep, Qisub), snow (Qsdep, Qssub), graupel (Qgdep, Qgsub), initialization of cloud ice (Qigen) and melting of graupel (Qgmlt) are each on the order of 1017 J hr−1, showing that latent heat from cold cloud processes also plays a very important role. The average total positive latent heating rate in WDM6 is higher than that in WSM6. However, because of large negative latent heating rates, total net latent heat release in WDM6 is lower than that in WSM6. Compared with WSM6, the absolute values of latent heating rates from condensation and evaporation of cloud water (Qcond, Qcevp) are smaller in WDM6, while those from condensation and evaporation of rainwater (Qrcond, Qrevp) and cloud ice sublimation (Qisub) are considerably larger in WDM6. Latent heat release from the condensation of rainwater (Qrcond) is one order of magnitude higher in WDM6 than in WSM6; latent heat absorption from the evaporation of rainwater (Qrevp) in WDM6 is 164.5% of that in WSM6; these results correspond with the considerably higher rainwater content found in WDM6 (Figure 7). Many previous studies have shown that when the evaporative cooling effect of rainwater is ignored in simulations, simulated typhoon intensities are considerably higher. This appears to result from positive feedback between low-level warm-air convergence, latent heat release in the eyewall, and a decrease in surface pressure [14, 20]. The main difference between the two experiments in cold cloud processes can be seen in the higher latent heat absorption rate from cloud ice sublimation (Qisub) in WDM6, which is 190% of that in WSM6. The latent heat absorption rate from snow sublimation (Qssub) is also slightly higher in WDM6. In addition, in WDM6, the average heating rate from water vapor activation into cloud water is only 9.7 × 10¹⁴ J hr−1 and has little direct impact on the typhoon. The lower simulated typhoon intensity in WDM6 is a result of the higher levels of simulated latent heat absorption from rainwater evaporation (Qrevp) and cloud ice sublimation (Qisub).
5. Conclusions
- (i)
Compared to the WDM6 experiment, the WSM6 experiment simulates typhoon intensity and rainwater content that are all closer to observed values. Conversely, compared to WSM6, the WDM6 experiment simulates typhoon track, snow, and graupel content that are more in line with observations. In this study, the advantage of the WDM6 scheme in simulating forward latent thermal heating may stem from its finer description of the cloud microphysics processes, which can better capture the heat released during condensation.
- (ii)
Latent heat release and absorption simulated by both schemes evolve through the phases of intensifying, then maintenance, followed by weakening, which is consistent with the evolution of typhoon intensity. Positive (negative) heating is mainly located to the left (right) of the typhoon track, with the largest positive heating occurring at altitudes between 5 and 10 km. Condensational heating plays a major role at altitudes below 6 km, and depositional heating is the dominant process at altitudes of 6–12 km.
- (iii)
The simulated total net latent heat release rate during the whole typhoon period is on the order of 1018 J hr−1. Condensation of cloud water is the main source of latent heat release. The main sources of latent heat absorption are the evaporation of rainwater and cloud water. Compared with WSM6, the absolute values of latent heating rates from condensation and evaporation of cloud water are smaller in WDM6, while those from condensation and evaporation of rainwater and deposition and sublimation of cloud ice are considerably larger in WDM6.
- (iv)
Average net latent heat release rates obtained from WSM6 are 1% higher than that of the WDM6 scheme. Compared with the WSM6 scheme, the lower simulated typhoon intensity in WDM6 is a result of the higher levels of simulated latent heat absorption from rainwater evaporation and cloud ice sublimation.
Conflicts of Interest
The authors declare that they have no conflicts of interest.
Authors’ Contributions
Wenfeng Xie designed, performed the experiments, and wrote the original version of manuscript. Xiaodian Shen edited the English. Baolin Jiang carried out the analysis. Wenshi Lin revised the paper and refined the results, conclusion, and abstract. Yang Liu and Gang Wang discussed the results. All authors have approved the final manuscript.
Acknowledgments
This work was supported by the National Natural Science Foundation of China (NSFC; grant nos. 41875168).
Open Research
Data Availability
The authors are grateful to the NCAR Mesoscale and Microscale Meteorology Division for making the WRF model available at http://www.mmm.ucar.edu/wrf/users. The National Centers for Environmental Prediction Final Operational Global Tropospheric Analysis (NCEP-FNL) data were taken from https://rda.ucar.edu/datasets/ds083.2.


