Coupled Insights into Structural, Electronic, and Optical Properties of GeTMS3(TM=Sc, Fe, Zn) Sulfide Perovskite across Different Phases: Ab Initio Study
Abstract
The structural stability analysis of various phases of GeTMS3(TM=Sc, Fe, Zn) sulfide perovskite has been conducted utilizing the WIEN2k package. This investigation leverages density functional theory (DFT) within the full potential linearized augmented plane wave (FP-LAPW) method, employing GGA-mBJ potentials. The focus of this study has encompassed the computation of structural, magnetic, and optical attributes across distinct GeTMS3 phases. These materials have been identified as promising contenders for applications in photovoltaics and spintronics. The study reveals the stability of various phases, with the orthorhombic phase proving energetically favorable for GeScS3 and GeZnS3, and the tetragonal phase for GeFeS3. Magnetic analyses indicate favorable ferromagnetic behavior in GeFeS3 and nonmagnetic characteristics in GeScS3 and GeZnS3. Furthermore, electronic examinations unveil semimetallic and semiconducting behaviors in GeScS3 and GeZnS3 in the tetragonal, respectively, with GeFeS3 exhibiting a half-metallic nature in the orthorhombic phase. Optical properties illustrate their potential as light harvesters, displaying characteristics suitable for energy conversion applications. This study contributes to a deeper understanding of sulfide perovskite properties, offering insights into potential applications in diverse technological fields.
1. Introduction
Energy conversion applications represent highly captivating materials for researchers today. Oxide and fluoride perovskite structures constitute a vast family of compounds with the stoichiometry ABX3. In chalcogenide perovskites, the components A and B represent cations, while X corresponds to a group 6A element [1]. Beginning with Goldschmidt’s initial investigations in 1926 [2], numerous studies have been undertaken to delve into the structural, electronic, and magnetic properties of perovskites, aiming to understand how these properties influence their potential for industrial applications [3–5].
Synthesized thin films of sulfide perovskite hold significant promise as candidates for photoelectron chemical water splitting and tandem solar energy conversion due to their wide bandgap, extensive light absorption, and photoluminescence capabilities [6, 7]. In an experimental study, stable thin films of chalcogenide perovskite were successfully fabricated, demonstrating potential applicability in optoelectronic devices such as photodetectors, light-emitting diodes, and photovoltaics [8]. Understanding the physical and electronic properties of such systems is advantageous to comprehend their potential applications. Perovskites are widely recognized for their diverse applications across various scientific and technological fields, owing to their broad range of electrooptical, mechanical, semiconducting, and insulating behaviors [9, 10].
In recent breakthroughs, researchers have successfully synthesized perovskite sulfides of transition metal chalcogenides. These compounds exhibit energy bandgaps across the infrared to the visible spectrum, showcasing promising attributes such as high absorption coefficients, minimal effective masses, and notable luminescence efficiency. Both experimental and theoretical studies underscore their potential applicability in electronic, optical, and energy conversion technologies. Moreover, compounds like AZrS3 (A=Ba, Sr), LaYS3, and Ba3Zr2S7 have experimentally revealed their direct bandgap nature, featuring bandgap energies ranging from 1.3 eV to 2.0 eV. These materials not only boast high absorption coefficients but also exhibit small effective masses and elevated luminescence efficiency, as demonstrated in recent investigations [11–16].
In a recent computational study focusing on chalcogenides perovskite, the investigation into the structural, optoelectronic, and thermodynamic properties of the SnZrCH3 (CH=S, Se) compounds indicates that these materials exhibit an indirect bandgap nature. The bandgap energies are measured at 1.054 eV and 0.531 eV for SnZrS3 and SnZrSe3, respectively, at the mBJ-GGA level. Furthermore, calculations of optical absorption parameters highlight their possession of the highest absorption coefficients in the ultraviolet (UV) region. Hence, the findings suggest that both SnZrS3 and SnZrSe3 compounds hold promise as potential candidates for photovoltaic applications [17].
Recently, we have undertaken a comprehensive exploration of various perovskite types. In a theoretical analysis of TMScO3 (TM = 3d transition metal), we delved into the influence of 3d orbital filling on the bandgap. Significantly, our findings revealed a maximum bandgap of 5.496 eV for CrScO3 [18]. Furthermore, we conducted a theoretical investigation into the impact of doping rare earth Eu ions into Sr1-xEuxLiF3 and Ca1-xEuxLiF3 fluoroperovskite systems. Intriguingly, all doped compounds exhibited 100% spin polarization at the Fermi level, displaying a spin half-metallic behavior with potential application in spintronics [19, 20].
In this paper, we focus on a comprehensive analysis of the structural, electronic, magnetic, and optical properties of GeTMS3 sulfide perovskite across different phases. This investigation aims to contribute valuable insights into the intricate nature of these materials, providing a basis for their utilization in diverse technological fields.
2. Calculation Method
We employed the density functional theory (DFT)—full potential linearized augmented plane wave (FP-LAPW) method for our calculations [21], which was implemented using the WIEN2k package [22]. In our approach, we utilized both the generalized gradient approximation (GGA) [23] and the modified Becke-Johnson (mBJ) potential [24]. The chosen cutoff energy parameters were set to 16 Ryd for the plane waves in the interstitial region and 169 Ryd for the muffin-tin potential itself. This corresponds to a wave function expansion up to lmax = 10 within the muffin tins and up to lmax = 4 outside them. Furthermore, the charge density was Fourier-expanded to Gmax = 12. The core energy cutoff was set at –6.0 Ryd.
For k-point sampling within the irreducible Brillouin zone (IBZ), we employed a Monkhorst-pack grid of 14 × 14 × 14 points for the cubic structure, with an equivalent number of points for the tetragonal and orthorhombic structures. Notably, a densely populated k-mesh of 8000 points was utilized for calculating optical properties. All structures underwent complete relaxation until the atomic forces were less than 1 mRy/bohr.
A charge convergence test was carried out with a tolerance of 0.0001 electron charge. The lattice constant was determined by optimizing the structure using the Murnaghan equation of state [25]. To calculate the density of states (DOS), we utilized the tetrahedron method with Blöchl corrections [26].
3. Results and Discussion
3.1. Structural, Electronic, and Magnetic Properties
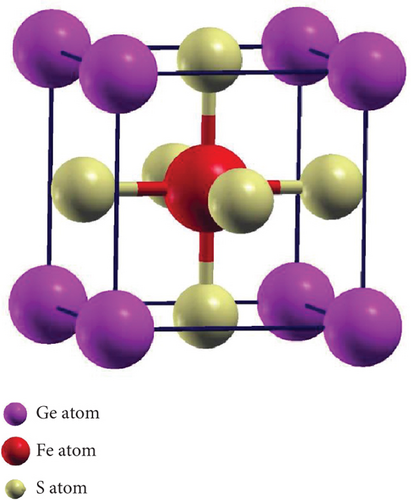
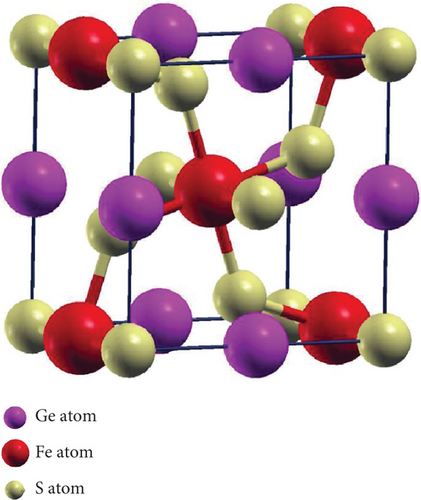
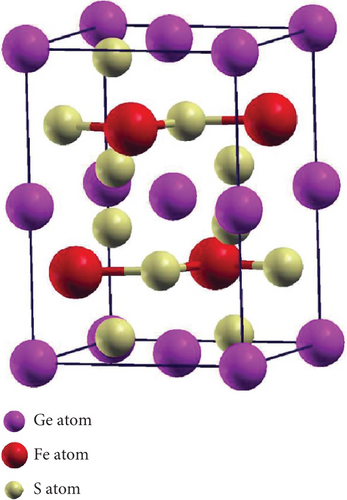
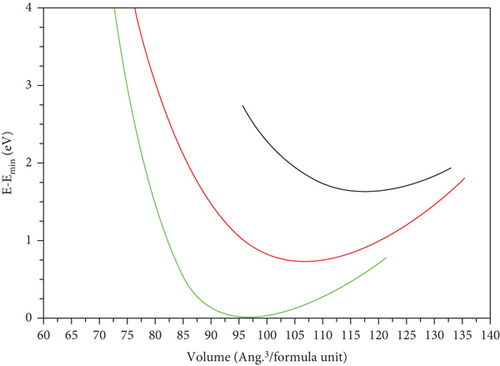
The perovskite structure can manifest in various crystallographic arrangements [2]. In this investigation, we focus on the three space groups, cubic (221-Pm-3m), tetragonal (127-P4/mbm), and orthorhombic (62-Pnma), as illustrated in Figure 1. For the cubic phase, we performed volume optimization, while for the tetragonal phase, optimization was conducted for both volume and c/a ratio, interchanging parameters to achieve the most stable configuration. Similarly, in the case of the orthorhombic phase, we optimized volume, c/a ratio, and b/a ratio by sequentially fixing two parameters in each trial and determining the third, as outlined in Table 1. In Figure 2, we present the calculated energy plotted against the volume per formula unit, fitted to the Murnaghan equation of state. The energetically favorable phases, which exhibit the lowest energy, are the orthorhombic phase for GeScS3 and GeZnS3, and the tetragonal phase for GeFeS3.
| Structure | Phase space group | a (Å) | b (Å) | c (Å) | RMT | ||
|---|---|---|---|---|---|---|---|
| Ge | TM | S | |||||
| GeScS3 | 221-Pm-3m | 4.901 | 4.901 | 4.901 | 2.0 | 1.6 | 1.6 |
| 127-P4/mbm | 6.416 | 6.416 | 5.186 | 1.8 | 1.8 | 1.7 | |
| 62-Pnma | 6.624 | 9.150 | 6.407 | 1.8 | 2.1 | 1.6 | |
| GeFeS3 | 221-Pm-3m | 4.536 | 4.536 | 4.536 | 1.8 | 2.0 | 1.7 |
| 127-P4/mbm | 6.109 | 6.109 | 4.608 | 1.8 | 1.8 | 1.7 | |
| 62-Pnma | 6.528 | 9.222 | 6.230 | 1.8 | 2.1 | 1.6 | |
| GeZnS3 | 221-Pm-3m | 4.671 | 4.671 | 4.671 | 1.8 | 2.1 | 1.8 |
| 127-P4/mbm | 6.109 | 6.109 | 5.262 | 1.8 | 1.8 | 1.8 | |
| 62-Pnma | 6.624 | 9.220 | 6.252 | 1.9 | 2.1 | 1.7 | |
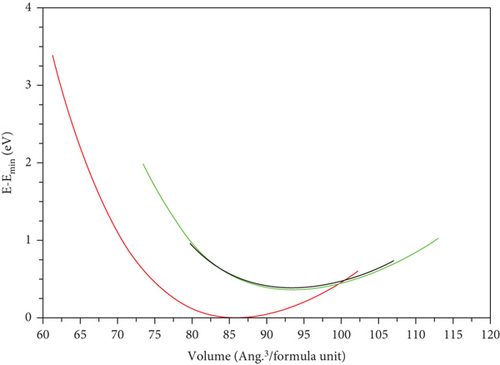
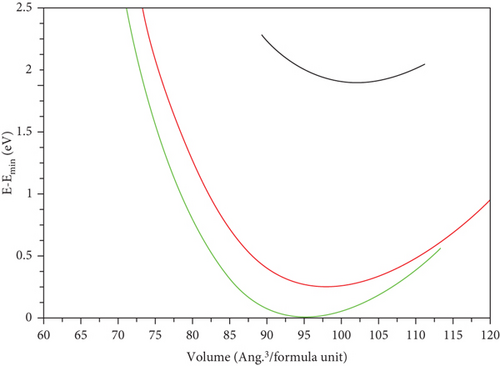
Due to the absence of available experimental data, we assume an equal likelihood for each phase to occur naturally, pending experimental evidence to validate our predictive findings.
Our analysis of the studied compounds considers each structural space group in three magnetic phases: ferromagnetic (FM), antiferromagnetic (AFM), and nonmagnetic (NM) phases. Table 2 illustrates the EFor values for each structure. It is evident that the most stable structure (highlighted in yellow) and the corresponding (nonmagnetic) 62-Pnma for both GeScS3 and GeZnS3 and the magnetic phase occur at (FM) 127-P4/mbm for GeFeS3.
| Phase | Magnetic phase | EFor (Ry/atom) | ||
|---|---|---|---|---|
| GeScS3 | GeFeS3 | GeZnS3 | ||
| 221-Pm-3m | FM | -4.125642 | -2.654974 | 0.383643371 |
| AFM | -4.129842 | -0.790936 | 0.392199707 | |
| NM | -4.925742 | -0.794163 | 0.12258207 | |
| Magnetic stable phase | NM | FM | NM | |
| 127-P4/mbm | FM | -4.936249 | -2.657930 | 0.106964112 |
| AFM | -2.288956 | -0.704256 | 0.370307583 | |
| NM | -2.288955 | -0.707653 | -0.301571869 | |
| Magnetic stable phase | FM | FM | NM | |
| 62-Pnma | FM | -1.938481 | -2.646873 | 0.113675 |
| AFM | -0.878480 | -0.644178 | 4.76367537 | |
| NM | -4.951581 | -0.663400 | -0.350513 | |
| Magnetic stable phase | NM | FM | NM | |
We have reevaluated our GeFeS3 calculations by consistently applying Hubbard’s correction through the mBJ + U approach across all space groups for the most favorable magnetic phases. The effective potential, sourced from literature and set at 2.2 eV [28], has been implemented at the iron (Fe) atom site. Despite the use of mBJ + U, the overall conclusion regarding this compound remains unchanged. The marginal variations observed in the total energy and formation energy of the compound are minimal, essentially rounding to zero. Additionally, all other deductions related to the band structure and density of states remain consistent (refer to Tables 3 and 4).
| Phase | Etotal (Ry/unit cell) | EFor (Ry/atom) | ||
|---|---|---|---|---|
| mBJ | mBJ ± U | mBJ | mBJ ± U | |
| 221-Pm-3m | -9121.147677 | -9121.123864 | -2.654974207 | -2.6502116 |
| 127-P4/mbm | -18242.3249 | -18242.2846 | -2.65793023 | -2.65390277 |
| 62-Pnma | -36484.4287 | -36484.4146 | -2.64687303 | -2.64616861 |
| Structure | Phase | TM | Ge | S | Interstitial | Mt (μB/F.U) | Mt (μB/F.U) using mBJ + U |
|---|---|---|---|---|---|---|---|
| GeScS3 | 221-Pm-3m | NM | — | ||||
| 127-P4/mbm | -0.06216 | 0.00004 |
|
-0.88881 | 1.694 | — | |
| 62-Pnma | NM | — | |||||
| GeFeS3 | 221-Pm-3m | 2.80437 | 0.02407 | 0.25796 | 0.51649 | 4.071 | 4.059 |
| 127-P4/mbm | 3.10764 | 0.02080 |
|
0.53229 | 3.601 | 3.51 | |
| 62-Pnma | 3.52372 | 0.00493 |
|
1.25095 | 4.001 | 4.007 | |
| GeZnS3 | NM | — | |||||
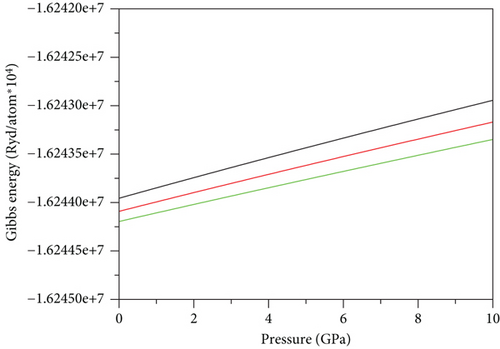
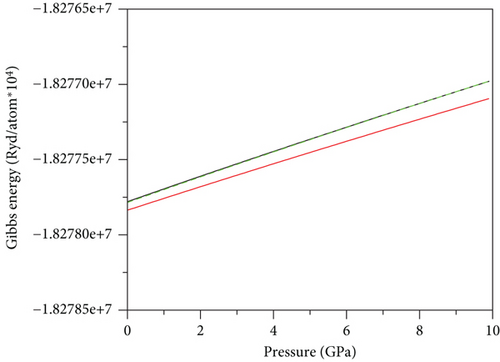
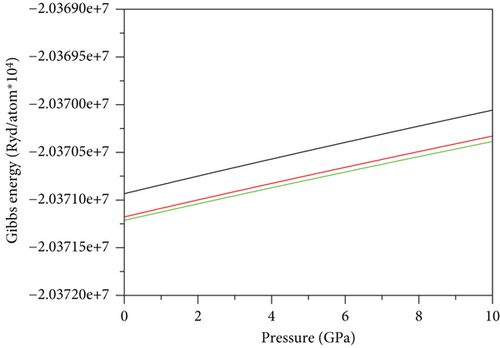
In circumstances of exceedingly low temperature (absolute zero) and fixed N, as is the case here, dG/dP = V. From Figures 3(a) and 3(c), it becomes evident that the orthorhombic phase is the most stable for GeScS3 (GeZnS3). Conversely, for GeFeS3, the tetragonal phase exhibits the highest stability (Figure 3(b)). This assertion is derived from the fact that these phases correspond to the shallowest lines. Notably, the calculations of Gibbs free energy align seamlessly with the Murnaghan equation of state, in regard to the stability of the structure.
The spin magnetic moments have been documented in Table 4. The magnetic behavior of the material is predominantly governed by the presence of the 3d-TM atom in site B, and this behavior is intricately tied to factors such as the unoccupied 3d orbitals, the local environment of neighboring atoms, and bond lengths [18]. The examined compounds undergo analysis in three magnetic phases for each space group: ferromagnetic (FM), antiferromagnetic (AFM), and nonmagnetic (NM) as outlined in Tables 2 and 3. As previously mentioned, the most reliably predicted stable phases manifest as ferromagnetic (FM) in 127-P4/mbm for GeFeS3 and nonmagnetic (NM) in 62-Pnma for both GeScS3 and GeZnS3. Notably, the antiferromagnetic (AFM) calculations reveal a complete disappearance of magnetic moment in all compounds. The unfavorable nature of the AFM phase is evident through the formation energy calculations.
In GeScS3, the magnetic properties are absent for both the cubic (221-Pm-3m) and orthorhombic (62-Pnma) phases. However, in the tetragonal phase (127-P4/mbm), magnetism is observable. Note that the magnetism at the interstitial region is higher than that at the atomic sites; this can be attributed to the hybridization of orbitals, especially involving transition metal elements like Sc, which can contribute to magnetic moments. The interaction of the atomic orbitals in the interstitial region may lead to localized magnetic effects.
Conversely, in the GeFeS3 compound, all phases exhibit fairly comparable ferromagnetic behavior, as anticipated, and this behavior is predominantly attributed to iron atom sites. The contributions from Ge and S atoms are minimal and bear negligible values. The contribution of interstitial magnetic moments varies mainly due to fluctuations in the local environment of nearest neighbors. The calculation of the total magnetic moment using mBJ + U at the Fe atom site shows an insignificant variation, as mentioned earlier. It is worth noting that the mapping of magnetic moments can be complex and is often linked to the intricate interactions that transition metal ions exhibit within specific coordination environments involving chalcogenide atoms, such as sulfur in this case [30]. For the GeZnS3 compound, magnetism is absent across all phases and scenarios.
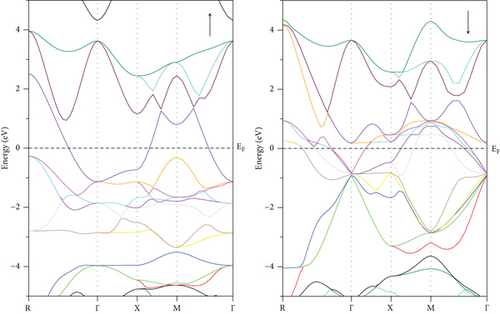
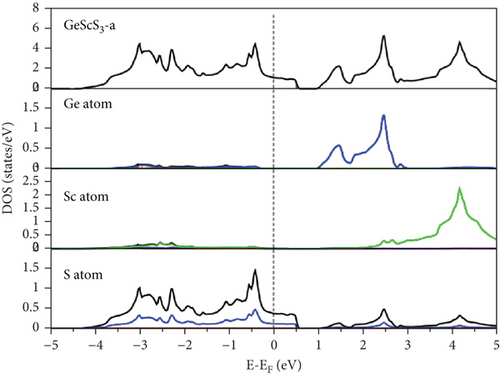
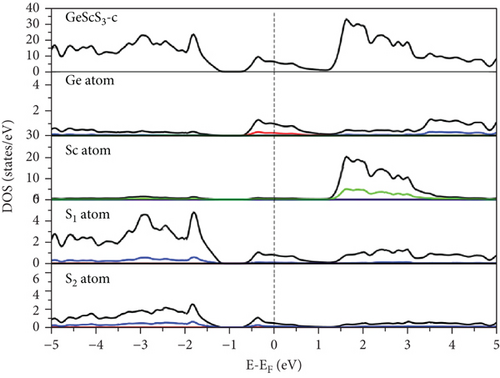
The energy bandgap (Eg) and electronic density of states (DOS) have been thoroughly examined for all structures across various phases. GeScS3 displays metallic behavior in all phases. However, an interesting conduction band intersection with EF is observed in the spin-up channel of the tetragonal phase, categorizing the compound as a semimetal (Figure 4).
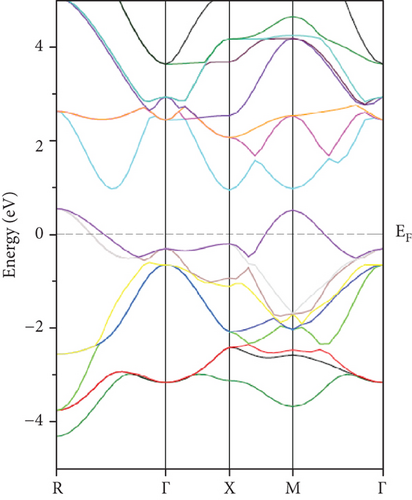
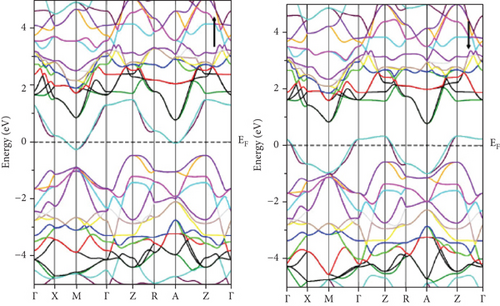
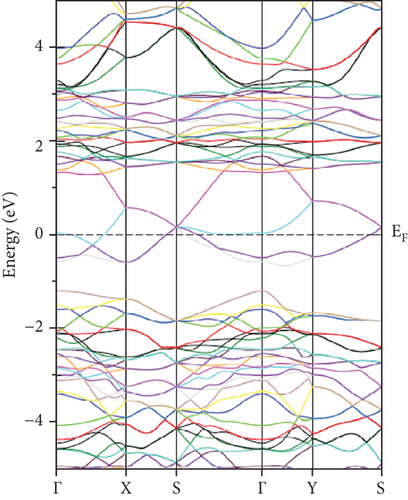
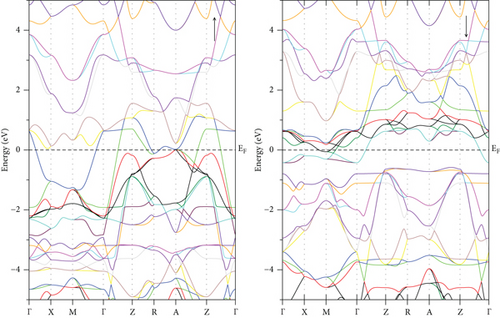
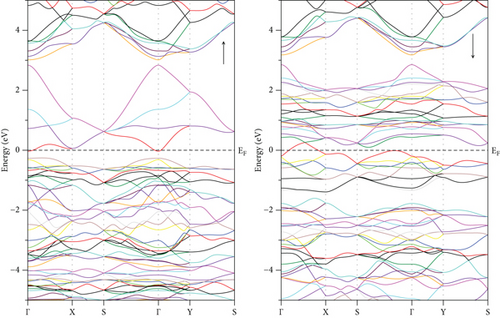
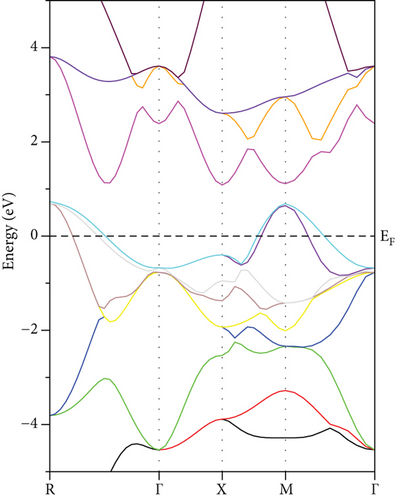
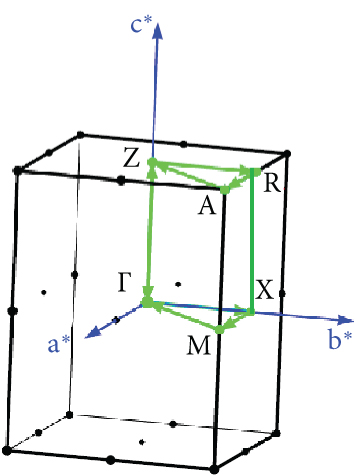
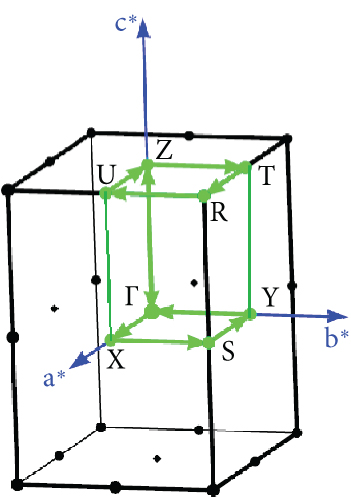
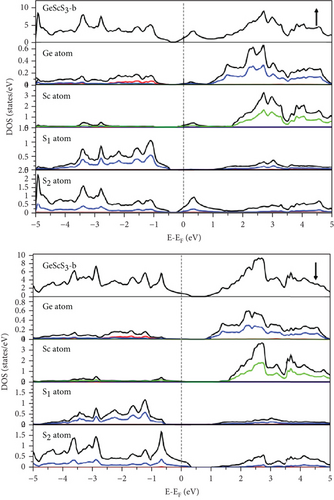
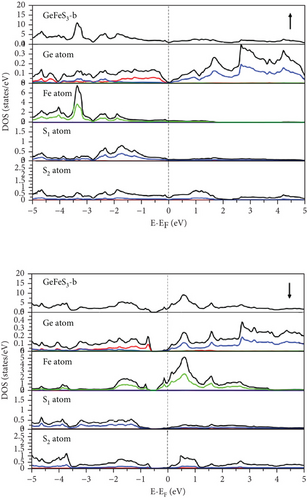
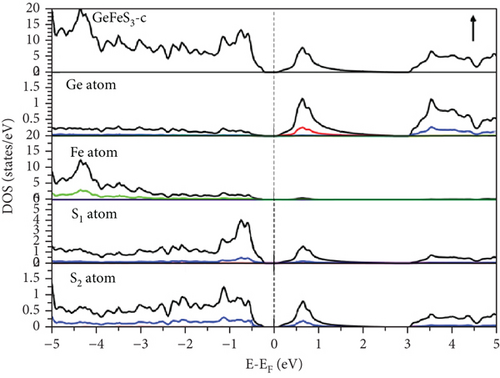
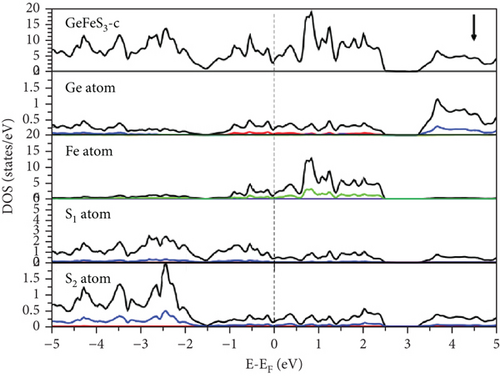
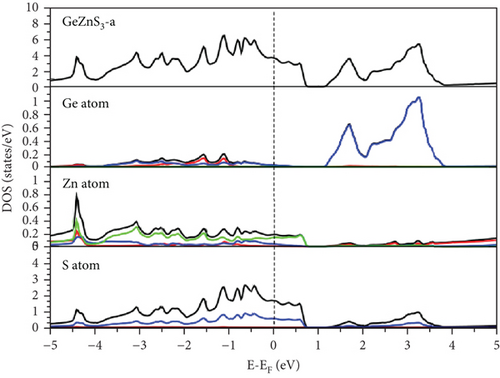
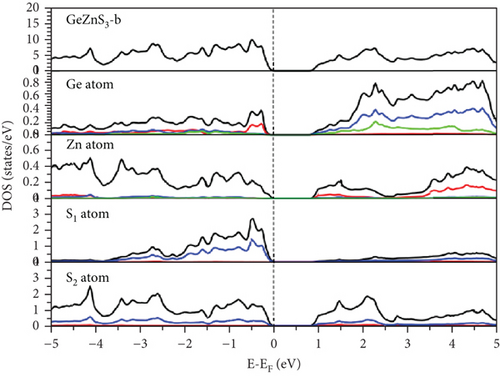
For GeFeS3, the energy band structure unveils a direct (Γ − Γ) bandgap of 0.235 eV solely in the orthorhombic phase within the spin-up channel (Figure 5(c)); meanwhile, this compound shows metallic behavior in the other space groups like cubic and tetragonal (Figures 5(a) and 5(b)). Conversely, a semiconducting characteristic is demonstrated by an indirect (X − Z) bandgap of 0.827 eV within the tetragonal phase of GeZnS3 (Figure 6(b)) and metallic behavior in the other phases (Figures 6(a) and 6(c)). In order to ensure the accuracy of band structure calculations, specific paths were adopted, such as (Γ-X-M-Γ-Z-R-A-Z-Γ) and (Γ-X-S-Γ-Y-S) for the tetragonal and orthorhombic phases, respectively, as depicted in Figure 7.
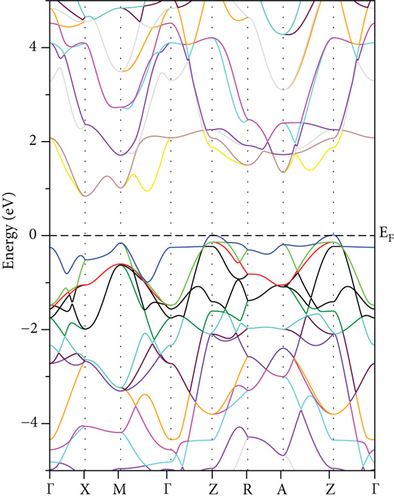
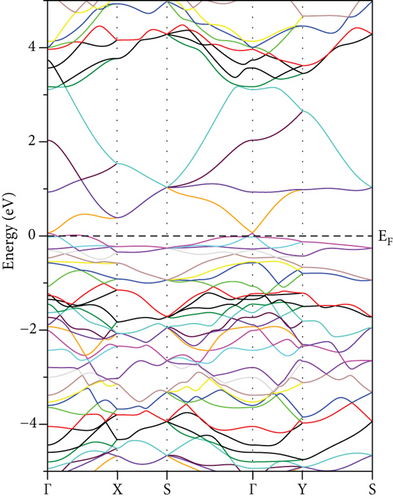
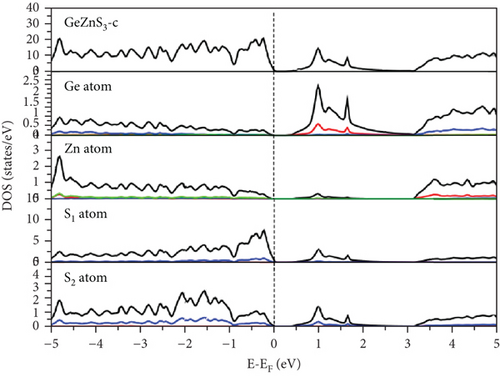
Examination of the total and partial density of states (TDOS and PDOS) reveals that the PDOS concentrated around or near EF is primarily influenced by the S-p orbital and the TM-d orbital (Figures 8, 9–10). Eventually, GeFeS3 exhibits half-metallic behavior in the orthorhombic phase, displaying 100% spin polarization at EF, a feature that renders this material suitable for utilization in the spintronic industry. Conversely, the tetragonal phase of GeZnS3 displays semiconducting behavior.
3.2. Optical Properties
The intricate dielectric function, denoted as ε(ω) and composed of its two constituent parts ε1(ω) and ε2(ω), is meticulously explored for the studied phases employing the Kramer-Kronig relations [31, 32]. In this context, ε1(ω) and ε2(ω) signify the real and imaginary components of ε(ω), respectively. By incorporating the function ε(ω) into the Kramer-Kronig relations, it becomes possible to compute a range of spectra including the refractive index n(ω), reflectivity R(ω), absorption I(ω), and energy loss Eloss(ω), utilizing equations 49 to 54 as referenced in [33].
These spectra are acquired along both the xx and zz directions for cubic and tetragonal phases, which are notably identical within the cubic phase. However, for the orthorhombic phase, the analysis extends along the xx, yy, and zz directions, showcasing an anisotropic behavior.
The imaginary component of the dielectric function, ε2(ω), is depicted in Figure 11. Evidently, all studied structures across their various phases may exhibit characteristics of a light harvester, as the spectra consistently maintain positive and nonzero values throughout the entire energy range under investigation [34]. As expected, the material’s behavior is isotropic in the cubic phase, in contrast to the other phases.
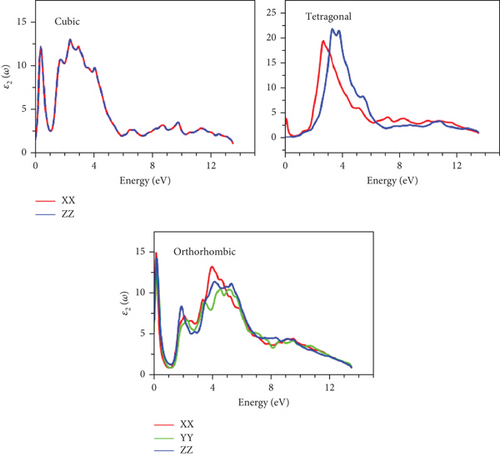
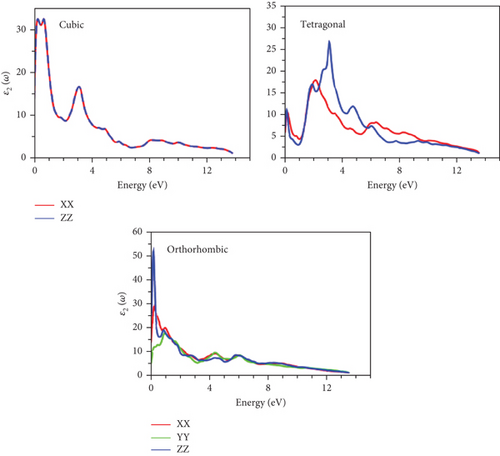
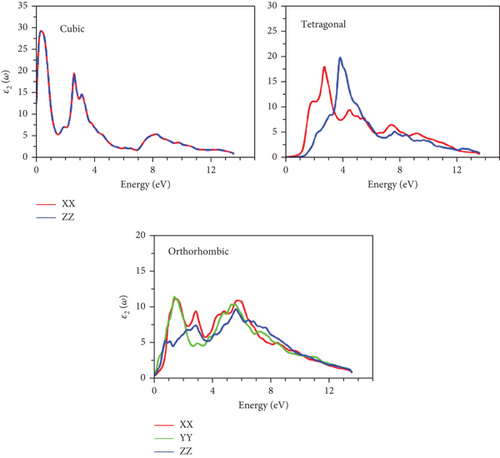
Prominent peaks, identifiable across all phases, are positioned below the 4 eV energy threshold, primarily arising from interband transitions involving the p-orbital of the Ge atom and the d-orbital of the TM (Sc, Fe, Zn) atom. Static ε2(0) values are presented in Tables 5–7. The highest ε2(0) values are observed in the semiconductor phase, which is orthorhombic for both GeScS3 and GeFeS3 and tetragonal for GeZnS3. This suggests that these structural configurations could potentially serve as efficient light harvesters.
| Phase | Direction | ε1(0) | ε2(0) | n(0) | R(0) |
|---|---|---|---|---|---|
| 221-Pm-3m | xx | 21.2 | 7.70 | 12.5 | 0.42 |
| 127-P4/mbm | xx | 15.0 | 1.90 | 3.90 | 0.35 |
| zz | 11.0 | 0.20 | 3.30 | 0.29 | |
| 62-Pnma | xx | 26.9 | 6.80 | 5.20 | 0.47 |
| yy | 24.8 | 5.30 | 5.0 | 0.45 | |
| zz | 27.40 | 6.40 | 5.3 | 0.47 | |
| Phase | Direction | ε1(0) | ε2(0) | n(0) | R(0) |
|---|---|---|---|---|---|
| 221-Pm-3m | xx | 65.60 | 13.6 | 8.10 | 0.61 |
| 127-P4/mbm | xx | 30.10 | 5.80 | 5.50 | 0.48 |
| zz | 31.20 | 6.90 | 5.60 | 0.49 | |
| 62-Pnma | xx | 60.50 | 13.9 | 7.80 | 0.60 |
| yy | 36.0 | 5.50 | 6.10 | 0.51 | |
| zz | 79.50 | 26.10 | 9.10 | 0.65 | |
| Phase | Direction | ε1(0) | ε2(0) | n(0) | R(0) |
|---|---|---|---|---|---|
| 221-Pm-3m | xx | 54.80 | 1.70 | 7.50 | 0.59 |
| 127-P4/mbm | xx | 46.80 | 0.20 | 3.70 | 0.33 |
| zz | 43.30 | 0.10 | 3.20 | 0.27 | |
| 62-Pnma | xx | 15.80 | 0.40 | 4.00 | 0.36 |
| yy | 17.00 | 0.70 | 4.10 | 0.37 | |
| zz | 13.80 | 0.50 | 3.70 | 0.33 | |
Conversely, the real component, ε1(ω), is illustrated in Figure 12. It is evident that all compounds exhibit metallic behavior as the spectrum transitions into negative values. This phenomenon is observable for GeScS3 across both cubic and tetragonal phases within the energy range of 4 to 8 eV. Similarly, the same metallic trend emerges for the orthorhombic phase beyond 6 eV. In the case of GeFeS3 and GeZnS3, the manifestation of metallicity is observed in energy intervals of 3-6 eV, 3-8 eV, and beyond 8 eV for cubic, tetragonal, and orthorhombic phases, respectively. The static constant values of ε1(0) are outlined in Tables 5–7, reflecting distinct values across various directions for each phase. Obviously, the highest value is anticipated in the zz-directions of both orthorhombic GeScS3 and GeFeS3. In the case of cubic GeZnS3, the largest ε1(0) is found.
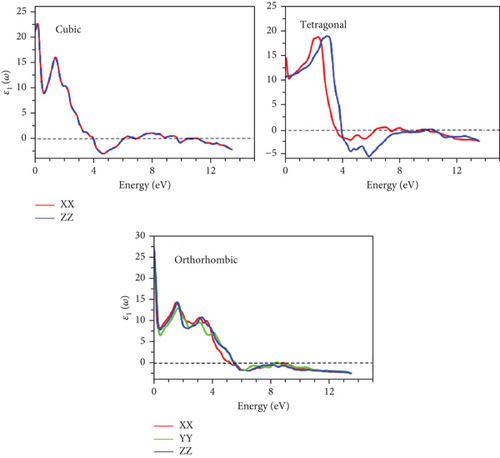
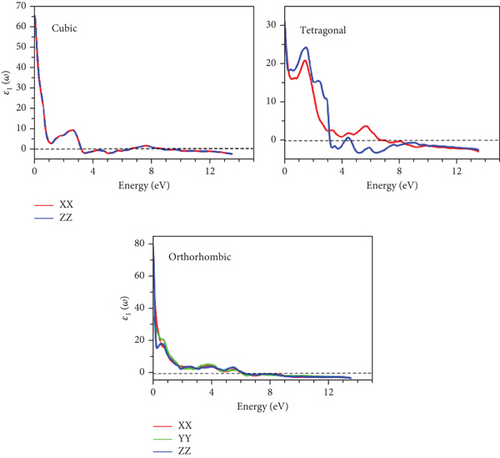
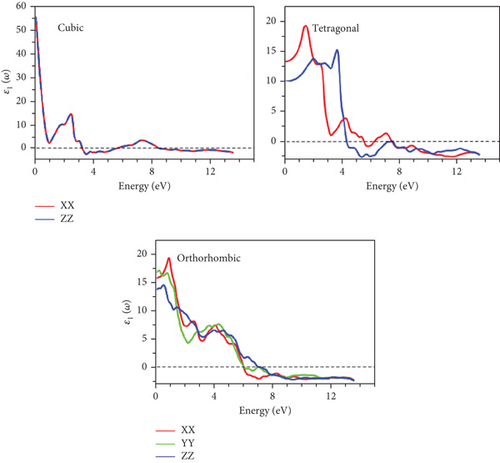
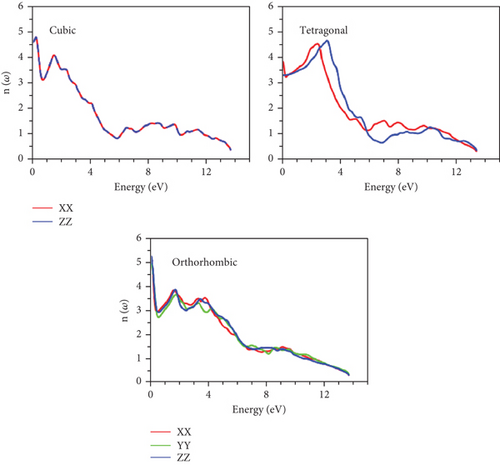
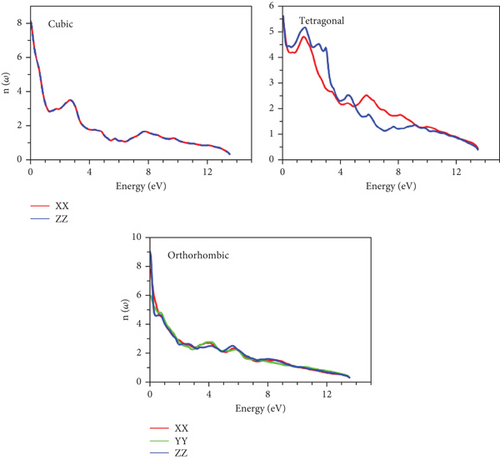
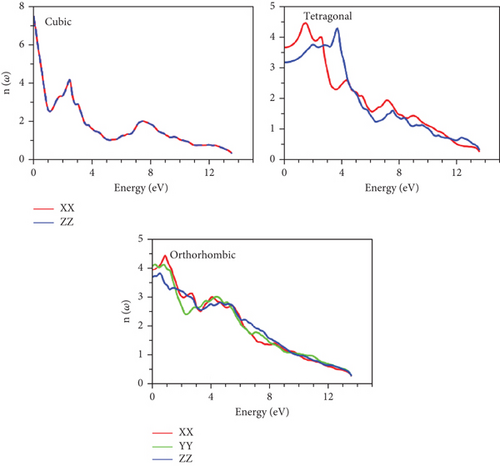
The interaction of light with matter is closely linked to the refractive spectrum, which reveals how much light is bent as it traverses a material. It is important to note that the static refractive indices vary across phases, as detailed in Table 5. Notably, the highest static refractive indices are predominantly associated with cubic phases.
Furthermore, prominent peaks are consistently identified in various directions for different phases, predominantly occurring below the 4 eV energy threshold. The refractive spectra reveal resonance in this region, resulting from intraband transitions. As energy levels rise, refractivity decreases, corresponding to the onset of negative values in ε1. This marks the initiation of metallic behavior, as depicted in Figures 12 and 13.
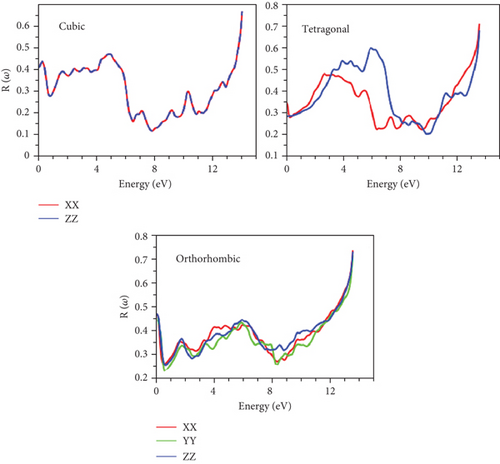
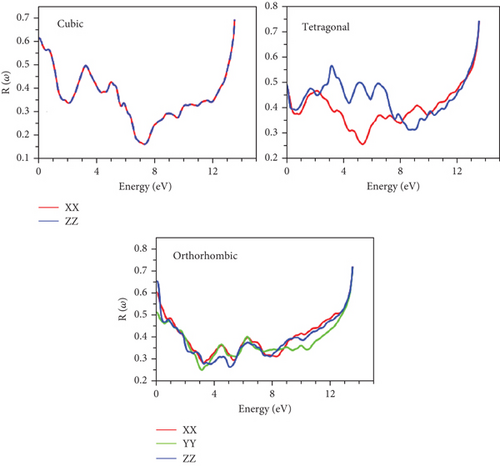
In Figure 14, the static reflectivity R(0) is computed, revealing values below unity for all phases, as indicated in Table 6. Remarkably, these static values experience a rapid decline within the low energy range, with the lowest points situated in this region. This characteristic renders the material a promising absorbent within this energy range, making it potentially suitable for photovoltaic applications. A significant surge in reflectivity is observed in higher energy regions and beyond, aligning with the manifestation of metallic behavior. This correspondence between the rapid increase in reflectivity and the emergence of negative values in ε1 reaffirms the presence of metallicity [35].

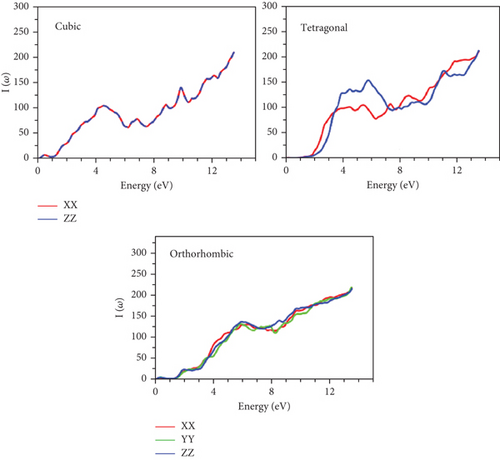
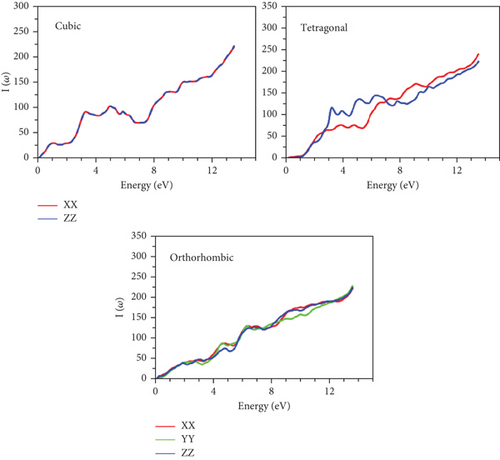
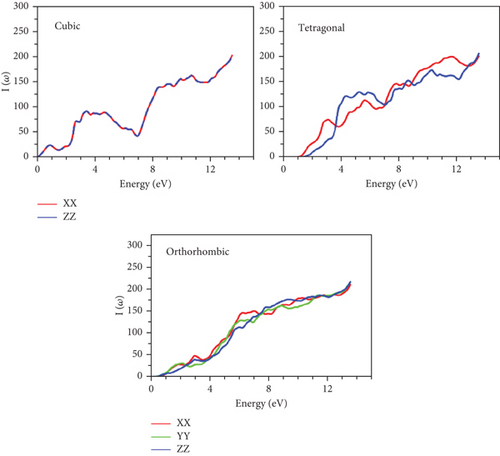
The absorption process unfolds when the energy of the bandgaps falls below that of the incident photon. As illustrated in Figure 15, the spectral components of the absorption coefficient I(ω) are showcased for each material. Characterized by three components (x, y, and z), the overall profiles of these spectra exhibit a consistent pattern across our various compounds. Upon closer inspection of the curve features, a noticeable trend emerges—the initial stages of absorption witness a surge in spectra energies aligned with the optical gap in the orthorhombic configurations for GeScS3 and GeFeS3, as well as the tetragonal structure for GeZnS3. Interestingly, the absorption spectra extend into both the visible and ultraviolet spectra. This behavior suggests the potential suitability of these materials, positioning them as promising candidates for applications such as the window layer in solar cells and flat-panel displays.
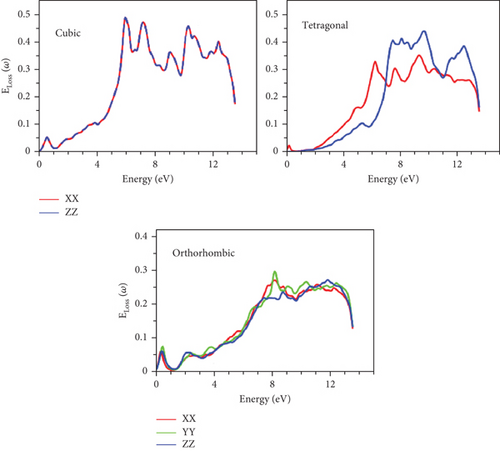
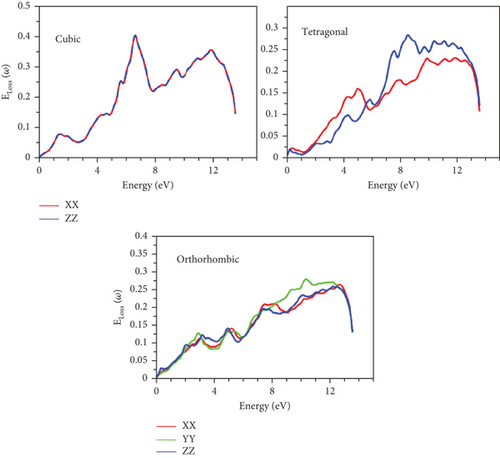
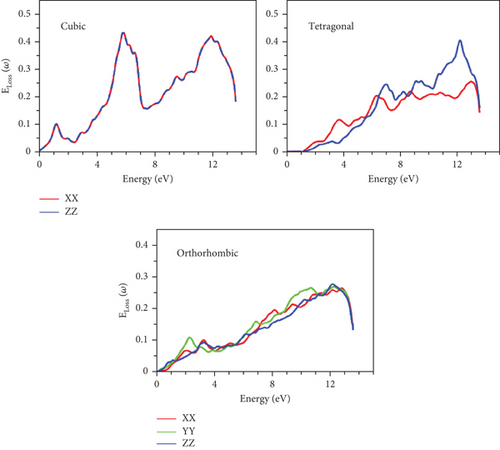
The quantification of energy absorbed through the material is effectively represented by the Eloss function, as depicted in Figure 16. Conspicuously, the minimum Eloss values are consistently situated below 4 eV for all phases, aligning with the anticipated maxima of the refractive function n(ω). As energy levels surpass 4 eV, Eloss experiences an increment, consistent with the concurrent rise in refractivity within that energy range.
4. Conclusion
In conclusion, this comprehensive study has delved into the structural, electronic, magnetic, and optical properties of sulfide perovskite GeTMS3(TM=Sc, Fe, Zn) across its cubic, tetragonal, and orthorhombic phases. Through extensive calculations employing DFT-FP-LAPW methods and GGA-mBJ potentials, we have gained valuable insights into the behavior and characteristics of these materials.
The investigation has revealed intriguing findings regarding the stability and behavior of various phases. The energetic calculations, cohesive energy values, and Gibbs free energy analysis have provided a comprehensive understanding of the most stable phases for different compositions. The examination of magnetic behavior has elucidated the influence of transition metal atoms, with GeZnS3 and GeScS3 exhibiting nonmagnetic behavior, while GeFeS3 showcases ferromagnetic properties across all phases, particularly at iron atom sites.
The electronic properties, including the energy bandgaps and density of states, have highlighted the semiconducting and metallic behaviors exhibited by different phases. Particularly notable is the half-metallic behavior observed in the orthorhombic phase of GeFeS3, making it a promising candidate for spintronic applications.
The investigation of optical properties showcased the potential of these materials as light harvesters, with positive and nonzero ε2(ω) spectra indicative of their suitability for energy conversion applications. Refractive indices varied with phases, with cubic phases often exhibiting the highest static refractive indices. The presence of metallic behavior was consistent with the negative values of ε1(ω), while absorbent characteristics in the low energy range marked these materials as potential candidates for photovoltaic applications.
In summary, our study sheds light on the multifaceted nature of sulfide perovskite GeTMS3, offering valuable insights into their properties and potential applications in various technological fields. Our findings place a strong emphasis on the contemporary applications of sulfide perovskites, shedding light on their practical relevance in current technological landscapes. By closely examining their performance in diverse applications such as photovoltaics and spintronics, we aim to not only enrich our understanding of these materials in their present context but also pave the way for future advancements. Our exploration of current applications serves as a foundation for unraveling the untapped potential of sulfide perovskites, offering a comprehensive perspective that extends beyond the immediate present into the promising future of materials science and technology.
Disclosure
We, the authors of this manuscript, hereby affirm the originality of our submitted work. The raw data for this study were produced at the University of Jordan.
Conflicts of Interest
The authors declare that they have no conflicts of interest.
Open Research
Data Availability
The data supporting the conclusions of this research are accessible from the corresponding author upon making a reasonable request.


