IGWO-VINC Algorithm Applied to MPPT Strategy for PV System
Abstract
As a kind of inexhaustible renewable energy, solar energy is popular, and photovoltaic power generation has been paid attention to by all circles. However, determining the global maximum power point (GMPP) is difficult under external ambient temperature and light intensity change, and MPPT control technology becomes the key to research. Fast, accurate, and stable GMPP capture has become a hot research problem in PV power generation systems. The GWO algorithm incorporating the Levy flight function and the INC using the vertex as the dividing point with different step sizes on the left and right sides are combined and applied to the MPPT control strategy of PV systems. The global search is completed by IGWO first, and then the exact search is completed by the improved INC when it is close to the global optimum. The final tracking accuracy is above 99%, and compared with the GWO, INC, and ICS-IP&O algorithms, respectively, in the case of abrupt changes, the tracking time is accelerated by 0.021 s on average. The oscillation amplitude is smaller, and the voltage is more stable.
1. Introduction
In recent years, the traditional fossil energy reserves are decreasing, the pollution problem is becoming increasingly prominent, and to solve global warming and the energy crisis, the use of renewable energy to replace fossil fuels such as oil and energy is an inevitable trend. The international community has also made great efforts to this end for the use of solar energy and wind energy, the energy-related sectors of the legislation to support [1], which can be seen as a safe and environmentally friendly easy way to obtain a new type of renewable energy to be valued [2]. According to the International Energy Agency (IEA), global energy consumption will increase by 44% between 2006 and 2030. In this context, photovoltaic (PV) power generation is a potentially sustainable technology that continues to drive the world’s energy transformation. Photovoltaic power generation continues to develop and grow, and its power generation form and range are increasing. Facing the external environment, changes in the situation are more complex. To ensure that photovoltaic power generation is always maintained at the global maximum power point is more difficult, and the current use of more traditional control technology for tracking makes it easy to fall into the local optimal point, which seriously reduces the output power of the photovoltaic panels [3, 4]. Most smart algorithms or fusion techniques have high algorithmic complexity and relatively slow tracking speeds. Therefore, to improve the efficiency of grid-connected photovoltaics, whether the system can quickly locate the GMPP under changing external conditions is an urgent problem to be solved.
To effectively solve this problem, many scholars have conducted extensive research, such as comparative analyses of the incremental method of conductivity (INC) is shown in the Algorithm 1 and the perturbation and observation (P&O) method [5]. The literature [6] proposed a new hybrid MPPT based on the incremental conductance algorithm and the integral backstepping controller. The hybrid scheme exploits the benefits of the INC algorithm in seeking the maximum power voltage. It feeds a nonlinear integral backstepping controller whose stability was ensured by the Lyapunov theory. The effectiveness of the proposed technique is justified in terms of power tracking accuracy and average efficiency. And the literature [7–9] based on the INC method using, respectively, adaptive scaling factor-based artificial neural network assisted, imperfect partial differential theory partitioned variable step, integrator variable step, and stepless voltage perturbation superimposed adaptive methods were improved to obtain the new variable step INC method. The tracking process is improved in terms of accuracy, speed, and stability, and the circuit loss power is reduced, but when the external environment changes, these tracking methods are relatively easy to fall into the position of local optima. Although the improved traditional methods can respond under abruptly changing environmental conditions, the environmental conditions change with diverse complexity, and the INC and P&O algorithms with variable step size and adaptive control still cannot track the GMPP accurately and rapidly and are prone to falling into the local optimum. Consequently, various biointelligence algorithms such as the simplified ant colony algorithm [10], particle swarm algorithm [11], improved seagull optimization algorithm [12], and improved gray wolf optimization algorithm [13] have been used in the MPPT technique to track GMPP. To a certain extent, GMPP can be tracked accurately and quickly, but it is difficult to track the GMPP in a variable environment, and the complexity of the algorithm is high compared to the improved traditional method. The gray wolf optimization (GWO) algorithm [14] has fewer adjustment parameters, strong convergence, and better global and local equilibrium capabilities compared to these biomass algorithms, and it is used in many fields such as power system parameter optimization, shop scheduling problems, and image fusion optimization. Li et al. [13] proposed a control method based on an improved GWO algorithm to track GMPP, which has improved the tracking speed, time, and efficiency of the traditional method. A combination of the IGWO (improved gray wolf optimization algorithm) and IP&O (improved perturbation observation method) MPPT control algorithm for PV power generation is proposed by Mirjalili et al. [15] for the local shadow problem, and the simulation yields fast-tracking speed, better dynamic and steady-state accuracy of power output under different shadow conditions, and the ability to effectively cope with the changes of the external environment. Pang et al. [16] modified an IGWO-golden section hybrid control algorithm, which first performs a global search using the improved GWO algorithm to determine the approximate location of the GMPP and then performs a local search using the golden partition algorithm based on the previous search. The coordination between global and local search is achieved by using different control strategies at different stages. Zhang [17] designed an improved GWO-cuckoo (MGWO-CS) hybrid algorithm that was applied to PV MPPT control, and the test results showed that the MGWO-CS algorithm has fast-tracking speed and high search accuracy and can effectively track the MPP when applied to MPPT control, which has positive significance to increase the efficiency of PV arrays power efficiency. Cai [18] presented the DE-GWO algorithm with a two-layer structure of MPPT technology, placing the differential evolution algorithm and the GWO algorithm in the subsidiary layer and the main layer, respectively, and using turnover and feedback to make the two groups of algorithms work together to search for the duty cycle that maximizes the output power of the PV system to achieve better tracking results. All the above four algorithms fused with GWO have achieved better tracking results and can quickly search for the GMPP in the multipeak curve of a changing environment; however, the fused algorithm is more complicated and has more parameters, which requires higher accuracy of power generation components and increases the cost of power generation. Yang and Miao [19] use a particle swarm algorithm to optimize the INC step size, and the tracking effect reaches 99.07%, and it is tested in grid connection to obtain a better tracking effect. The FO-INC method of metaheuristic optimization was proposed by Ibrahim et al. [20], and the tracking speed was accelerated under different climatic conditions. Recently, the ICS-IP&O hybrid method proposed by Xu et al. [21], which combines improved intelligent algorithms with improved traditional methods, is also aimed at improving the output power of photovoltaic systems under local shading conditions. According to the above introduction, the traditional methods have low tracking complexity but easily fall into local optimization, the intelligent methods have strong local and global balancing ability but higher complexity and longer tracking time, and the combination of multiple intelligent methods with high complexity and equipment requirements cannot well guarantee the low-cost, rapid, and efficient tracking of the GMPP under dynamic external conditions.
-
Algorithm 1: IGWO-VINC Operation Process.
-
initialize the grey wolf population Xi(i=1,2,3, ……)
-
initialize a, A, C, n=0, duty cycle
-
calculate the fitness of each search agent
-
X(α)=the best search agent
-
X(β)=the second search agent
-
X(δ)=the third search agent
-
while (n<max number of iterations)
-
sample Upv, Ipv, Ppv
-
for each search agent
-
update the position of the current search unit according to formula (9)
-
end for
-
update a, A, C
-
update X(α),X(β),X(δ)
-
n=n+1
-
end while
-
enter Improvement INC
-
if ΔP =|Ppv, Ppre|&&Ppre≠0
-
maintain the current duty cycle
-
end if
-
return Ppv
- (I)
The influence of the maximum power tracking technology on the power output efficiency of the photovoltaic grid access circuit is analyzed, which lays a certain foundation for the follow-up research on the maximum power tracking technology of photovoltaic grid access
- (II)
The IGWO-VINC combined algorithm is used to track GMPP in a changeable external environment, avoid falling into local optimum, improve global maximum power point tracking accuracy, shorten tracking time, and improve tracking stability
- (III)
The experiment verifies that the proposed control algorithm has a good tracking effect
2. Characteristics of Photovoltaic Panel
2.1. Description of PV Generator
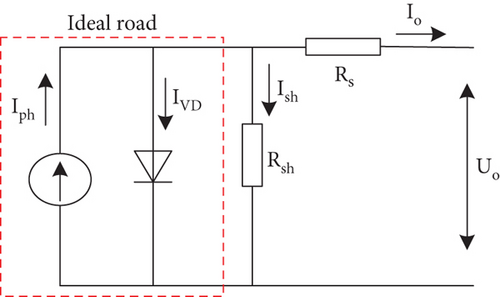
Due to the wide variety of photovoltaic cells and their complex mathematical models, they can be regarded as a stable output current source based on their working principles. To accurately describe the output characteristics of photovoltaic cells, according to electronic theories, the equivalent circuit of photovoltaic cells shown in Figure 1 can be used to simulate and study the output characteristics of photovoltaic cells.
In this paper, the photovoltaic module model TP250MBZ in MATLAB/Simulink software is selected as the research object. The basic parameters provided by the manufacturer of this photovoltaic module under a standard external environment are maximum power point Pmpp: 249 W; open circuit voltage Voc: 36.8 V; short circuit current Isc: 8.83 A; maximum power point voltage Vmpp: 30 V; maximum power point current Impp: 8.3 A; temperature coefficient of Voc: -0.33 (%/deg. C); and temperature coefficient of Isc: 0.063 (%/deg. C).
2.2. Characteristics of Photovoltaic Panels under Changing Environments
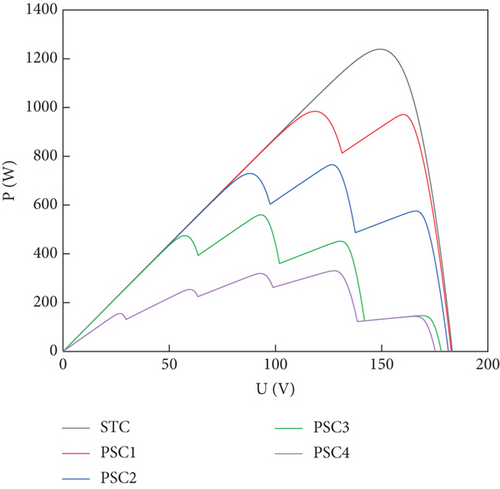
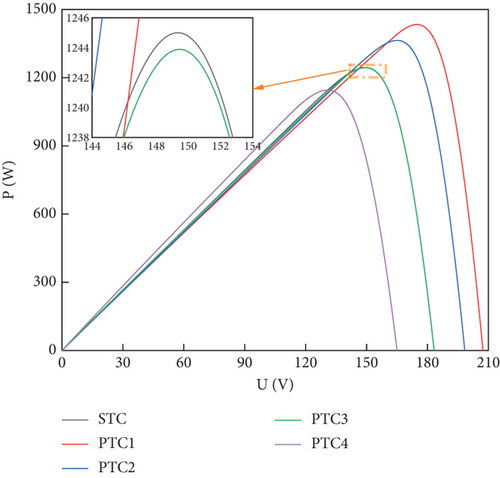
To verify whether the proposed control technique is efficient in tracking sudden changes in light radiation intensity and temperature, in the paper, five photovoltaic cells are chosen to be connected in series for simulation model tests. The characteristics of the built PV panels under partial shading are as follows. When the PV array is in PSC, the PV cells will show a local MPP phenomenon, and the sum of the output of each panel working alone is more than the total output of the same number of cells in series or parallel. The PV cells are usually at high temperatures because of the speckle effect caused by the MPP phenomenon generated within the PV array. To minimize the heat loss generated by the PV panels, the PV cell module is usually connected in reverse parallel with a bypass diode. The bypass diode will stop the shaded PV cells and protect the PV module from damage due to high PV cell temperatures. However, due to the presence of the bypass diode, multiple extreme points exist in the power output curve. Table 1 shows the values of five different light intensity conditions and corresponding MPP, five different temperature conditions, and corresponding maximum power points. Figure 2 shows the P-V curves of the panels under standard test conditions (STC) without shading and PSC conditions with light intensities of 300, 600, 900, and 1200 W/m2, respectively, as shown in Table 1, and Figure 3 shows the P-V curves of the panels under STC conditions and PSC conditions with temperatures increasing from -35°C to 75°C, as shown in Table 2.
| Case | Light intensity (W/m-2) | Temperature (°C) | GMPP (W) |
|---|---|---|---|
| STC | 1000, 1000, 1000, 1000, 1000 | 25 | 1245 |
| PSC1 | 1000, 1000, 1000, 1000, 700 | 25 | 989.1 |
| PSC2 | 1000, 1000, 1000, 400, 700 | 25 | 769.2 |
| PSC3 | 1000, 1000, 100, 400, 700 | 25 | 563 |
| PSC4 | 300, 500, 100, 400, 700 | 25 | 332.4 |
| Case | Temperature (°C) | Light intensity (W/m-2) | GMPP (W) |
|---|---|---|---|
| STC | 25, 25, 25, 25, 25 | 1000 | 1245 |
| PTC1 | -35, -25, -15, -5, 5 | 1000 | 1434 |
| PTC2 | 0, 0, 0, 0, 0 | 1000 | 1364 |
| PTC3 | 5, 15, 25, 35, 45 | 1000 | 1244 |
| PTC4 | 35, 45, 55, 65, 75 | 1000 | 1145 |
As shown in Figures 2 and 3, both light intensity and temperature have effects on MPP, where the effect of light intensity is more obvious. It is seen from (a) that the P-V curve presents multiple MPPs at PSC as the light intensity changes, in which case the conventional MPPT technique will fall into a local optimum when tracking. From (b), it can be seen that the effect of temperature is weaker, the values of MPP are similar when the overall temperatures of the panels are similar, and the output power is higher at lower temperatures. In addition, errors in the manufacturing process of PV cells may lead to differences in their characteristics, and problems such as breakage and aging may occur during long-term use. All of the above situations can make MPP tracking difficult and affect power generation efficiency. MPPT control technology can largely solve the problem of multipeak PV output in different situations, thus making the system always operate with global MPP and output the maximum system power in real time.
3. MPPT Technology Based on IGWO-VINC Algorithm
3.1. Improved GWO Algorithm
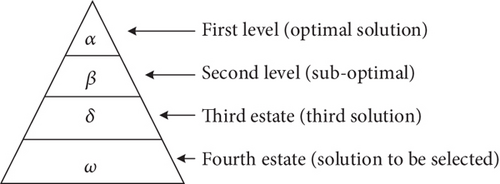
The GWO algorithm is an optimal search method, and the four-level management system of the gray wolf corresponds to the optimal, suboptimal, third, and to-be-selected solutions of the algorithm. The corresponding schematic diagram is shown in Figure 4.
Equation (12) defines the width and direction in which the ω individuals advance towards α, β, and δ in the wolf pack, and Eq. (15) defines the final position of the ω individuals. When the prey stops moving, the gray wolf completes the hunting process by attacking. In order to simulate approaching prey, the value of gradually decreases, and the fluctuation range of decreases accordingly. In other words, during the iteration, as the value of decreases linearly from 2 to 0, its corresponding value of also varies in the interval [-a, a]. Gray wolves search for prey according to the positions of α, β, and δ. Gray wolves separate from each other when searching for prey and then gather together to attack prey. Based on mathematical modeling of the scatter, random values of greater than 1 or less than -1 can be used to force the gray wolf to separate from its prey, emphasizing exploration and allowing the GWO algorithm to globally search for optimal solutions. force the gray wolf to separate from its prey (local optimum) in the hope of finding more suitable prey (global optimum). Another component of the GWO algorithm is to help discover new solutions. From Eq. (8), is a random value between [0,2]. c indicates the random weight of the influence of the location of the gray wolf on the prey, and indicates a high influence weight, and vice versa, a low influence weight. This helps the GWO algorithm to behave more stochastically and support exploration while avoiding falling into local optima during the optimization process. In addition, unlike , is nonlinearly decreasing. In this way, it provides a global search in the decision space from the initial iteration to the final iteration. The randomness of plays an important role in avoiding local optima when the algorithm is trapped in a local optimum and cannot easily be jumped out.
3.2. Improved Variable Step INC
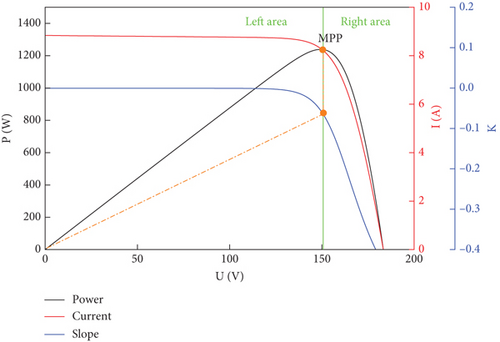
In Algorithm 1, the conductance increment method is simple in structure and easy to implement, and it is one of the well-used methods for industrial power generation. Many of the INC techniques for changing the step size are complicated, while the current P&O techniques with changes are divided into three or two regions according to the different voltage changes before and after the MPP point, and the step size of the corresponding interval is changed according to different change coefficients to achieve a better tracking effect [25, 26]. Similarly, they are also divided into two regions to divide the INC into two regions and then change the step size for tracking. Both can achieve better results. In this paper, we first apply the IGWO method for global tracking to roughly determine the range of GMPP and then use the improved INC technique to track MPP. The main purpose is to shorten the tracking time of IGWO, reduce the tracking complexity of the whole tracking process, and improve the tracking accuracy. According to this principle, the INC and P&O methods are based on the same principle as the most basic principles. The improvement idea proposed in the paper is to divide the left and right sides of the MPP into two regions and to change the step size by different factors for each region with different voltage variations. The principle of INC is shown in the Figure 5.
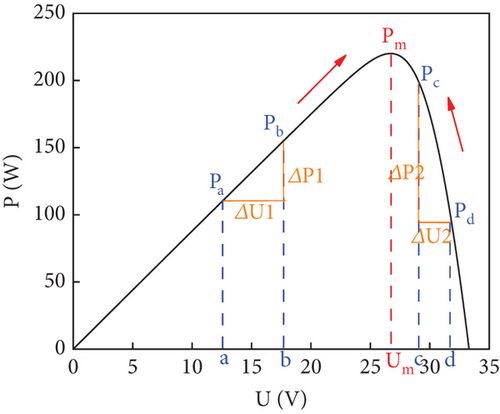
The working principle of the incremental conductance method is to determine the direction of disturbance step change by the ratio of power change to voltage change. The ratio is 0 at the vertex, when on the left side of the apex ΔP/ΔU > 0, the voltage needs to be increased, and when the right side of the apex ΔP/ΔU < 0, the voltage needs to be reduced.
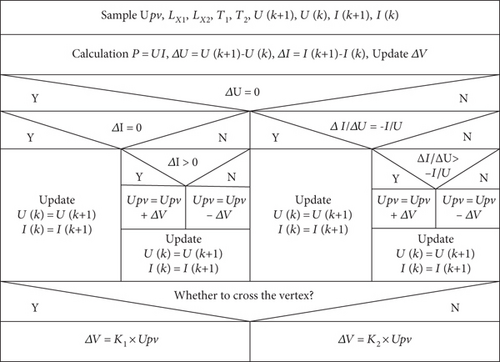
The NS flowchart of variable step size INC technology is shown in Figure 7.
3.3. IGWO-VINC Technology Tracking Process
In PV power generation, the duty cycle is the individual gray wolf and GMPP is the target prey. The approximate process of IGWO-VINC tracking is that the PV system starts the MPPT control technology, collects the voltage/current and other parameters, calculates the power, conducts the comparison of global search according to the formula, and continuously iterates to continuously update the position of individual gray wolves. When the position of the gray wolf population tends to be the same, the difference in output power decreases, and the search approaches the global maximum. As the number of iterations of the IGWO algorithm increases, the maximum number of iterations is reached, the iteration is stopped, and the loop is jumped out. To improve the tracking accuracy and shorten the time of IGWO in the later search process, the MPPT control technique enters the tracking process of VINC. The VINC method determines whether it is on the left or right side of the vertex according to the amount of voltage variation and adjusts the amount of voltage variation corresponding to the variation coefficient, respectively, to update the results of tracking GPMM.
4. IGWO-VINC Simulation Analysis
4.1. Simulation Model
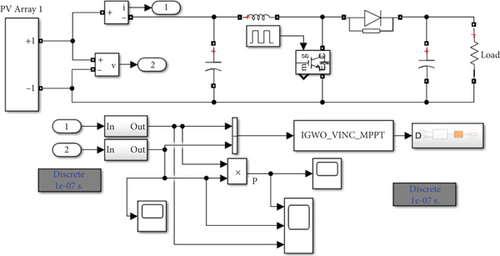
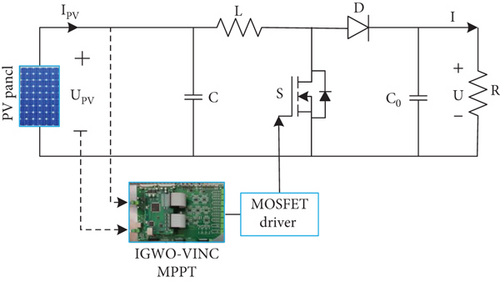
In this paper, the boost circuit is chosen as the base circuit, and the circuit diagram shown in Figure 6 is designed based on this base circuit [27]. In the circuit, C is the input filter capacitor, and the value is 20 μF. L is the energy storage inductor, and the value is 0.3 mH. V is the switching tube, and VD is the diode. C0 is the output filter capacitor, and the value is 200 μF. And R is the load, the value is 185 Ω. The switching frequency is 5000 Hz.
To verify the effectiveness of the proposed method, the simulation model shown in Figure 8 was built in MATLAB/Simulink, according to Figure 9. The simulation model mainly consists of a PV panel, boost circuit, MPPT controller, PI controller, and PWM drive circuit.
4.2. Simulation and Analysis under Static Nonshadow Conditions
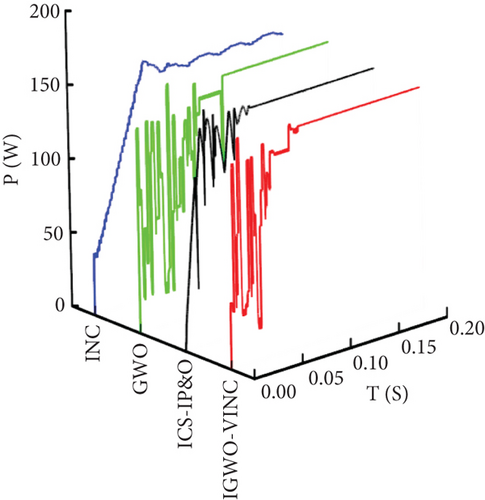
Because the P-V curve under static no shade is the curve with only one maximum value, therefore, static unshaded simulation experiments were performed at STC (light radiation intensity of 1000 W/m2 and temperature of 25°C). The MPPT in this case is 1245 W, and the tracking curves of the three techniques are shown in Figure 10.

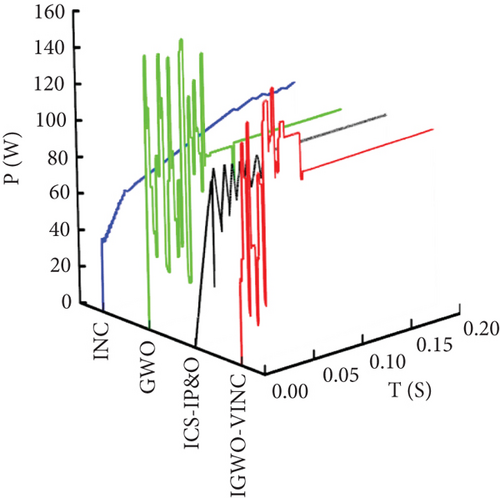
From Figure 10, the three techniques IGWO-VINC, ICS-IP&O, GWO, and INC tracked the maximum power point at 0.077 s, 0.08 s, 0.086 s, and 0.090 s, corresponding to MPP values of 1242 W, 1240 W, 1236 W, and 1237 W, respectively. The IGWO-VINC tracking efficiency reached 99.76%. In addition, the P-T and V-T curves in the figure clearly show that the red curve of IGWO-VINC has less fluctuation and better smoothness.
4.3. Simulation and Analysis under Static Shading Conditions
Under static shading conditions, the P-V curve of the PV system will have a GMPP and multiple local maximum points. To accomplish the tracking effect in this state, the conditions of five panels are set in the paper as 400 W/m2, 15°C; 500 W/m2, 20°C; 900 W/m2, 25°C; 800 W/m2, 35°C; and 1000 W/m2, 30°C. The GMPP at this time is 622.5 W, and the P-V characteristic curve of the PV string is shown in Figure 11. The P-T and V-T curves of the three techniques are shown in Figure 12.
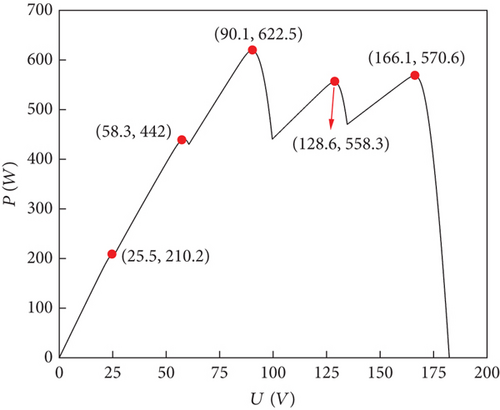
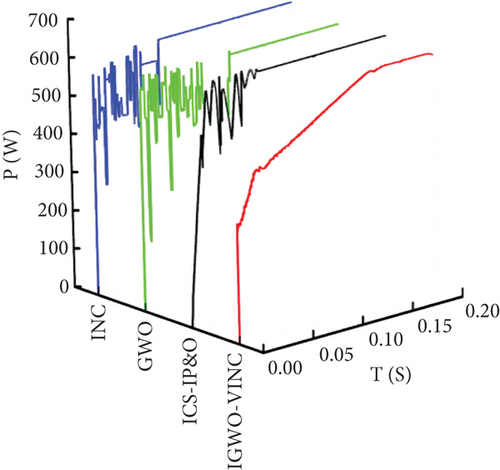
According to the simulation data, the IGWO-VINC tracking converges to the stable value of 622 W in 0.066 s with 99.92% efficiency. The ICS-IP&O tracking converges to the stable value of 621.57 W in 0.071 s with 99.85% efficiency. The GWO tracking converges to the stable value of 608.9 W in 0.090 s with 97.82% efficiency. The INC tracking converges to the stable value of 621 W in 0.148 s with 99.76% efficiency. The IGWO-VINC tracking time is 0.082 s shorter than that of INC. Compared with GWO, the tracking accuracy is improved by 2.1%. From this, it is clear that the time of the newly proposed technique is improved compared to INC, and the tracking accuracy is improved to some extent relative to GWO. Combined with Figure 12, it is clear that the three technologies respond quickly at the moment of starting tracking. The voltage oscillation is minor for IGWO-VINC, which can reduce the power loss due to fluctuation during tracking. Overall, the tracking effect of IGWO-VINC is the best under static shading conditions.
4.4. Simulation and Analysis under Dynamic Shading Conditions
The conditions encountered in the actual operating environment of photovoltaic power generation can change at any time. The intensity of light radiation around the PV module, the temperature, and the area being irradiated all change over time. Therefore, the dynamic tracking effect of PV modules under three different environments is simulated in Simulink with the dynamic change conditions shown in Table 3, and the switching time of each segment is 0.2 s.
| Test status | Light intensity (W/m-2) | Temperature (°C) | GMPP (W) |
|---|---|---|---|
| PSC1 | 1000, 1000, 1000, 600, 400 | 40, 30, 25, 15, 20 | 712.9 |
| PSC2 | 1000, 1000, 200, 600, 400 | 35, 30, 10, 15, 25 | 479.9 |
| PSC3 | 300, 700, 200, 600, 400 | 15, 25, 5, 20, 30 | 335.6 |
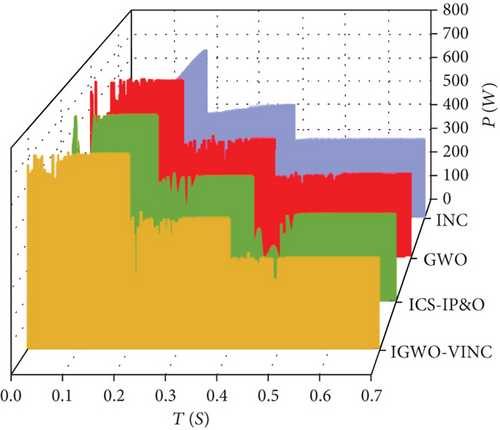
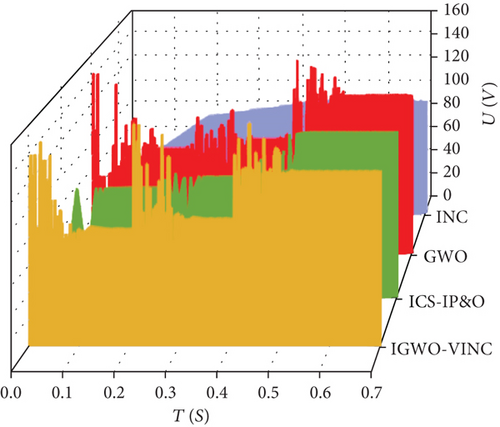
The power and voltage curves with time are obtained, as shown in Figure 12.
According to the data obtained from the simulation, in the first stage of tracking, IGWO-VINC traces the GMPP value of 711.4 W at 0.086 s, and the tracking efficiency is 99.79%. ICS-IP&O traces the GMPP value of 712.9 W at 0.090 s, and the tracking efficiency is 99.72%. GWO traces the GMPP value of 709.4 W at 0.096 s, and the tracking efficiency is 99.51%. INC traces the GMPP value of 710.4 W at 0.153 s, and the tracking efficiency is 99.65%. In the second stage, the IGWO-VINC traced the GMPP value of 478.3 W at 0.091 s, and the tracking efficiency was 99.48%. The ICS-IP&O traced the GMPP value of 477.41 W at 0.099 s, and the tracking efficiency was 99.67%. The GWO traced the GMPP value of 469.3 W at 0.121 s, and the tracking efficiency was 97.78%. The INC traced the GMPP value of 475.3 W at 0.176 s, and the tracking efficiency was 99.04%. In the third stage, IGWO-VINC traced 334.6 W GMPP at 0.085 s with 99.71% tracking efficiency, ICS-IP&O traced 333.32 W GMPP at 0.091 s with 99.32% tracking efficiency, GWO traced 321.5 W GMPP at 0.109 s with 95.80% tracking efficiency, and INC traced 331.6 W GMPP at 0.131 s with 98.81% tracking efficiency. According to the above data, the tracking accuracy of IGWO-VINC is above 99%, which speeds up the tracking speed by up to 0.021 s and increases the tracking accuracy by up to 3.91% compared to GWO technology. The main reason for this situation is that after tracking into the region near GMPP, IGWO stops tracking, and VINC enters the final exact search, which improves the accuracy and shortens the iteration time of IGWO. The tracking efficiency and tracking time have been improved compared to ICS-IP&O. The tracking effects of the three techniques under dynamic conditions are shown in Figure 13. The tracking curve of the proposed algorithm is more stable with fewer fluctuations.
5. Experimental Verification and Analysis
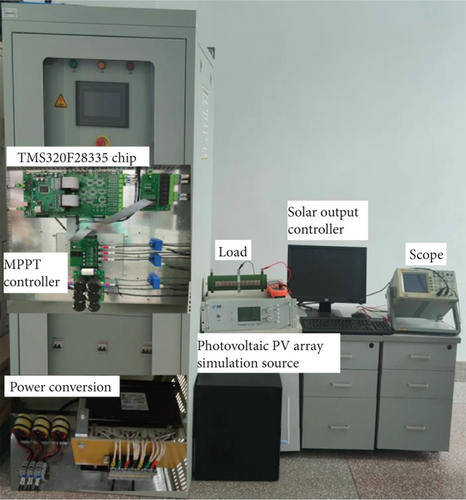
To verify the effectiveness of the IGWO-VINC technology, experiments were conducted on a hardware experimental platform controlled by TMS320F28335 as the chip. The experimental platform is shown in Figure 14. The equipment mainly includes a PV analog source (simulated PV panel), MPPT controller, 50 Ω adjustable power resistor (load), digital multimeter, digital oscilloscope, etc. Since the safety of the equipment is considered during the experimental operation, the output voltage is set to 24 V and the current is 5 A. The following experimental verification is carried out for the cases of static no shading, static shading, and dynamic shading, respectively.
According to the simulation data, the MPPs tracked by IGWO-VINC, ICS-IP&O, GWO, and INC in this state are 86.7 W, 86.61 W, 86.7 W, and 86.4 W, respectively, which are not very different. The corresponding tracking times are 0.077 s, 0.087 s, 0.159 s, and 0.124 s. The IGWO-VINC technique reduces 0.082 s, 0.010 s, and 0.047 s compared to GWO, ICS-IP&O, and INC, respectively. From Figure 15, it can be seen that the tracking voltage fluctuation of the IGWO-VINC method is small and enters the stable state within 1 s fluctuation, and the stability of the INC method is poor.
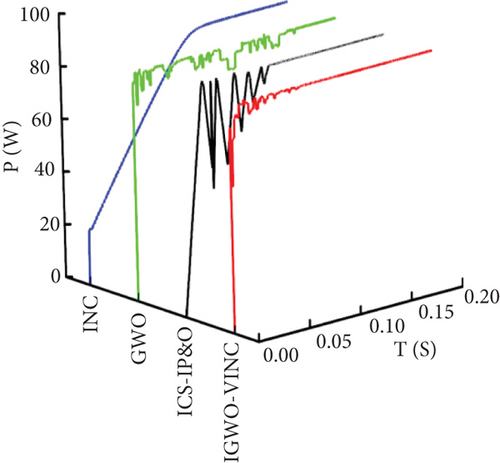
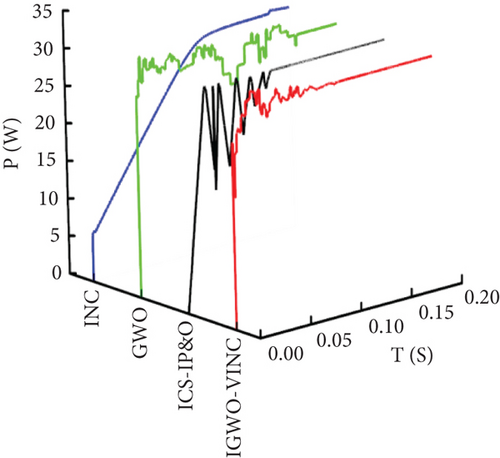
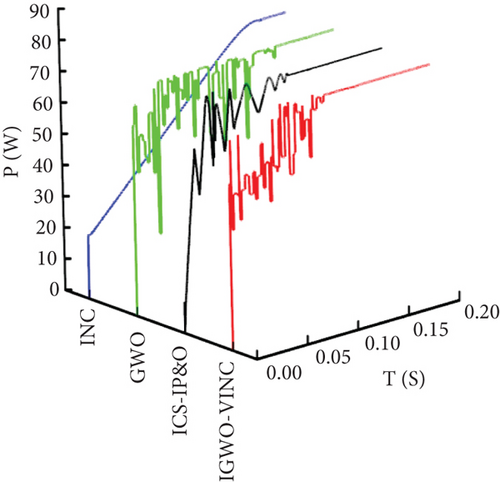
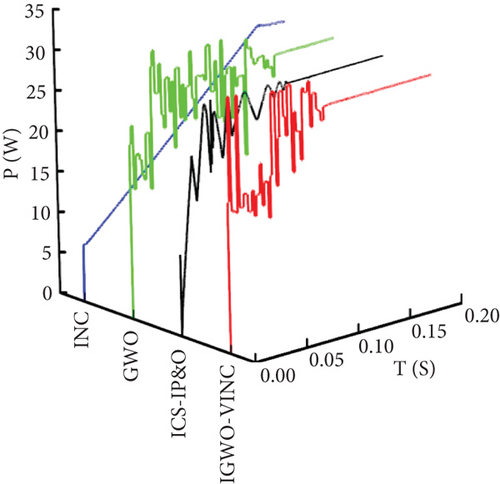
According to the simulation data, the tracking time tracked by IGWO-VINC, ICS-IP&O, GWO, and INC in this state is 0.095 s, 0.107 s, 0.142 s, and 0.174 s, respectively. The IGWO-VINC technique reduces 0.047 s, 0.012 s and 0.079 s compared to GWO, ICS-IP&O, and INC, respectively. And the tracking accuracy of the three in this state is not much different, and they are all stable at around 72.8 W. From Figure 16, it can be seen that the tracking voltage fluctuation of the IGWO-VINC method is small, the fluctuation enters a steady state soon, and the stability is better.
The conditions for the experiments under dynamic shade are shown in Table 4.
| Test status | Light intensity (W/m-2) | Temperature (°C) | GMPP (W) |
|---|---|---|---|
| PSC1 | 130, 130, 130, 52, 78 | 40, 30, 25, 15, 20 | 89.36 |
| PSC2 | 130, 130, 65, 52, 78 | 35, 30, 10, 15, 25 | 69.05 |
| PSC3 | 39, 91, 65, 52, 78 | 15, 25, 5, 20, 30 | 54.27 |
The data obtained from the experiments were organized and plotted to obtain the graph shown in Figure 17.
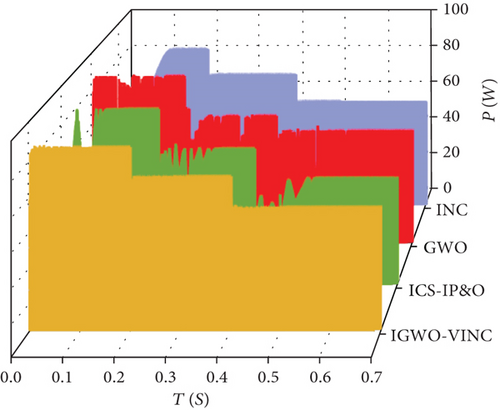
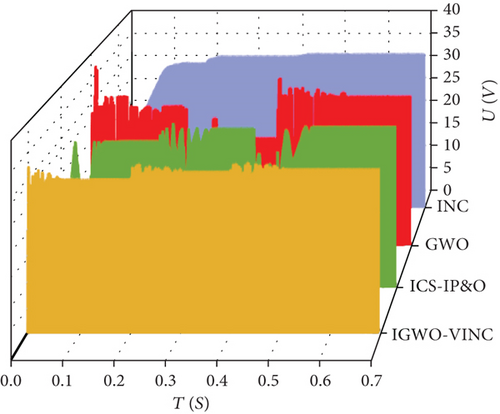
The above figure shows the power tracking simulation waveforms of the three technologies under dynamic PSC, as shown in Figure 17. Under PSC1, the tracking times of the three technologies are 0.075 s, 0.086 s, 0.160 s, and 0.131 s, and the final output power is 88.5 W, 88.12 W, 87.5 W, and 85.5 W, respectively. Under PSC1-PC2, the tracking times of the three technologies are 0.108 s, 0.115 s, 0.154 s, and 0.035 s, and the final output power is 68.7 W, 68.37 s, 66.8 W, and 68.5 W, corresponding to tracking efficiencies of 99.49%, 99.02%, 96.74%, and 95.68%, respectively. Under dynamic shading conditions, there are two more direct reasons for the short tracking time of INC twice. The first is that INC falls into a local optimum when tracking. Because the first point of PSC2 in the P-V characteristic curve is GMPP, when INC is traced to the first point, it stops tracing at the local maximum, and the MPP trace at that point is the same as the value traced by the other two methods. The second is that the experimental conditions are limited, the magnitude of dynamic condition changes is small, and the voltage changes slowly when INC is tracked. In the next stage of tracking, it can quickly track the next MPP, so the tracking time is shorter. Under PSC2-PSC3, the four methods took 0.097 s, 0.124 s, 0.163 s, and 0.036 s to complete the power track; the final output values were 53.8 W, 53.6 W, 53.1 W, and 53.1 W; tracking efficiency was 99.13%, 98.76%, 97.84%, and 97.84%. At this time, INC time is the shortest, mainly because the voltage is increasing and the change is small. Although it can track the MPP in a short time, the voltage increases the loss of the circuit, and in the actual long-term use of the production, it is not recommended to use the method. By combining the P-T and V-T diagrams and data, it can be seen that the overall tracking effect of IGWO-VINC is the best, the tracking accuracy is guaranteed to be above 99%, and the oscillation amplitude is minimal.
The results obtained from the simulation and experiment are tabulated in Table 5, where GMPP is the size of the experimental data unified to the same level as the simulation, which helps to make a better comparison.
| Case | Technology | Simulation | Experiment | ||||
|---|---|---|---|---|---|---|---|
| Time (s) | GMPP (W) | Efficiency (%) | Time (s) | GMPP (W) | Efficiency (%) | ||
| Ideal static | GWO | 0.086 | 1236 | 99.27 | 0.159 | 86.7 | 97.41 |
| INC | 0.090 | 1237 | 99.35 | 0.124 | 86.4 | 97.08 | |
| ICS-IP&O | 0.080 | 1240 | 99.60 | 0.087 | 86.61 | 97.31 | |
| IGWO-VINC | 0.077 | 1242 | 99.76 | 0.077 | 86.7 | 97.41 | |
| Static shadow | GWO | 0.090 | 608.9 | 97.82 | 0.142 | 72.8 | 98.91 |
| INC | 0.148 | 621 | 99.76 | 0.174 | 72.7 | 98.78 | |
| ICS-IP&O | 0.071 | 621.57 | 99.85 | 0.107 | 72.75 | 98.85 | |
| IGWO-VINC | 0.066 | 622 | 99.92 | 0.095 | 72.8 | 98.91 | |
| PSC1 | GWO | 0.096 | 709.4 | 99.51 | 0.131 | 87.5 | 97.92 |
| INC | 0.153 | 710.4 | 99.65 | 0.160 | 85.5 | 95.68 | |
| ICS-IP&O | 0.090 | 710.9 | 99.72 | 0.086 | 88.12 | 98.63 | |
| IGWO-VINC | 0.086 | 711.4 | 99.79 | 0.075 | 88.5 | 99.04 | |
| PSC1-PSC2 | GWO | 0.121 | 469.3 | 97.78 | 0.154 | 68.5 | 96.74 |
| INC | 0.176 | 475.3 | 99.04 | 0.035 | 66.8 | 95.68 | |
| ICS-IP&O | 0.099 | 477.41 | 99.48 | 0.115 | 68.37 | 99.02 | |
| IGWO-VINC | 0.096 | 478.3 | 99.67 | 0.108 | 68.7 | 99.49 | |
| PSC2-PSC3 | GWO | 0.109 | 321.5 | 95.80 | 0.163 | 53.1 | 97.84 |
| INC | 0.131 | 331.6 | 98.81 | 0.036 | 53.1 | 97.84 | |
| ICS-IP&O | 0.091 | 333.32 | 99.32 | 0.124 | 53.6 | 98.76 | |
| IGWO-VINC | 0.085 | 334.6 | 99.71 | 0.097 | 53.8 | 99.13 | |
The histograms corresponding to the tracking time and efficiency of the three techniques for different tracking modes in simulation and experiment are shown in Figure 18.
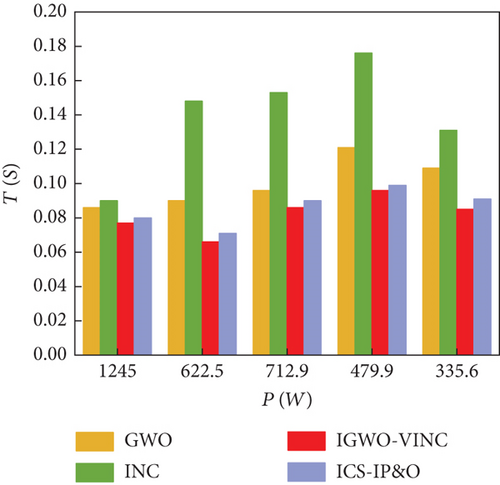
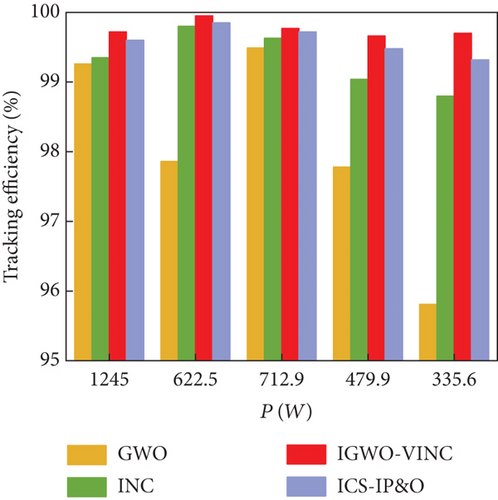
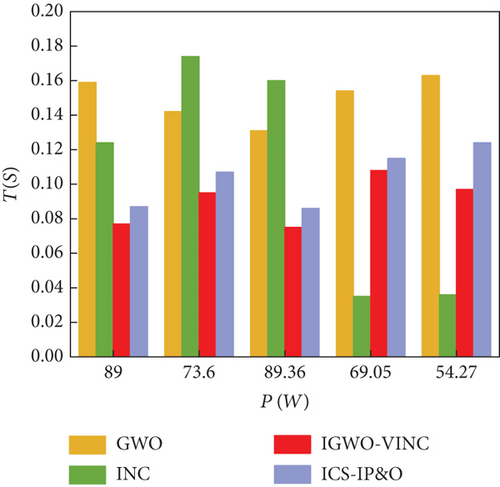
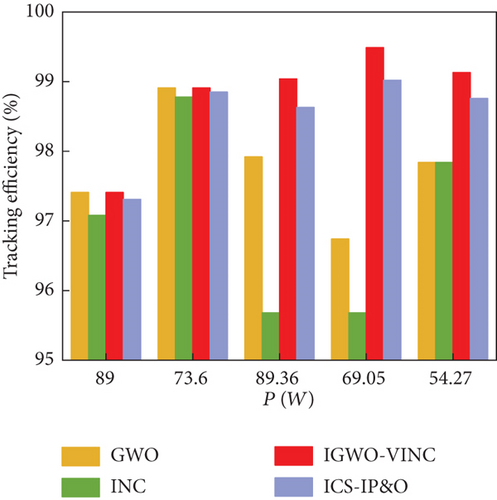
Based on Table 5 and Figure 18, it can be seen that IGWO-VINC has the best tracking performance among the three technologies. The tracking time of IGWO-VINC has been reduced by an average of 0.021 s compared to the other three technologies, and the tracking accuracy has been improved by an average of 1.16%. The data obtained from simulations and experiments show that the IGWO-VINC technology combines the advantages of both technologies to achieve faster and more accurate tracking of GMPP in dynamic environments, although the complexity of the IGWO-VINC technology increases compared to GWO and INC, and the accuracy requirements of hardware devices increase accordingly. However, IGWO-VINC technology can better adapt to the changing external environment, and from the perspective of long-term power generation, IGWO-VINC technology has better applicability than GWO and INC.
6. Conclusion
Aiming at the problem that it is difficult to guarantee real-time working at GMPP of PV power generation systems under the variable conditions of the external environment, this paper proposes an MPPT control technique of IGWO-VINC. In order to avoid getting trapped at the local maximum point, the IGWO tracking is first improved using the incorporation of the Levy flight function to improve the global search capability. When the search enters the region near the GMPP and reaches the maximum number of iterations of IGWO, the VINC tracking is entered to locate the exact MPP. Simulations and experiments in Sections 4 and 5 reveal that IGWO-VINC tracks better in the three cases of static no shading, static shading, and dynamic shading. And the accuracy of IGWO-VINC under simulation can reach more than 99% in all cases. After simulation and experimental discussion, adding the Levy flight function and VINC based on IGWO did improve the tracking accuracy. Adding IGWO based on VINC significantly speeds up the tracking speed, and the local optimal situation can be avoided when VINC is tracking alone. Through a comprehensive analysis of the three sets of simulation and experimental data and combined with the corresponding graphs, we can know that, based on GWO, the tracking accuracy is improved due to the addition of the Levy flight function and VINC. Based on INC, the tracking speed is faster to some extent due to the addition of IGWO and improved INC. Compared with the latest hybrid tracking strategy, ICS-IP&O, with a 0.009 s increase in tracking time and a 0.23% increase in tracking efficiency, overall, the tracking effect is better than ICS-IP&O.
Conflicts of Interest
The authors declare that there is no conflict of interest regarding the publication of this paper.
Authors’ Contributions
Guoping Lei and Chang Yan were responsible for the conceptualization. Guoping Lei and Chang Yan were responsible for the methodology. Chang Yan was responsible for the software. Guoping Lei, Li Cai, and Nina Dai were responsible for the validation. Jing Liu was responsible for the formal analysis. Shenghao Li and Li Cai were responsible for the investigation. Guoping Lei, Nina Dai, and Shenghao Li were responsible for the resources. Chang Yan, Li Cai, Jing Liu, and Chao He were responsible for the writing—review and editing. All authors have read and agreed to the published version of the manuscript.
Acknowledgments
This work was funded by the school laboratory teachers, but there was no conflict of interest. This work was supported by the Natural Science Foundation Project of Chongqing Science and Technology Commission (grant numbers: cstc2021jcyj-msxmX0301, cstc2020jcyj-msxmX0034, CSTB2022NSCQ-MSX1320, and 2022NSCQ-MSX4086), the Science and Technology Research Program of Chongqing Municipal Education Commission (grant numbers: KJZD-K202101202 and KJZD-K202103401), the Chongqing Wanzhou District Science and Technology Plan Project (grant number: wzstc20220301), the Science and Technology Research Program of Chongqing Municipal Education Commission (grant number: KJZD-K202201203), and the Graduate Research Innovation Project of Chongqing Three Gorges University (grant number: YJSKY23044).
Open Research
Data Availability
The data in this article is included in the picture and cannot be pasted here.


