Impacts of Climate Change on the Distribution of African Wild Olive Tree in the Arid Environments of Northern Ethiopia
Abstract
Climate change is impacting the sustainability of indigenous tree species. However, the impacts of climate change on African olive tree (Olea europaea subspecies Cuspidata) are less-explored. This study, conducted in Tigray, northern Ethiopia, aims to determine the impacts of climate change on the current and future distributions of the species. A total of 225 presence points and abundance of O. europaea within 20 m × 20 m plots at each location were collected. Additional input variables, such as the 19 bioclimatic variables, 3 topographic variables, and Pedologic data, were used. Maxent software was employed to predict the distribution of the species under current and future climate scenarios. The correlation between the tree’s abundance and environmental factors was ascertained using Spearman’s correlation. The findings indicated that the most crucial factors affecting the distribution of the tree were temperature seasonality, altitude, and precipitations during the driest month. The current range of the species covered 1979 km2 (3.01%) of Tigray. This coverage is expected to increase by 13.64% under 2070_RCP4.5 scenario. However, under 2070_RCP8.5, a total loss of suitable habitats is anticipated. Rainfall, slope, altitude, soil organic carbon, and silt contents had a positive correlation with the species abundance, whereas sand, clay, bulk density, and soil pH had a negative correlation (p < 0.05). In conclusion, the species may locally disappear due to the adverse effects of future climate change under the RCP8.5. Hence, the study recommends immediate in situ and ex situ conservation efforts to sustain the populations and important values of the tree.
1. Introduction
Climate change significantly affects the geographical distributions and abundances of many fauna and flora species worldwide [1]. The impacts of climate change on plant species can be mainly estimated by comparing temperature and precipitation patterns and trends in relation to species’ range shifts [2, 3]. The rising temperatures over time can trigger an increase in dry, desert-like conditions, affecting not only the survival of particular species but also the natural resources they rely on [4]. Consequently, over half of the species worldwide have shifted their geographic ranges either pole-ward or upward to higher elevation, consistent with the rising temperature [4]. Furthermore, future climate change will strongly influence forest tree species’ geographic distributions [5]. The extent and magnitude of climate change impacts are larger than estimated in earlier assessments [4]. Compared to before 2005, the global surface temperature for the mid-twenty-first century is projected to increase by 1°C, 1.4°C, 1.3°C, and 2°C for the four representative concentration pathways (RCP2.6, RCP4.5, RCP6.0, and RCP8.5, respectively). This will result in losses of a significant number of local species depending on degree of global warming [6]. The IPCC Sixth Assessment Report (IPCC AR6) states that between 3 and 14% of terrestrial species will likely be at very high risk at 1.5°C, with rises up to 3 to 18% at 2°C, 3 to 29% at 3°C, 3 to 39% at 4°C, and 3 to 48% at 5°C [4]. Several studies (e.g., [7–10]) have shown that tree species are disappearing from forests and other habitats more quickly than they can move to or repopulate other places.
Ethiopia’s remaining dry, evergreen Afromontane forests are among the most endangered ecosystems, mainly due to anthropogenic influences and climate change [8, 11, 12]. The most common plant species in this forest ecosystem is Juniperus procera, followed by Olea europaea subspecies Cuspidata (hereafter O. europaea), also known as the African wild olive tree [13, 14]. The population of O. europaea is becoming locally endangered in Ethiopia, particularly in Tigray, due to continuous deforestation of the dry Afromontane forests primarily driven by human activities such as increased agricultural activities, overexploitation, and settlement. These activities have caused the dry Afromontane forests to fragment and put many species’ existence in danger [8, 11, 15–18].
Ecologists frequently employ species distribution models (SDMs) to determine the occurrence of species using a variety of environmental factors [19]. According to Miller [20], SDMs quantify the relationship between predictor variables and distribution of different tree species and thereby predicts the likelihood that a species will be able to thrive in a particular environment [21–23]. Numerous studies have examined the effect of climate change on species distributions using the Maximum Entropy (Maxent) approach [24–26]. Considering the importance of predicting potentially suitable habitats for threatened plant species for conservation and management of their intrinsic habitats [4, 27, 28], we used Maxent model to project the potentially suitable habitat and distribution of O. europaea. Maxent model is appropriate for projecting suitable habitats for a particular species with better predictive performance [24, 29] using only-presence location points [30, 31].
Information on the current and future distribution of O. europaea in arid environments of northern Ethiopia in response to the future climate change is limited. While there are some studies on the distribution of the species in general (e.g. [11, 13, 32–34]), there is only one study specifically on the impact of climate change on the global distribution of O. europaea [35]. This highlights the need for more research on the species in Ethiopia in general and in the study region, in particular.
Therefore, this study attempted to identify potentially suitable locations for the highly exploited and threatened species under current and future climatic scenarios with the following objectives: (1) to assess how climate change affects O. europaea distribution; (2) to identify key environmental factors associated with the tree’s distribution and abundance; and (3) to investigate potential future habitats for the distribution of the tree in northern Ethiopia.
2. Methods
2.1. Study Area
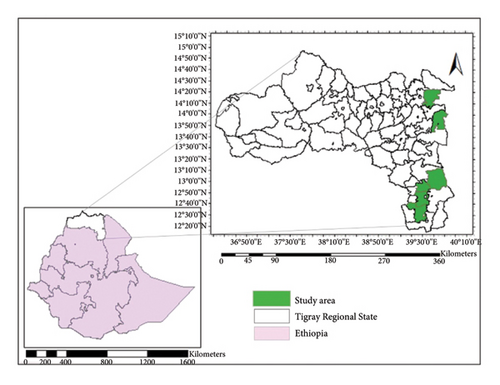
The study was done in the Tigray region, north Ethiopia, situated between latitude: 12°15′ to 14°57′N and longitude: 36°27′ to 39°59′E (Figure 1). The region is largely mountainous, with an elevation range between 500 and 4000 m.a.s.l. Its dominant soil types include Leptosols, Cambisols, Regosols, Fluvisols, Arenosols, Vertisols, Xerosols, Luvisols, Calcisols, and Phaeozems [36–38]. According to Virgo and Munro [39]; the area experiences an arid climate with annual rainfall ranging from 308 to 1054 mm and temperatures between 8.1 and 37°C. A mixed farming system, which mostly combines crops, animals, and trees, is the predominant kind in the region. Dry evergreen Afromontane forests dominated by Juniperus procera and O. europaea; Acacia-Commiphora woodlands with species of Acacia, Ficus, Euphorbia, Cordia, Croton, Olea, and Albizia; and Combretum-Terminalia vegetation type that comprises Boswellia and Commiphora are the three main vegetation types found in the region [40].
2.2. Target Species
O. europaea subspecies Cuspidata is a branched tree that grows up to 15 meters in height, and in rare cases, up to 25 meters. It is mostly found in dry areas and forest margins between 1400 and 3100 m.a.s.l. [41]. This drought-resistant species is distributed in many parts of the world. In Africa, it spans from south to northeast [16, 40, 41]. Within the study region, it is mainly found across the dry Afromontane vegetation belts in the southern and eastern areas. Despite its importance as a multipurpose tree used for a range of services, including fuel wood, charcoal, timber, medicinal value, construction, farm tools, toothbrush, fodder, walking sticks, smoking wood, smoke baths, soil erosion control, climate mitigation, shading, and home for wild animals [42], the species is locally threatened in Ethiopia, particularly in the study area [42].
2.3. Sampling Procedures and Data Collection
In combination with J. procera, O. europaea is widely spread as residual forests in the dry highlands of southern and eastern parts of Tigray [40, 43]. Areas where the tree currently grows were, therefore, specifically chosen for data collection to represent the entire suitable areas of the region. In order to simulate species distribution in Maxent with good predictions, the sample size was set in accordance with Wisz et al. [44]; which stated not-fewer than 30 occurrence points are necessary. To improve the model’s precision, we purposefully raised the sample size to 225 location points. The region’s southern and eastern highlands were used to record a total of 225 location points with a distance between each of them of at least 1 km (Figure 1). To calculate the correlation between the species’ abundance (tree density) and environmental factors, the number of O. europaea within an area measuring 20 m × 20 m from each location point was counted [45].
2.4. Environmental Datasets
A set of climatic, topographic, and soil characteristics data were collected to be used as model inputs to predict the distribution of the tree (Table 1). Nineteen bioclimatic data with a resolution of 30 arc seconds were obtained from WorldClim databases (https://www.worldclim.org/) for three different time frames: the current period, mid-century 2041–2060 (average 2050) and end-century 2061–2080 (average 2070) [46]. Two typical concentration pathway scenarios, RCP4.5 and RCP8.5, were considered for the analysis, representing medium and high emission baselines, respectively [47], to assess the time-dependent effects of climate change on the distribution of the tree [48]. The RCP4.5 and RCP8.5 scenarios indicate concentration pathways where total radiative forcing reaches 4.5 Wm−2 and 8.5 Wm−2 by 2100, respectively, corresponding to temperature increases of 2.4 to 4.9°C. RCP8.5 represents a worst-case scenario for climate modeling [4, 48, 49]. Altitude data were derived from Geospatial Data Cloud (https://www.gscloud.cn/). The region’s Digital Elevation Model (DEM) with a resolution of 30 m (https://ned.usgs.gov/) was used to obtain the slope and aspect data. Soil properties of the area were taken from the UNESCO world soil map (https://www.fao.org/soils-portal/en/). All variables were resized to match the WorldClim resolution. With the aid of ArcGIS version 10.8.1 [50], all the modeling-related variables were condensed to the study area’s map and then converted to an ASCII raster file format [50].
| Data type | Environmental variable | Label | Scaling factor (times) | Units |
|---|---|---|---|---|
| Climatic | Annual mean temperature | Bio1 | 10 | °C |
| Mean diurnal range | Bio2 | 10 | °C | |
| Isothermality | Bio3 | 100 | No dimension | |
| Temperature seasonality | Bio4 | 100 | °C | |
| Max temperature of warmest month | Bio5 | 10 | °C | |
| Min temperature of coldest month | Bio6 | 10 | °C | |
| Temperature annual range | Bio7 | 10 | °C | |
| Mean temperature of wettest quarter | Bio8 | 10 | °C | |
| Mean temperature of driest quarter | Bio9 | 10 | °C | |
| Mean temperature of warmest quarter | Bio10 | 10 | °C | |
| Mean temperature of coldest quarter | Bio11 | 10 | °C | |
| Annual precipitation | Bio12 | 1 | mm | |
| Precipitation of wettest month | Bio13 | 1 | mm | |
| Precipitation of driest month | Bio14 | 1 | mm | |
| Precipitation seasonality | Bio15 | 100 | Fraction | |
| Precipitation of wettest quarter | Bio16 | 1 | mm | |
| Precipitation of driest quarter | Bio17 | 1 | mm | |
| Precipitation of warmest quarter | Bio18 | 1 | mm | |
| Precipitation of coldest quarter | Bio19 | 1 | mm | |
| Topographic | Altitude | Alt | 10 | m |
| Slope | Slope | — | ||
| Aspect | Aspect | — | ||
| Soil properties | Soil | Soil | — | |
2.5. Data Analysis and Modeling Procedures
Among the many SDMs that are currently in use for ecological niche modeling [1, 44, 51], Maxent outperforms even with a small number of samples [28], therefore, this makes it our choice model for this study. The geographic distribution of O. europaea in Tigray, northern Ethiopia and its present and future appropriate habitats were therefore predicted using Maxent (v3.3.3k). This niche-based modeling method employs presence-only information along with various environmental parameters to forecast species distribution under changing climate conditions [29, 30]. In accordance with Phillips et al. [30]; we randomly divided our data into two parts: 75% for calibrating the model whilst the reaming 25% for testing, with 20 replicate runs [30, 52]. Following the classification of Shrestha and Bawa [53]; the area under curves (AUC) of the receivers operating characteristics (ROC) was used to assess the predictive power of the model. Accordingly, AUC values between 0.50 and 0.70, 0.70–0.90, and greater than 0.90 were classified as low, medium, and high model performances, respectively.
Key factors affecting the probable distribution of the tree were assessed using percent contribution and Jackknife tests [28, 54]. In the Jackknife tests, a new model is built for each environmental variable while leaving out the others [28, 30]. Additionally, response curves were employed to evaluate the tree’s response to each environmental factor while holding others constant. The relationship between the abundance of the tree and environmental variables was determined using Spearman’s multiple correlations in the Statistical Package for Social Science (SPSS 26) [55].
Maxent generated an index of suitability using continuous values ranging from 0 to 1, which were then divided into five threshold categories based on ten-percentile training threshold in Diva GIS: 0–0.18 (unsuitable), 0.18–0.35 (less suitable), 0.35–0.53 (suitable), 0.53–0.7 (optimum suitable) and 0.7–1 (high suitable) areas. Habitat suitability maps for the tree were produced using Arc GIS10.8.1. Future suitability changes were identified and computed by overlaying the current and future suitability distributions in Diva GIS 7.5.
3. Results and Discussion
3.1. Model Performance Assessment
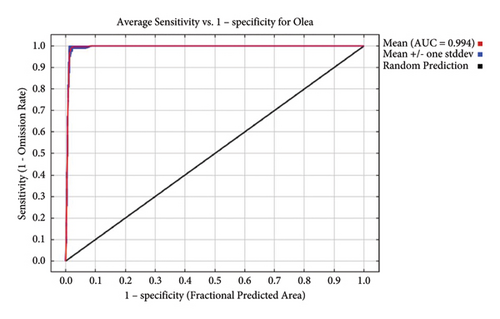
According to the model’s accuracy evaluation, the average area under curves (AUCs) for training and testing across 20 replicate runs was 0.994 with a standard deviation of 0.001 (Figure 2). Both the training and testing AUCs are much farther from the random prediction line (AUC = 0.5) and nearer to one. The model created by Maxent was, therefore, deemed to be the best performing one for predicting suitable habitats for O. europaea distribution in Tigray, northern Ethiopia. The model was approved because it attained an excellent level and complied with the guidelines set forth by Shrestha and Bawa [53]. This result also agrees with Elith et al. [28], Oyervides [56], Phillips [31], Phillips et al. [30], and Salinas-Ramos et al. [57]; who found that models with AUC values greater than 90% are excellent performers and accurate in predicting the current and future probability of species distribution. Studies by Robiansyah and Hajar [10] and Yi et al. [58], and many other recent studies on species distribution, also consider models with AUCs greater than 90% to be excellent performing levels and possibly be used for projecting impacts of climate change on the distribution of tree species and their natural habitats.
3.2. Contribution of Environmental Variables for the Geographic Distribution of O. europaea
The study results indicated that temperature-related variables contributed 47.6%, precipitation-related variables 29.3%, and topographic variables 22.7% to the model. Among the 23 environmental variables, the top three that best explained the suitability of habitats for the endangered O. europaea were temperature seasonality (35.4%), altitude (21.6%), and precipitation of the driest month (15%), with a cumulative contribution of 72% to the model (see also Table 2).
| Environmental variables | Description | Percent contribution to the model |
|---|---|---|
| Bio4 | Temperature seasonality (standard deviation) | 35.4 |
| Altitude | Altitude | 21.6 |
| Bio14 | Precipitation of driest month | 15 |
| Bio19 | Precipitation of coldest quarter | 5.1 |
| Bio15 | Precipitation seasonality (coefficient of variation) | 4.7 |
| Bio5 | Max temperature of warmest month | 4 |
| Bio13 | Precipitation of wettest month | 3.8 |
| Bio6 | Min temperature of coldest month | 1.7 |
| Bio11 | Mean temperature of coldest quarter | 1.2 |
| Bio3 | Isothermality (bio2/bio7) | 1.2 |
| Slope | Slope | 1.1 |
| Bio1 | Annual mean temperature | 1.1 |
| Bio2 | Mean diurnal range | 1 |
| Bio8 | Mean temperature of wettest quarter | 0.8 |
| Bio7 | Temperature annual range (bio5-bio6) | 0.7 |
| Bio16 | Precipitation of wettest quarter | 0.5 |
| Bio12 | Annual precipitation | 0.4 |
| Bio10 | Mean temperature of warmest quarter | 0.4 |
| Bio18 | Precipitation of warmest quarter | 0.1 |
| Bio17 | Precipitation of driest quarter | 0.1 |
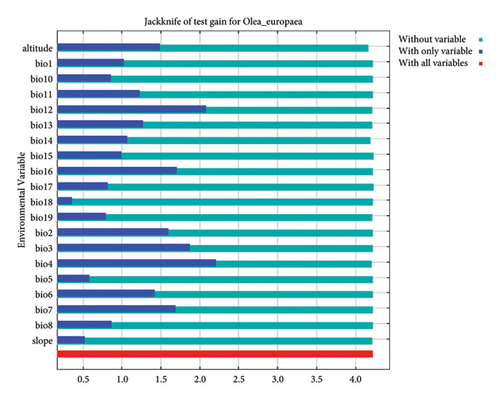
Similar results were also observed in the Jackknife tests (Figure 3). Temperature seasonality is thus the environmental variable that the model finds most useful when used alone. Altitude appears to have the most information that is not contained in the other variables because it reduces gain the most when it is excluded [30, 54]. In contrast, a study on another subspecies of Olea (Olea europaea sensu lato) in central Asia reported that the minimum temperature of the coldest month and maximum temperature of the warmest month as the most important variables [1]. In our model, these variables contributed only 1.7% and 4%, respectively (see also Table 2).
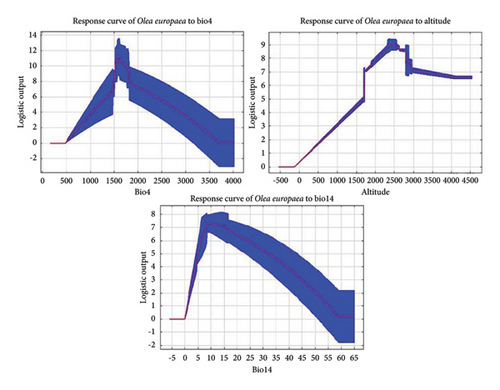
The responses curves (Figure 4) showed how O. europaea reacts to each environmental factor while keeping others constant. According to the results, the best habitats for the likelihood of the occurrence of the species are those with temperature seasonality ranging between 5 and 38°C, altitudes higher than 1500 m, and precipitation during driest month greater than 10 mm. This is consistent with reports by Bekele-Tesemma [41] and Friis [40]; who described O. europaea as a drought-resistant tree and found in areas characterized by low rainfall and high altitudes up to 3100 m. A temperature seasonality range of 5–38°C and a minimum of 10 mm precipitation in the driest month are ideal climate related conditions for the survival and continuity of the species. However, future climate change, especially under the worst emission scenario, is expected to lead to more extreme temperatures and changes in precipitation patterns [4], which could disrupt the ideal conditions for many species including O. europaea and impacting their survival and continuity.
3.3. Effect of Environmental Variables on the Abundance of O. europaea
The number of O. europaea was 119 ± 98 trees ha−1, with minimum and maximum populations varying from 25 to 475 trees. The Spearman’s correlation test revealed a positive correlation between the tree’s abundance and mean annual rainfall, altitude, slope, soil organic carbon content, and silt content of the soil (p < 0.05), but a negative relation with bulk density, soil clay content, soil pH, and sand (Table 3). This demonstrates that the presence and abundance of the species depend significantly on factors such as annual rainfall, altitude, slope, soil organic carbon, and silt content, whereas the suitable habitats and abundance of the tree decline with an increase in bulk density, soil clay content, soil pH and sand. According to Bekele-Tesemma [41] and Negash [16]; the ecological distribution of the tree is greater in areas with altitudes higher than 1500 m and tolerates low rainfall. In another study by Wegasie et al. [18] in the dry Afromontane forests of Tigray, reported that topographic factors such as elevation and slope have a significant role in the distribution of O. europaea and J. procera. Aerts et al. [43] and Wubet et al. [59] also reported that the abundance of late-successional species (such as O. europaea and J. procera) in the dry Afromontane forests is more prevalent at higher elevations. This is because these species are climax trees and mostly have deep roots that can grow even on rocky grounds and withstand harsh conditions. A study by Linera and Lorea [60] also indicated that environmental factors such as elevation, slope, soil, temperature, and precipitation parameters together with human factors determine species composition, diversity, and abundance in forest ecosystems.
| Spearman’s correlations | ||||||||||||
|---|---|---|---|---|---|---|---|---|---|---|---|---|
| Alt | Mean temp | Rain | Slope | Bulk density | Cation | Clay | Course | SOC | Soil pH | % of silt | Sand | |
| Correlation coefficient | 0.172 ∗ | 0.071 | 0.237 ∗∗ | 0.215 ∗∗ | −0.253 ∗∗ | 0.082 | −0.255 ∗∗ | 0.067 | 0.356 ∗∗ | −0.431 ∗∗ | 0.161 ∗ | −0.234 ∗∗ |
| Sig | 0.014 | 0.281 | 0.000 | 0.001 | 0.000 | 0.213 | 0.000 | 0.306 | 0.000 | 0.000 | 0.014 | 0.000 |
| N | 232 | 232 | 232 | 232 | 232 | 232 | 232 | 232 | 232 | 232 | 232 | 232 |
- ∗∗ and ∗represent significant correlations at the 0.01 and 0.05 levels, respectively (2-tailed).
3.4. Current and Future Distribution of O. europaea
Currently, about 3.01% (1979 km2) of the mass area of Tigray is estimated to be O. europaea-suitable habitat (Table 4). By 2070, the RCP4.5 scenario indicates that the amount of potentially appropriate habitats for the tree’s distribution would have increased by about 4.5 times (13.64%) (Table 4). The suitability map (Figure 5) also shows the highest gain of new suitable areas in the southern and eastern parts of the region under the same scenario and time period. However, under the RCP8.5 scenario, the current proportion of suitable areas is predicted to decrease to 0.68% by 2050 and to 0% by 2070. Therefore, under the high emission scenario (RCP8.5), the entire viable habitats for the tree will be lost, leading to the species’ local extinction in the region. A study by Khan and Verma [35] reported that the suitable habitat for O. europaea is projected to decrease in many parts of the globe by 42.11% and 46.46% under RCP4.5 by 2050 and 2070, respectively; and by 46.88% and 60.8% under RCP8.5 by 2050 and 2070, respectively. However, in our prediction model, an increase of suitable habitat is projected under RCP4.5. In agreement with our results, a recent study on Balanites aegyptiaca in drylands of north Ethiopia predicts its distribution to increase from 3% to 6% under RCP4.5 by the end of this century. However, under the worst-case scenario RCP8.5, its suitable area is expected to be depleted by mid or end of this century, indicating local species extinction [9]. Another study by Birhane et al. [8] on Dracaena ombet and Dobra glabra in northern Ethiopia also predicts a significant loss of future suitable habitats for the species by 48% to 83% for D. ombet and 35% to 87% for D. glabra under future climate. The decline in the suitable geographical range of the species under RCP8.5 could be attributed to factors such as increasing temperatures, fluctuation in future temperature patterns, and decrease in precipitation, especially in driest months. These changes in climate conditions, particularly under the high emission scenario RCP8.5, can lead to shifts in habitats and ecosystems that may no longer support certain species, impacting their geographical range and survival. Similarly, recent studies in Ethiopia have reported that several indigenous species are anticipated to lose their geographical ranges due to impending climate change. Examples include Vachellia negri [61], Adonsonia digitata [7], and Hagenia abyssinica [62].
| Time frames | Unsuitable area (km2) | Suitable area (km2) | Percent (%) |
|---|---|---|---|
| Current | 63684 | 1979 | 3.01 |
| 2050_RCP4.5 | 62971 | 2601 | 3.97 |
| 2050_RCP8.5 | 65126 | 446 | 0.68 |
| 2070_RCP4.5 | 56625 | 8947 | 13.64 |
| 2070_RCP8.5 | 65572 | 0 | 0 |
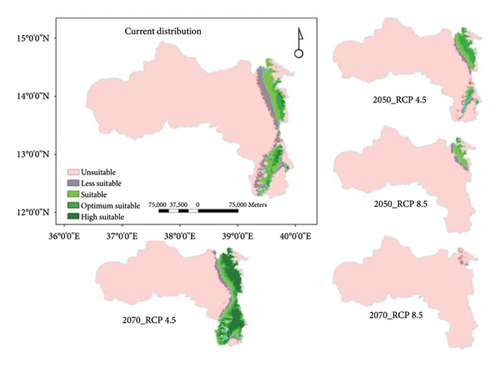
However, according to estimates made by Abrha et al. [63] in Grat-Kahsu forest in Tigray region, future climate change would increase the current suitable habitats for Acacia abyssinica, Carissa edulis, and Juniperus procera. A study by Gufi et al. [9] on Tamarindus indica in Tigray region, northern Ethiopia, also indicated the suitable habitat in both RCP4.5 and RCP8.5 is expected to increase from the current 14% to 44.78% and 16.85%, respectively. This is because, despite future climate change potentially resulting in reduction and extinction of many species [4], there may also be an opportunities for some species to expand into suitable habitats, particularly forests [9, 64, 65].
4. Conclusions
This research explores how future climate change affects the distribution of O. europaea tree species and examines its relationship with environmental factors in Tigray region, northern Ethiopia. The key environmental variables influencing the occurrence of the species are temperature seasonality, altitude, and precipitation during the driest month. Furthermore, abundance of the tree is positively correlated with annual rainfall, altitude, slope, soil organic carbon, and silt content of soils. The current potential distribution of the tree covers only 3.01% of the total land mass of the Tigray. Future projections indicate a substantial increase in suitable habitats under the RCP4.5 scenario by 2070, but a drastic decline and eventual local distinction under the RCP8.5 scenario by the same year. These findings have implications for policy decisions regarding land use intensification and climate adaptation, particularly in areas like Tigray.
Conflicts of Interest
The authors declare that they have no conflicts of interest.
Authors’ Contributions
Yirga Gufi designed the research protocols, collected all necessary data, performed data analysis, wrote the first draft of the manuscript, and revised the manuscript. Berihu Tesfamariam designed the research protocols, contributed to data collection, and revised and edited the manuscript. Ashenafi Manaye designed the research protocols and wrote the first draft of the manuscript. Ambago Desalegn contributed to data collection and performed data analysis. Tesfay Gidey and Sibhatleab Hintsa contributed in interpreting and editing the manuscript. Haftu Abrha performed data analysis.
Acknowledgments
We performed the main task as part of employment at the Ethiopian Forestry Development, Mekelle Center. We kindly acknowledge the Ethiopian Forestry Development for its financial support to the study. We are also thankful to all the forest experts and forest rangers for their support during the fieldworks. We would like to express our sincere gratitude to the PASET Regional Scholarship and Innovation Fund (RSIF) DOCTAS project, funded by the Carnegie Corporation of New York, International Centre of Insect Physiology and Ecology (ICIPE), for the invaluable support to Haftu Abrha as a research coordinator. In addition, we acknowledged to the Foundation Franklinia (grant Id: 2020-15), the Rufford Foundation (grant numbers: 21680-1, 26273-2, 31671-B, 40760-D and 44765-C) and the People′s Trust for Endangered Species for their support to Tesfay Gidey to participate in the study.
Open Research
Data Availability
All data generated and/or analyzed during this study are available from the corresponding author upon reasonable request.


