Stochastic Optimal Reconfiguration and Placement of Photovoltaic Systems in Distribution Networks: A Real Case Study
Abstract
In this paper, a stochastic multi-objective (MO) modeling for the optimal reconfiguration and placement of photovoltaic (PV) systems in distribution networks (DNs) is presented. The main objectives are to jointly maximize the profit of generating companies (GenCos) as well as to minimize the distribution company’s (DisCo) costs and the expected interruption cost (ECOST). This approach can provide numerous economic and technical advantages for all players in the restructured power system, including GenCos, DisCos, and customers. To attain more practical and accurate results in the simultaneous placement of PVs and reconfiguration, uncertainties are considered in the problem formulation. To cope with the stochastic behavior of PV systems, electricity prices, and demands in the DN, the scenario approach is used. The proposed optimization problem is solved by the dragonfly algorithm (DA) and the best compromise solution is chosen using a fuzzy satisfying criterion. The results are also compared with the particle swarm optimization (PSO) algorithm. To confirm the effectiveness of the proposed MO model, it is implemented on the IEEE 33-bus DN and simulated in various case studies. The model is also applied to a real DN. The results confirm that the proposed model gives a more desired schedule than previous approaches, as all players in the DN including the PV owners, DisCo, and customers are satisfied at the same time.
1. Introduction
Recently, researchers have shown an increased interest in using distributed energy resources (DERs) such as wind and photovoltaic (PV) systems in distribution networks (DNs) [1, 2]. In addition, power quality and reliability improvements can be achieved for the customers by proper integration of DERs [3]. However, DNs can face serious security challenges, if DERs cannot appropriately and optimally integrate into the network. Accordingly, optimal sitting/sizing of DERs in the DN plays an important role in increasing the security, power quality, and reliability of the power system and reducing the costs of distribution companies (DisCos) [4]. Moreover, solving this optimization problem can lead to reducing customer interruption costs and increasing DER owners’ profit in a deregulated power system. To date, various methods have been developed and introduced for optimal sitting/sizing of DER based on single-objective (SO)/multi-objective (MO) functions [5, 6, 7, 8, 9]. Moreover, optimal sitting/sizing of DER along with optimal network reconfiguration has received critical attention due to high performance and efficiency [10].
Recent advances in the electricity industry have brought many benefits to grid operators and other players of DNs. Distribution network reconfiguration is one of the best tools to address the problem of DNs [11]. It is a problem in which the open/close conditions of switchable ties are determined to attain optimal configuration. The most important benefits of reconfiguration are the reduction of losses and improvement of voltage profile as well as reliability. Therefore, optimal distribution network reconfiguration can be introduced individually as a critical optimization problem to improve the power quality and reliability of DNs. Nevertheless, simultaneous optimal sitting/sizing of DER and network reconfiguration can provide more advantages for DER owners by changing the switch conditions in such a way that more power can be supplied to the consumers [10].
1.1. Literature Review
The optimal sitting/sizing of DER with optimal network reconfiguration as a separate optimization problem in DN is the best solution for coping with the challenges stemming from the high penetration of such sources. In [12], a MO reconfiguration for enhancing the voltage profile, reducing real power losses, and improving the voltage unbalance index for a DN is suggested based on the fast nondominated sorting genetic algorithm. Niknam [13] proposed a MO reconfiguration based on honey bee mating optimization to reduce the number of switching operations, and the real power loss and to improve the voltage profile. To minimize the loss of large-scale distribution systems, a system reconfiguration is also presented in [14]. Mazza et al. [15] offered an optimal MO reconfiguration for a distribution network to reduce energy not supplied (ENS) and power loss. The major drawback of this study is that the objective function is optimized only from DisCo’s viewpoint. In [16], an optimal reconfiguration for a real feeder is investigated. In a similar study, Ahuja et al. [17] suggested a MO reconfiguration. A MO reconfiguration using the discrete particle swarm optimization is proposed in [18]. Reduction of power loss, the number of switching operations, and enhancement of voltage profile are the main objectives of this paper. In [19], a reconfiguration method to reduce active power losses and improve the reliability index using the Ԑ-constraint is presented. A runner-root algorithm is used to cope with system reconfiguration in [20].
Several papers have been published on the joint optimal placement of DERs and system reconfiguration. In [10], the authors use system reconfiguration in the presence of DERs for power loss reduction and load restoration improvement. In [21], a method is suggested for optimal network reconfiguration in radial distribution networks with DERs to increase the load balance factor index and reduce power loss. A MO reconfiguration using an enhanced gravitational search algorithm for radial systems considering DERs is presented in [22]. In [23], using mixed-integer linear programing (MILP), the reconfiguration issue in the distribution network in the presence of DERs is investigated. The loss reduction from the DisCo view is the only objective of this paper. In another major study, Nikkhah and Rabiee [24] suggested a long-term planning model for a hybrid system in which the grid voltage stability is considerably improved.
In [25], in addition to considering reliability and power quality issues from the DisCo view, the cost of DERs from the distributed generation (DG) owners’ point of view is optimized using the PSO. The PSO is also used for dynamic and static reconfiguration with the optimized allocation of PV-DG and storage systems in [26]. Adaptive GA is employed to optimize the allocation of DERs in the DN considering uncertainties for loads and generations in [27]. In [28], the optimal network reconfiguration considering DERs is presented to reduce power and operation costs as well as to improve the voltage profile. In the same vein, Nasiraghdam and Jadid [29] presented the optimal network reconfiguration considering DERs using the artificial bee colony algorithm. Reconfiguration of DNs in the presence of DERs is done using the PSO algorithm in [30], to achieve an improved voltage profile and minimize switching operation costs. A joint feeder reconfiguration and optimal sizing method for DERs using the teaching–learning algorithm is proposed in [31]. In this study, ENS, power loss, and voltage profile are optimized only from the DisCo view. An optimal network reconfiguration with the presence of DERs to improve the distribution grid hosting capacity using a linearized power flow model is proposed in [32]. In [33], the optimal DG allocation and network reconfiguration are optimized considering probabilistic loads and DGs to enhance the voltage stability and loss profile. In [34], an optimization method is suggested for the dynamic feeder reconfiguration problem in the distribution system over multiple time intervals considering DERs. In another major study, Lotfi et al. [35] suggested a MO framework for feeder reconfiguration along with capacitor allocation problems over multiple time intervals considering DERs. A network reconfiguration and allocation of capacitor units in a radial distribution system using an enhanced artificial bee colony optimization is also proposed in [36]. In [36], the MO problem is considered as a combination of ENS and emission produced by DG units and grid; moreover, network loss is defined as the other objective function.
For better comparison, a summary of the abovementioned papers is given in Table 1. As can be seen, remarkable papers either separately or jointly have been published on DG sitting/sizing and network reconfiguration. However, the optimal sitting/sizing of DGs with network reconfiguration at the same time is not considerably taken into account due to the complexity of the problem. As stated before, it is required to take into account the influence of intermittency of DERs such as PV systems, the fluctuations in load demand, and electricity price in system reconfiguration. As can be observed in Table 1, very few studies have investigated the impact of uncertainties of electricity price, load as well as DERs at the same time. Furthermore, most of the MO optimization models presented in the above literature have been investigated only from DisCo’s point of view. It is apparent from the table that very few papers are focused on optimization models from DG owners’ or customers’ perspectives. However, there appears to be an absence of an MO optimization model for optimal sitting/sizing of DGs and network reconfiguration from DisCo’s, generating companies (GenCos), and customers’ points of view, simultaneously.
| References | Objective | Reconfiguration | DG | Uncertainty | Objectives | |||||||||
|---|---|---|---|---|---|---|---|---|---|---|---|---|---|---|
| O1 | O2 | R1 | DG1 | DG2 | DG3 | U1 | U2 | U3 | A1 | A2 | A3 | A4 | A5 | |
| [12] | ● | — | ● | — | — | — | — | — | — | ● | — | ● | — | — |
| [13] | ● | — | ● | — | — | — | — | — | — | ● | — | ● | — | — |
| [14] | — | ● | ● | — | — | — | — | — | — | ● | — | — | — | — |
| [15] | ● | — | ● | — | — | — | — | — | — | ● | ● | — | — | — |
| [16] | ● | — | ● | — | — | — | — | — | — | ● | ● | — | — | — |
| [17] | ● | — | ● | — | — | — | — | — | — | ● | — | ● | — | — |
| [18] | ● | — | ● | — | — | — | — | — | — | ● | — | ● | — | — |
| [19] | ● | — | ● | — | — | — | — | — | — | ● | ● | — | — | — |
| [20] | ● | — | ● | — | — | — | — | — | — | ● | — | ● | — | — |
| [21] | — | ● | ● | ● | — | — | — | — | — | ● | — | — | — | — |
| [22] | ● | — | ● | ● | — | — | — | — | — | ● | ● | — | — | — |
| [23] | — | ● | ● | ● | — | — | — | — | — | ● | — | — | — | — |
| [24] | — | ● | ● | ● | ● | ● | — | — | — | — | — | — | — | ● |
| [25] | ● | — | ● | ● | ● | ● | — | — | — | — | ● | — | ● | ● |
| [26] | ● | — | ● | ● | ● | — | ● | ● | — | ● | — | ● | — | — |
| [27] | — | ● | ● | ● | ● | ● | ● | ● | — | ● | — | ● | — | — |
| [28] | — | ● | ● | ● | — | — | — | — | — | — | — | — | — | — |
| [29] | ● | — | ● | ● | ● | — | — | — | — | ● | — | ● | — | — |
| [30] | ● | — | ● | ● | — | — | — | — | — | — | — | ● | ● | — |
| [31] | ● | — | ● | ● | ● | — | — | — | — | ● | ● | — | — | — |
| [32] | — | ● | ● | ● | — | — | — | — | — | — | ● | — | — | — |
| [33] | ● | — | ● | ● | — | ● | ● | — | — | ● | — | ● | — | — |
| [37] | — | — | — | — | — | — | — | — | — | — | — | — | — | — |
| [35] | — | — | — | — | — | — | — | — | — | — | — | — | — | — |
| [36] | — | — | — | — | — | — | — | — | — | — | — | — | — | — |
| Proposed method | ● | ● | ● | ● | ● | ● | ● | ● | ● | ● | ● | ● | ● | ● |
- O1, multi-objective; O2, single-objective; R1, considering reconfiguration; DG1, the attendance of DGs; DG2, optimal DG sizing; DG3, optimal DG siting; U1, demand uncertainty; U2, DERs uncertainty; U3, price uncertainty; A1, loss minimization; A2, reliability enhancement; A3, voltage profile enhancement; A4, DisCo’s cost minimization; and A5, DG owner’s profit maximization.
1.2. Contributions and Paper Organization
- (i)
The optimal reconfiguration model for a restructured distribution network is suggested with the economic aims from PV owners’, DisCo’s, and customers’ perspectives.
- (ii)
The scenario method is used to deal with the uncertainties of loads, PV output, and electricity price.
- (iii)
The sitting/sizing of PV systems in the DN is optimized using the proposed stochastic MO model.
- (iv)
The proposed optimization problem is solved by the DA and the best compromise solution is chosen using fuzzy satisfying criterion.
- (v)
The model is implemented on a standard test system and a real DN in various case studies.
The study is organized as follows. Section 2 describes the uncertainty modeling. Section 3 presents the problem formulation. The DA is described in Section 4. Simulation results are provided in Section 5. Finally, the conclusion is given in Section 6.
2. Uncertainty Modeling
3. Problem Formulation
The competition among different entities in a deregulated environment such as DisCos, PV owners GenCos, and consumers can give many advantages to the power system. In a deregulated power system, DisCos are the owner and operator of the distribution system, which are responsible for buying wholesale electricity either from the upstream market or through direct contracts with GenCos and supplying electricity to the customers. The main objectives of the DisCos are reducing the distribution cost and enhancing the distribution network performance. In addition, a customer is an entity that buys the required electricity demand from DisCos. Therefore, the DN has the responsibility to provide uninterruptible power for the consumer to improve the reliability of the whole power system. On the other hand, a GenCo is an owner–operator of one or more power plants and DGs that sell electricity to the network. The profit of the owners of PVs can be maximized by selling more electricity to the DN. As mentioned above, each of the entities including DisCos, GenCos, and consumers has a unique benefit, but they may have conflicted relationships. Hence, the main aim of this paper is to suggest an optimal network reconfiguration and DGs sitting/sizing at the same time using economic MO functions to reach a trade-off among the three mentioned entities.
3.1. Objective Functions
In this part, three objective functions are presented to model DisCo’s cost, ECOST, and PV owners’ profit as follows.
3.1.1. PV Owners’ Profit Maximization
3.1.2. DisCo’s Cost Minimization
3.1.3. ECOST Minimization
3.2. Constraints
To achieve optimal values for the objective functions, the optimization problems in the power system have specific constraints. In this study, the following constraints are defined for the proposed model.
3.2.1. Radial Constraints
3.2.2. Branch Capacity Limit
The above constraints indicate that for the line ij including a closed switch, the current of the line is lower than its maximum limit.
3.2.3. Voltage Profile
3.2.4. PV Power Generation Limit
3.2.5. Limitation on the Maximum Number of PVs
Using this constraint and the PV power generation constraint, the optimal sitting/sizing of PV systems can be attained with optimal reconfiguration.
4. Dragonfly Algorithm (DA)
Here, the DA is used for solving the MO optimization problem. The main reason behind choosing this algorithm is that it can improve the initial random population for a given problem, converge toward the global optimum, and provide very competitive results compared to conventional algorithms. In addition, it can find very precise approximations of Pareto optimal solutions with high uniform distribution for MO problems.
The DA is a swarm intelligence optimization method initiated by the static and dynamic swarming behaviors of dragonflies, which was first reported by Mirjalili [41]. Swarm intelligence and the particular behavior of dragonflies are the main factors in developing this type of metaheuristic algorithm. Two crucial stages of optimization, including exploration and exploitation, are planned by modeling the social interaction of dragonflies in navigating, finding foods, and escaping enemies when swarming dynamically or statistically. A group of dragonflies with small directions and velocity hunting the prey in a small area are static swarm dragonflies. On the other hand, a variety of dragonflies with the ability to travel long distances in constant directions are called the dynamic swarm. Normally, two vectors including step (DX) and position (X) are applied to update the position of dragonflies in a search space and simulate their movements. The modeling of the DA can be presented in five steps as follows:
Separation: This refers to the avoidance of any static collision between dragonflies.
Alignment: It indicates that the velocity of individual dragonflies matches the velocity of other dragonflies in the neighborhood.
Cohesion: It refers to the tendency of individuals to the center of the mass of the neighborhood.
Attraction: it refers to being attracted to the food source.
Distraction: It refers to an escape from the enemy.
The combination of all five mentioned motions reflects the behaviors of dragonflies. More details about this algorithm can be found in [41].
The mentioned steps can be modeled mathematically as shown below.
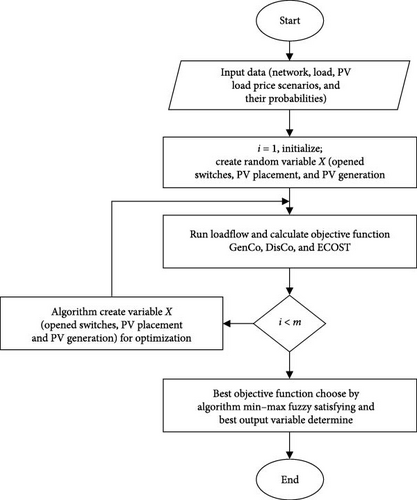
The flowchart of the proposed method is depicted in Figure 1.
5. Simulation Results
To confirm the effectiveness of the proposed model, two different systems including the IEEE 33-bus system and a real DN in Iran are considered and simulated in various cases. In both systems, the stochastic MO model is solved using the DA. In the following subsections, numerical results are provided for both test systems.
5.1. Numerical Results for IEEE 33-Bus DN
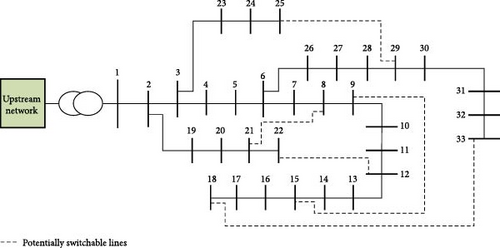
The single-line diagram of the IEEE 33-bus DN contains 37 branches, 32 sectionalizing switches, and five tie switches, as depicted in Figure 2 [42]. The suggested model is simulated in the MATLAB software package, which can solve the optimization problem. The model is optimized by the DA and compared with the PSO. Table 2 depicts the PV-demand-price scenarios of uncertain parameters. For straightforwardness, a single point is considered an operation horizon. It can be extended to a multipoint horizon. Three PV systems are assumed to be dispatched in the test network with a capacity of 1.2 MW for each PV system. As seen, three scenarios for the price of electricity are considered to be paid to the utility grid as $42, $46, and $50. It should be noted that the contract price of PV systems is taken into account as $50 as the transmission cost within the network is ignored. This type of contract with a high price can attract more private investors to install more renewable sources. This paper does not address the uncertainties in the price of electricity for PV systems. In other words, the price of purchasing power from PVs is considered to be fixed as there exists no cost of transmission for the PV units. In the electricity market of Iran, the network policy-makers buy the generated power of PVs at a fixed and attractive price to provide significant profits and support private investors for them. Moreover, to model the load uncertainties, three various scenarios are considered. The solar radiation scenarios of PV systems are also shown in Table 2.
| Scenario number | ($/MWhr) | PDl (%) | RPV(%) | πs | |||
|---|---|---|---|---|---|---|---|
| s1 | 50 | 0.95 | 0 | 0.015126 | |||
| s2 | 50 | 0.95 | 0.25 | 0.00348 | |||
| s3 | 50 | 0.95 | 0.5 | 0.002556 | |||
| s4 | 50 | 0.95 | 0.75 | 0.004071 | |||
| s5 | 50 | 0.95 | 1 | 0.004764 | |||
| Price scenario: | s6 | 50 | 1 | 0 | 0.070588 | ||
| ($/MWhr) | πp | s7 | 50 | 1 | 0.25 | 0.01624 | |
| P1 | 50 | 0.2 | s8 | 50 | 1 | 0.5 | 0.011928 |
| P2 | 46 | 0.6 | s9 | 50 | 1 | 0.75 | 0.018998 |
| P3 | 42 | 0.2 | s10 | 50 | 1 | 1 | 0.022232 |
| s11 | 50 | 1.05 | 0 | 0.015126 | |||
| s12 | 50 | 1.05 | 0.25 | 0.00348 | |||
| s13 | 50 | 1.05 | 0.5 | 0.002556 | |||
| s14 | 50 | 1.05 | 0.75 | 0.004071 | |||
| s15 | 50 | 1.05 | 1 | 0.004764 | |||
| s16 | 46 | 0.95 | 0 | 0.045378 | |||
| s17 | 46 | 0.95 | 0.25 | 0.01044 | |||
| s18 | 46 | 0.95 | 0.5 | 0.007668 | |||
| s19 | 46 | 0.95 | 0.75 | 0.012213 | |||
| Solar radiation scenario: | s20 | 46 | 0.95 | 1 | 0.014292 | ||
| RPV (%) | πPV | s21 | 46 | 1 | 0 | 0.211764 | |
| R1 | 0 | 0.4726 | s22 | 46 | 1 | 0.25 | 0.04872 |
| R2 | 0.25 | 0.1087 | s23 | 46 | 1 | 0.5 | 0.035784 |
| R3 | 0.5 | 0.0798 | s24 | 46 | 1 | 0.75 | 0.056994 |
| R4 | 0.75 | 0.1272 | s25 | 46 | 1 | 1 | 0.066696 |
| R5 | 1 | 0.1488 | s26 | 46 | 1.05 | 0 | 0.045378 |
| s27 | 46 | 1.05 | 0.25 | 0.01044 | |||
| s28 | 46 | 1.05 | 0.5 | 0.007668 | |||
| s29 | 46 | 1.05 | 0.75 | 0.012213 | |||
| s30 | 46 | 1.05 | 1 | 0.014292 | |||
| s31 | 42 | 0.95 | 0 | 0.015126 | |||
| s32 | 42 | 0.95 | 0.25 | 0.00348 | |||
| s33 | 42 | 0.95 | 0.5 | 0.002556 | |||
| s34 | 42 | 0.95 | 0.75 | 0.004071 | |||
| s35 | 42 | 0.95 | 1 | 0.004764 | |||
| Load scenario: | s36 | 42 | 1 | 0 | 0.070588 | ||
| PDl (%) | πp | s37 | 42 | 1 | 0.25 | 0.01624 | |
| P1 | 0.95 | 0.16 | s38 | 42 | 1 | 0.5 | 0.011928 |
| P2 | 1 | 0.68 | s39 | 42 | 1 | 0.75 | 0.018998 |
| P3 | 1.05 | 0.16 | s40 | 42 | 1 | 1 | 0.022232 |
| s41 | 42 | 1.05 | 0 | 0.015126 | |||
| s42 | 42 | 1.05 | 0.25 | 0.00348 | |||
| s43 | 42 | 1.05 | 0.5 | 0.002556 | |||
| s44 | 42 | 1.05 | 0.75 | 0.004071 | |||
| s45 | 42 | 1.05 | 1 | 0.004764 | |||
5.1.1. Case 1: SO Reconfiguration Aiming to Maximize PV Owner’s Profit
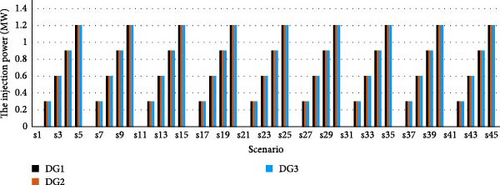
In this case study, the main objective is to maximize the profit of PV owners. The results including the profit of PV owners, PV placement, and the reconfiguration are shown in Table 3. As seen, the profit of PV owners using the DA is $59.9. The cost of the DisCo in this case is $191.563. As can be observed, PV systems are installed at buses 30, 31, and 32, and switches L6−7, L9−10, L12−13, L15−16, and L28−29 are opened in the test system. The installed PVs are not close to the substation and only supply the nearby buses. Moreover, the injection power of PV systems optimized by the proposed DA in all scenarios is depicted in Figure 3. As can be observed, the power generation of PVs is zero in some scenarios, and it is nonzero in most scenarios with the available capacity.
| Optimization method | Profit of DG owners ($) | PV placement | Opened switches |
|---|---|---|---|
| PSO | 59.9 | B30, B31, B32 | L6−7, L9−10, L12−13, L15−16, L28−29 |
| DA | 59.9 | B30, B31, B32 | L6−7, L9−10, L12−13, L15−16, L28−29 |
5.1.2. Case 2: SO Reconfiguration Aiming to Minimize DisCo’s Cost
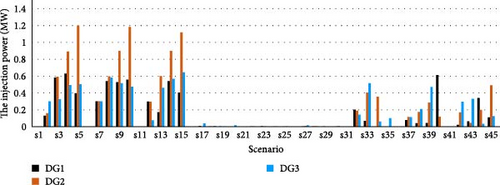
Here, it is aimed to minimize the cost of energy bought from both PVs and the upscale grid. Using this objective, the DisCo pays the lowest money to the PV owners and the upscale grid. The cost of DisCo, optimal PV placement, and network reconfiguration optimized with the DA and PSO, in this case, are presented in Table 4. As seen, the cost of DisCo is considerably reduced in comparison with Case 1. The profit of PV owners is also $11.3748, which its value is notably reduced in comparison with Case 1, due to the changing of the objective function. The ECOST is also equal to $213.49, which is very high. As seen in Table 4, PV systems are installed at buses 6, 12, and 16 in both algorithms. A comparison of Cases 1 and 2 shows that by changing objective functions the location of PVs and network reconfiguration can be changed. Furthermore, the injection power of PV units optimized by the DA is illustrated in Figure 4. As observed, the provided energy by PVs is considerably reduced in this case as the purchased energy from PVs is based on an expensive fixed price that is higher than the utility grid price. The results confirm that the appropriate PV placement and optimal reconfiguration can reduce the costs of DisCos. It is clear that in this case, the power losses of the network are inherently reduced.
| Optimization method | Disco’s cost ($) | PV placement | Opened switches |
|---|---|---|---|
| PSO | 177.37 | B6, B12, B16 | L7−8, L9−10, L14−15, L32−33, L25−29 |
| DA | 177.37 | B6, B12, B16 | L7−8, L9−10, L14−15, L32−33, L25−29 |
5.1.3. Case 3: SO Reconfiguration Aiming to Minimize the ECOST
In this part, the main objective is to minimize the ECOST. Minimizing ECOST empowers the planners to select the adequate class of reliability for end-users and develop proper operation policies with low cost. The jointly optimal PV placement and network reconfiguration are optimized with the DA and compared with the PSO to minimize the ECOST. Table 5 gives the ECOST, optimal PV placement, and reconfiguration with both algorithms. The profit of PV owners and the cost of the DisCo, in this case, are $55.9 and $186.38, which varies with Cases 1 and 2. Here, the locations of PVs and configuration are changed such that the interruption cost of customers is minimized to $154.2. In addition, the injection power of PV systems optimized by used algorithm is explained in Figure 5. As seen, the purchased energy through PVs is significantly increased in this case to minimize the ECOST. As observed from the results, the ECOST can be minimized by optimal reconfiguration and PV placement at the same time.
| Optimization method | ECOST ($) | PV placement | Opened switches |
|---|---|---|---|
| PSO | 155.1 | B30, B31, B32 | L6−7, L9−10, L12−13, L15−16, L28−29 |
| DA | 154.2 | B16, B17, B18 | L7−8, L10−11, L14−15, L17−18, L28−29 |
5.1.4. Case 4: MO Reconfiguration Aiming to Maximize PV Owner’s Profit and Minimize ECOST
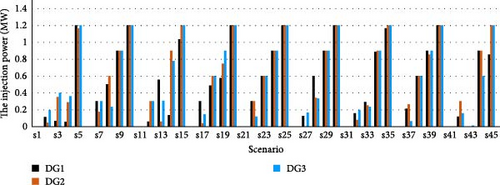
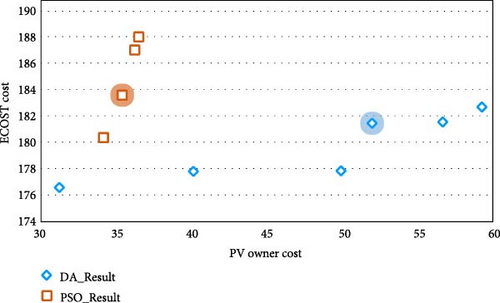
In this part, the Pareto front is attained for the suggested model to optimize the PV owner’s profit and minimize the ECOST. Figure 6 shows the Pareto optimal front achieved for this case study. Table 6 also presents the Pareto results based on the best compromise solution, which is achieved using the min–max fuzzy satisfying method introduced in [43]. As seen, the best trade-off result with the DA is related to solution#3, which is equal to 1.06. For the best result in solution#3, the PV systems are installed at buses 28, 32, and 33, and switches L7−8, L9−10, L14−15, L16−17, and L28−29 are opened, as depicted in Table 7. The maximum PV owner’s profit and the minimum ECOST optimized with the DA and PSO are also given in Table 7. The cost of DisCo in this case is equal to $180.87. The injected power of PV systems optimized by the DA is given in Figure 7.
| Solution# | Ψ1 ($) | Ψ2 ($) | Sum (, ) | ||
|---|---|---|---|---|---|
| PSO | |||||
| 1 | 36.52 | 188.02 | 1.00 | 0.00 | 1.00 |
| 2 | 36.26 | 187.02 | 0.89 | 0.13 | 1.02 |
| 3∗ | 35.42 | 183.59 | 0.53 | 0.58 | 1.11 |
| 4 | 34.18 | 180.36 | 0.00 | 1.00 | 1.00 |
| 5 | 36.52 | 188.02 | 1.00 | 0.00 | 1.00 |
| DA | |||||
| 1 | 59.28 | 182.68 | 1.00 | 0.00 | 1.00 |
| 2 | 56.68 | 181.55 | 0.81 | 0.09 | 0.91 |
| 3∗ | 51.99 | 181.46 | 0.80 | 0.26 | 1.06 |
| 4 | 49.93 | 177.83 | 0.21 | 0.33 | 0.54 |
| 5 | 40.14 | 177.79 | 0.20 | 0.68 | 0.88 |
| 6 | 31.24 | 176.56 | 0.00 | 1.00 | 1.00 |
| 7 | 59.28 | 182.68 | 1.00 | 0.00 | 1.00 |
- ∗The best trade-off result.
| Case 4 | PV owner’s profit ($) | ECOST ($) | PV placement | Opened switches |
|---|---|---|---|---|
| PSO | 35.42 | 183.59 | B13, B18, B26 | L7−9, L9−10, L14−15, L18−33, L28−29 |
| DA | 51.99 | 181.46 | B28, B32, B33 | L7−8, L9−10, L14−15, L16−17, L28−29 |
5.1.5. Case 5: MO Reconfiguration Aiming to Maximize PV Owner’s Profit and Minimize DisCo’s Cost
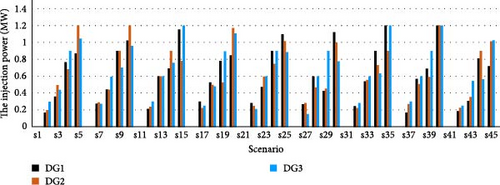
In this case study, the Pareto front is achieved for the recommended MO problem to maximize the PV owner’s profit and minimize DisCo’s cost at the same time. Table 8 also summarizes the Pareto results. As observed, the best trade-off result with the DA is related to solution#3, which is equal to 1.32. Moreover, the best trade-off outcome with the PSO is related to solution#7, which is equal to 1.28. For the best result in solution#3 with the DA, the PV systems can be installed at buses 21, 30, and 32, as depicted in Table 9. As seen, the reconfiguration can have a considerable effect on optimal PV placement. The PV owner’s profit, the DisCo’s cost, and the optimal reconfiguration optimized with the DA and PSO in this case study are also presented in Table 9. The injected power of PV systems optimized by the DA is given in Figure 8. As mentioned earlier, the proposed MO optimization approach can provide many economic and operational advantages for the players in the DN. It should be noted here that by achieving a trade-off between the PV owner’s profit and DisCo’s cost, the losses in the DN are also noticeably minimized inherently through DisCo’s cost, which is highly advantageous from DisCo’s perspective.
| Solution# | Ψ1($) | Ψ2($) | Sum (, ) | ||
|---|---|---|---|---|---|
| DA result | |||||
| 1 | 181.27 | 52.79 | 0.00 | 1.00 | 1.00 |
| 2 | 180.80 | 51.75 | 0.38 | 0.82 | 1.20 |
| 3∗ | 180.55 | 51.34 | 0.57 | 0.75 | 1.32 |
| 4 | 180.55 | 51.28 | 0.58 | 0.74 | 1.32 |
| 5 | 180.55 | 51.28 | 0.58 | 0.74 | 1.32 |
| 6 | 180.51 | 50.95 | 0.61 | 0.68 | 1.29 |
| 7 | 180.42 | 50.22 | 0.68 | 0.55 | 1.24 |
| 8 | 180.40 | 50.15 | 0.69 | 0.54 | 1.23 |
| 9 | 180.36 | 49.70 | 0.73 | 0.46 | 1.19 |
| 10 | 180.36 | 49.70 | 0.73 | 0.46 | 1.19 |
| 11 | 180.34 | 49.42 | 0.74 | 0.41 | 1.16 |
| 12 | 180.28 | 49.21 | 0.79 | 0.38 | 1.17 |
| 13 | 180.13 | 47.25 | 0.91 | 0.04 | 0.95 |
| 14 | 180.13 | 47.24 | 0.91 | 0.04 | 0.95 |
| 15 | 180.02 | 47.03 | 1.00 | 0.00 | 1.00 |
- ∗The best trade-off result.
| Case 5 | PV owner’s profit ($) | Disco’s cost ($) | PV placement | Open switch |
|---|---|---|---|---|
| PSO | 34.56 | 178.99 | B12, B18, B24 | L7−8, L10−11, L14−15, L17−18, L28−29 |
| DA | 51.34 | 180.55 | B21, B30, B32 | L10−11, L14−15, L16−17, L28−29, L8−21 |
5.1.6. Case 6: MO Reconfiguration Aiming to Minimize DisCo’s Cost and ECOST
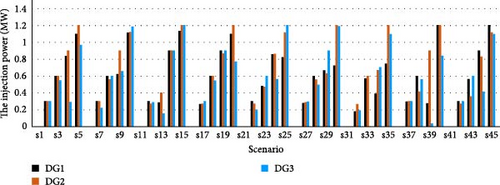
Here, the minimization of the cost of the DisCo and ECOST are considered and the Pareto front is attained for the proposed MO problem. Pareto optimal solution of the proposed model in Case 6 is summarized in Table 10, in which the best trade-off result is achieved in comparison with each SO problem. The min–max fuzzy satisfying technique is employed to attain the best trade-off result related to solution#9 with the DA, which is equal to 1.65. It is related to solution#6 with the PSO, which is equal to 1.49. For the best result in solution#9 with the DA, the PV systems are installed at buses 17, 18, and 31, as shown in Table 11. The ECOST, Disco’s cost, and the optimal configuration optimized with the DA and PSO are also presented in Table 11. The profit of PV owners is also equal to $28.6.
| Solution# | Ψ1 ($) | Ψ2 ($) | Sum (, ) | ||
|---|---|---|---|---|---|
| DA result | |||||
| 1 | 209.61 | 178.13 | 0.00 | 1.00 | 1.00 |
| 2 | 191.08 | 178.27 | 0.52 | 0.96 | 1.47 |
| 3 | 189.73 | 178.31 | 0.56 | 0.94 | 1.50 |
| 4 | 188.90 | 178.63 | 0.58 | 0.84 | 1.42 |
| 5 | 188.89 | 178.63 | 0.58 | 0.84 | 1.42 |
| 6 | 188.89 | 178.63 | 0.58 | 0.84 | 1.42 |
| 7 | 183.74 | 178.71 | 0.73 | 0.81 | 1.54 |
| 8 | 181.66 | 178.79 | 0.78 | 0.79 | 1.57 |
| 9∗ | 178.43 | 178.83 | 0.87 | 0.78 | 1.65 |
| 10 | 176.81 | 179.29 | 0.92 | 0.63 | 1.55 |
| 11 | 176.38 | 179.29 | 0.93 | 0.63 | 1.56 |
| 12 | 175.22 | 179.70 | 0.96 | 0.50 | 1.46 |
| 13 | 175.19 | 179.71 | 0.96 | 0.50 | 1.46 |
| 14 | 174.91 | 181.08 | 0.97 | 0.06 | 1.03 |
| 15 | 173.93 | 181.27 | 1.00 | 0.00 | 1.00 |
- ∗The best trade-off result.
| Case 6 | DisCo’s cost ($) | ECOST ($) | PV placement | Opened switches |
|---|---|---|---|---|
| PSO | 178.81 | 180.16 | B11, B25, B32 | L7−8, L9−10, L14−15, L28−29, L32−33 |
| DA | 178.43 | 178.83 | B17, B18, B31 | L7−8, L10−11, L13−14, L27−28, L32−33 |
5.1.7. Case 7: MO Reconfiguration Aiming to Maximize PV Owner’s Profit, Minimize DisCo’s Cost, and ECOST
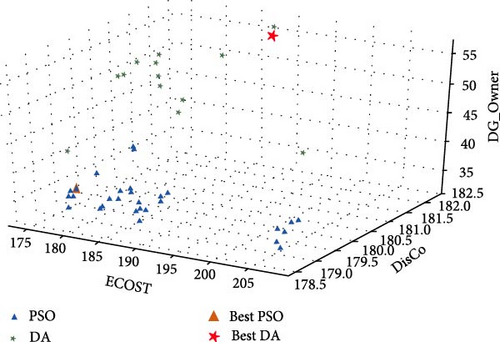
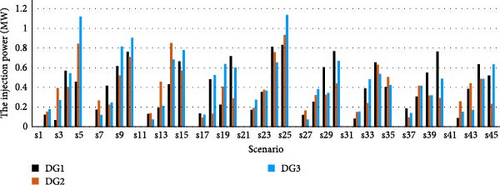
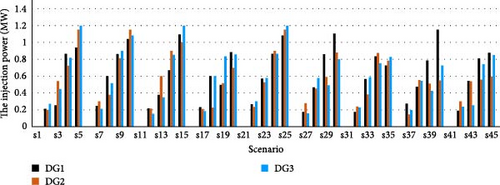
In this part, the Pareto front is attained for the offered MO problem to maximize the PV owner’s profit as well as to minimize DisCo’s cost and ECOST at the same time. Figure 9 displays the results of this case study. The Pareto solutions with DA are presented in Table 12. To select the greatest trade-off result, the min–max fuzzy satisfying method is used. As seen, the best trade-off result is achieved in solution#25, which is equal to 2.23. Table 13 depicts ECOST, DisCo’s cost, and the PV owner’s profit optimized using the DA and PSO. According to the table, the PV systems are installed at buses 26, 32, and 33, and L7−8, L10−11, L14−15, L28−29, and L18−33 are opened. The injected power of the PVs for Case 7 using the DA and PSO are presented in Figures 10 and 11, respectively. According to the results of the IEEE 33-bus DN, dealing with the problem of optimal reconfiguration and PV placement provides a more efficient schedule, as all players in the DN including DisCos, GenCos, and customers are fulfilled jointly. In addition, another important issue affecting PV owners and DisCo plans is the contract price of PV energy. The power loss reduction resulting from the optimal network configuration and PV capacities is calculated in this case to assess the degree of efficient operation of the network.
| Solution# | Ψ1 ($) | Ψ2 ($) | Ψ3 ($) | Sum (, , ) | |||||
|---|---|---|---|---|---|---|---|---|---|
| 1 | 204.10 | 179.90 | 45.45 | 0.00 | 0.82 | 0.28 | 1.11 | ||
| 2 | 204.10 | 179.90 | 45.45 | 0.00 | 0.82 | 0.28 | 1.11 | ||
| 3 | 204.10 | 179.90 | 45.45 | 0.00 | 0.82 | 0.28 | 1.11 | ||
| 4 | 204.10 | 179.90 | 45.45 | 0.00 | 0.82 | 0.28 | 1.11 | ||
| 5 | 204.10 | 179.90 | 45.45 | 0.00 | 0.82 | 0.28 | 1.11 | ||
| 6 | 204.10 | 179.90 | 45.45 | 0.00 | 0.82 | 0.28 | 1.11 | ||
| 7 | 204.10 | 179.90 | 45.45 | 0.00 | 0.82 | 0.28 | 1.11 | ||
| 8 | 204.10 | 179.90 | 45.45 | 0.00 | 0.82 | 0.28 | 1.11 | ||
| 9 | 188.93 | 182.14 | 55.44 | 0.52 | 0.07 | 0.96 | 1.56 | ||
| 10 | 187.87 | 180.96 | 55.15 | 0.56 | 0.46 | 0.94 | 1.97 | ||
| 11 | 187.87 | 180.96 | 55.15 | 0.56 | 0.46 | 0.94 | 1.97 | ||
| 12 | 187.79 | 182.35 | 55.99 | 0.56 | 0.00 | 1.00 | 1.56 | ||
| 13 | 186.77 | 180.05 | 48.08 | 0.60 | 0.77 | 0.46 | 1.83 | ||
| 14 | 185.92 | 180.31 | 49.39 | 0.63 | 0.68 | 0.55 | 1.86 | ||
| 15 | 185.92 | 180.31 | 49.39 | 0.63 | 0.68 | 0.55 | 1.86 | ||
| 16 | 185.92 | 180.31 | 49.39 | 0.63 | 0.68 | 0.55 | 1.86 | ||
| 17 | 182.26 | 180.43 | 50.68 | 0.75 | 0.64 | 0.64 | 2.04 | ||
| 18 | 182.26 | 180.43 | 50.68 | 0.75 | 0.64 | 0.64 | 2.04 | ||
| 19 | 182.26 | 180.43 | 50.68 | 0.75 | 0.64 | 0.64 | 2.04 | ||
| 20 | 181.29 | 180.58 | 51.63 | 0.79 | 0.59 | 0.70 | 2.08 | ||
| 21 | 181.29 | 180.58 | 51.63 | 0.79 | 0.59 | 0.70 | 2.08 | ||
| 22 | 179.74 | 180.81 | 53.01 | 0.84 | 0.52 | 0.80 | 2.15 | ||
| 23 | 179.68 | 180.89 | 54.14 | 0.84 | 0.49 | 0.87 | 2.21 | ||
| 24 | 179.68 | 180.89 | 54.14 | 0.84 | 0.49 | 0.87 | 2.21 | ||
| 25∗ | 176.82 | 180.51 | 51.19 | 0.94 | 0.61 | 0.67 | 2.23 | ||
| 26 | 176.20 | 180.96 | 51.99 | 0.96 | 0.46 | 0.73 | 2.15 | ||
| 27 | 175.96 | 180.53 | 50.77 | 0.97 | 0.61 | 0.65 | 2.23 | ||
| 28 | 175.96 | 180.53 | 50.77 | 0.97 | 0.61 | 0.65 | 2.23 | ||
| 29 | 175.96 | 180.53 | 50.77 | 0.97 | 0.61 | 0.65 | 2.23 | ||
| 30 | 175.10 | 179.37 | 41.26 | 1.00 | 1.00 | 0.00 | 2.00 | ||
- ∗The best trade-off result.
| Case 7 | ECOST ($) | DisCo’s cost ($) | PV owner’s profit ($) | DG placement | Opened switches |
|---|---|---|---|---|---|
| PSO | 177.86 | 179.05 | 36.58 | B15, B20, B30 | L7–8, L9–10, L14–15, L28–29, L18–33 |
| DA | 188.93 | 182.14 | 55.44 | B26, B32, B33 | L7–8, L10–11, L14–15, L28–29, L18–33 |
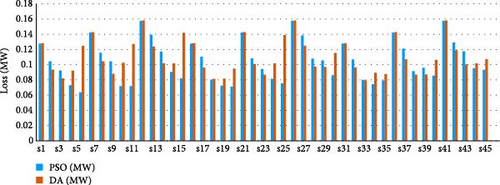
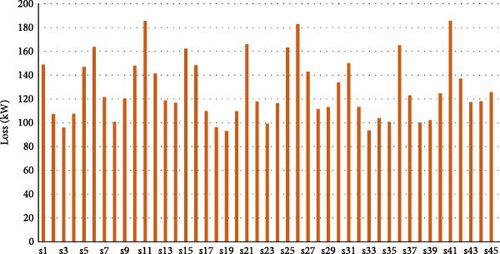
The variation of active power loss of the test system in all scenarios for this case is depicted in Figure 12. As can be seen in this case, when a trade-off is achieved among the PV owner’s profit, DisCo’s cost, and ECOST, power losses of the network is minimized significantly. For better assessments, all considered indexes for optimization and the standard deviation (std) of the voltages in all cases using the DA are provided in Table 14. It is obvious from the results that this problem can be addressed as a multi-objective problem that considers the benefits of all players in the DN. Moreover, using the proposed optimization approach, the standard deviation of the voltage is reached to one per unit compared with without using the proposed approach.
| Scenario | S1 | S2 | S3 | S4 | S5 | S6 | S7 |
|---|---|---|---|---|---|---|---|
| ECost ($) | 178.574 | 213.495 | 154.216 | 181.464 | 195.991 | 178.434 | 181.516 |
| Disco ($) | 181.711 | 177.369 | 186.551 | 180.877 | 180.551 | 178.831 | 180.474 |
| DG owner ($) | 59.750 | 11.375 | 55.901 | 51.992 | 51.344 | 28.610 | 50.841 |
| Power loss (MW) | 0.132 | 0.132 | 0.243 | 0.127 | 0.124 | 0.125 | 0.124 |
| Voltage std | 0.017 | 0.016 | 0.027 | 0.017 | 0.016 | 0.017 | 0.017 |
5.2. Real DN
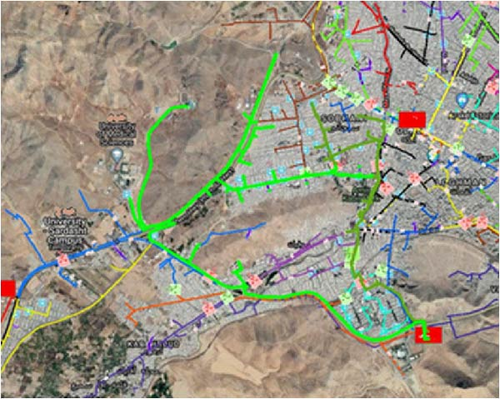
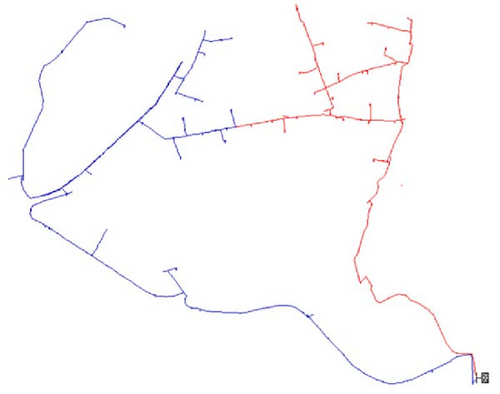
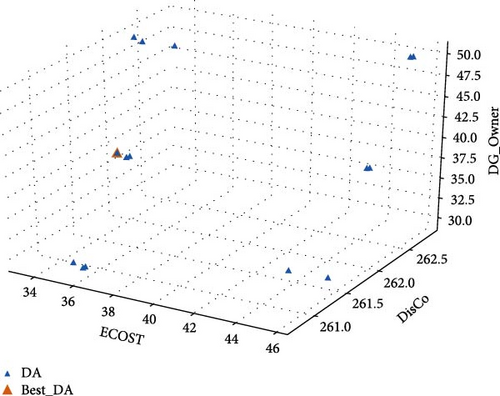
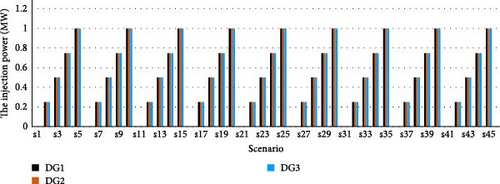
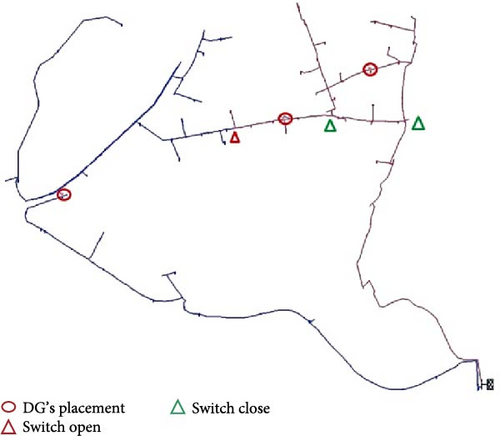
In this part, the suggested model is applied to a real DN in Iran. The real distribution network is shown in Figure 13. The name of the right-side feeder with red color is #518 and the left side with blue color is #512. For this case study, three PV systems are permitted to be installed in the DN, each with a rated capacity of 1 MW. The Pareto front is achieved for the suggested model to optimize the PV owner’s profit, minimizing DisCo’s cost, and ECOST. Figure 14 shows the Pareto optimal front achieved for this case study. Table 15 illustrates the Pareto results. As seen, the best trade-off results are attained using the DA in solution#9, which is equal to 2.3. Table 16 presents the values of the ECOST, Disco’s cost, and PV owner’s profit before PV installation and reconfiguration as well as after optimal reconfiguration and PV allocation using the DA. The power generation of PV systems in the real DN is shown in Figure 15. The optimal placement of PVs and optimal reconfiguration of DN in real system are also depicted in Figure 16. The variation of active power loss of the real DN in all scenarios is shown in Figure 17. As seen, when a compromise is attained among all players in the DN, power losses of the system is reduced considerably. Table 17 also compares the amount of load, losses, maximum loading, and minimum voltage before and after optimization in two considered feeders.
| Solution# | Ψ1 ($) | Ψ2 ($) | Ψ3 ($) | Sum (, , ) | |||
|---|---|---|---|---|---|---|---|
| DA result | |||||||
| 1 | 35.99 | 260.79 | 29.90 | 0.80 | 0.99 | 0.00 | 1.79 |
| 2 | 35.87 | 261.48 | 39.86 | 0.81 | 0.66 | 0.50 | 1.97 |
| 3 | 35.76 | 262.18 | 49.83 | 0.82 | 0.31 | 1.00 | 2.14 |
| 4 | 43.71 | 261.48 | 29.90 | 0.16 | 0.66 | 0.00 | 0.81 |
| 5 | 45.37 | 262.13 | 39.86 | 0.02 | 0.34 | 0.50 | 0.86 |
| 6 | 45.21 | 262.81 | 49.83 | 0.03 | 0.01 | 1.00 | 1.04 |
| 7 | 35.27 | 260.82 | 29.90 | 0.86 | 0.97 | 0.00 | 1.84 |
| 8 | 35.15 | 261.50 | 39.86 | 0.87 | 0.64 | 0.50 | 2.02 |
| 9∗ | 33.63 | 262.20 | 49.83 | 1.00 | 0.30 | 1.00 | 2.30 |
| 10 | 45.43 | 262.15 | 39.86 | 0.01 | 0.33 | 0.50 | 0.84 |
| 11 | 45.59 | 261.49 | 29.90 | 0.00 | 0.65 | 0.00 | 0.65 |
| 12 | 35.95 | 260.76 | 29.90 | 0.81 | 1.00 | 0.00 | 1.81 |
| 13 | 35.82 | 261.45 | 39.86 | 0.82 | 0.67 | 0.50 | 1.99 |
| 14 | 34.26 | 262.15 | 49.83 | 0.95 | 0.33 | 1.00 | 2.28 |
| 15 | 45.28 | 262.83 | 49.83 | 0.03 | 0.00 | 1.00 | 1.03 |
- ∗The best trade-off result.
| Real DN case | ECOST | DisCo’s cost | PV owner’s profit | |
|---|---|---|---|---|
| Before optimization | 46.217 | 259.643 | 0 | |
| DA | 33.632 | 262.202 | 49.826 | |
| Feeder name | Load (MW) | Losses (kW) | Max line loading (%) | Min voltage (p.u.) |
|---|---|---|---|---|
| Before optimization | ||||
| #518 | 2.30 | 67 | 86 | 0.957 |
| # 512 | 3.16 | 126 | 92 | 0.943 |
| After optimization | ||||
| #518 | 3.419 | 65 | 82 | 0.964 |
| #512 | 2.043 | 52 | 87 | 0.957 |
6. Conclusion
A MO stochastic model for PV placement and reconfiguration of DNs at the same time is proposed in this paper. The model is investigated on a standard test system and a areal DN in the Iran power market from GenCo’s point of view in which the profit of PV owners are maximized. It is also evaluated from DisCo’s point of view in which the total cost of power procurementis minimized and also assessed from the customer’s perspective in which the ECOST is minimized. The mentioned objectives are satisfied by considering the operational and physical limitations of the DN. To achieve more practical results, the uncertainties of PV systems, electricity prices, and demands are modeled using the scenario approach. To solve the suggested model, the DA is employed. The performance of the DA in all case studies is compared with the PSO. The fuzzy satisfying criterion is also used to find the best compromise solution. The DA is very simple and easy to implement and shows reasonable performance to optimize various problems in different areas. Furthermore, having few parameters for tuning is another advantage of DA. Moreover, the convergence time of the algorithm is reasonable. This study is expected to be a beneficial reference for researchers and engineers involved in deregulated power distribution systems.
Abbreviations
-
- ENS:
-
- Energy not supplied
-
- DA:
-
- Dragonfly algorithm
-
- PV:
-
- Photovoltaic
-
- PSO:
-
- Particle swarm optimization
-
- DN:
-
- Distribution network
-
- ECOST:
-
- Expected interruption cost
-
- GenCos:
-
- Generating companies
-
- DER:
-
- Distributed energy resource
-
- DisCos:
-
- Distribution companies
-
- MILP:
-
- Mixed-integer linear programing
-
- SO:
-
- Single-objective
-
- DG:
-
- Distributed generation
-
- MO:
-
- Multi-objective
-
- PDF:
-
- Probability density function.
Conflicts of Interest
The authors declare that there are no conflicts of interest regarding the publication of this paper.
Authors’ Contributions
Mohammad Najafi and Mohammad Reza Miveh contributed equally to this manuscript.
Open Research
Data Availability
All data used to support the findings of this study are available from the corresponding author upon request.


