Cost-Effectiveness Analysis of the Optimal Control Strategies for Multidrug-Resistant Tuberculosis Transmission in Ethiopia
Abstract
Despite the recent progress of global control efforts, tuberculosis (TB) remains a significant public health threat worldwide, especially in developing countries, including Ethiopia. Furthermore, the emergence of multidrug-resistant tuberculosis (MDR-TB) has further complicated the situation. This study aims at identifying the most effective strategies for combating MDR-TB in Ethiopia. We first present a compartmental model of MDR-TB transmission dynamics in Ethiopia. The model is shown to have positive solutions, and the stability of the equilibrium points is analyzed. Then, we extend the model by incorporating time-dependent control variables. These control variables are vaccination, distancing, and treatment for DS-TB and MDR-TB. Finally, the optimality system is numerically simulated by considering different combinations of the strategies, and their cost effectiveness is analysed. Our finding shows that, among single control strategies, the successful treatment of drug-susceptible tuberculosis (DS-TB) is the most effective control factor for eliminating MDR-TB transmission in Ethiopia. Furthermore, within the six dual control strategies, the combination of distancing and successful treatment of DS-TB is less costly and more effective than other strategies. Finally, out of the triple control strategies, the combination of distancing, successful treatment for DS-TB, and treatment for MDR-TB is the most efficient strategy for curbing the MDR-TB disease in Ethiopia. Thus, to reduce MDR-TB efficiently, it is recommended that authorities focus on treating MDR-TB, effective treatment of DS-TB, and promoting social distancing through public health education and awareness programs.
1. Introduction
Tuberculosis (TB) is a bacterial infection that primarily affects the lungs. The transmission of TB occurs through the air when an infected individual coughs, sneezes, or spits [1].
Tuberculosis infection has two stages. The first period of TB infection is called the latent phase. An individual in the latent phase does not show symptoms and is noncontagious to others. Tuberculin skin tests or blood tests are used to diagnose latent TB. Most latent TB patients will stay long without progressing to the next stage. However, persons infected with HIV and other diseases and children are at high risk for progressing from latent TB to the second stage. The second stage of infection is called active TB infection. At this stage, individuals can infect susceptible people and show TB symptoms. Chest X-ray screening can identify active tuberculosis. Taking antibiotics for six months can effectively treat active TB [2].
We can categorize TB disease into two classes based on its response to drugs: drug-susceptible TB (DS-TB) and multidrug-resistant TB (MDR-TB). Drug-susceptible TB is a type of tuberculosis that can be treated with the usual medicines. On the other hand, multidrug-resistant TB is resistant to at least two medications, isoniazid (INH) and rifampin (RIF) [3]. The improper treatment of patients and poor management of the supply and quality of drugs result in the bacterium acquiring multidrug-resistant tuberculosis [4, 5].
The treatment of MDR-TB has always been more complicated than the treatment of DS-TB. It requires the use of second-line drugs or reserved drugs for up to two years. These drugs are more costly and cause more side effects. Also, because it takes a longer time to recover from MDR-TB, this may result in more people being infected [6]. The best way to stop the spread of drug-resistant TB is to take all DS-TB drugs as directed by your physician. There should be no early treatment termination or missed doses [3].
According to the 2022 WHO report, there has been a rise in the global number of tuberculosis cases and deaths from 2019 to 2021. In 2021, it is estimated that around 10.6 million individuals contracted tuberculosis, compared to 10.1 million in 2020. Additionally, the number of tuberculosis-related deaths reached 1.6 million in 2021 (including 187,000 individuals living with HIV), while in 2020, there were 1.5 million deaths recorded (including 214,000 individuals with HIV). Furthermore, the incidence rate of tuberculosis increased by approximately 3.6% in 2021 compared to 2020 [7].
Tuberculosis continues to be a significant public health problem in Ethiopia. Ethiopia ranked twelfth among the top 30 countries with high TB burden. Ethiopia ranked twenty-fourth among the countries with high multidrug-resistant TB (MDR-TB) burden [8]. Although progress has been achieved in reducing the incidence of tuberculosis, with a decrease from 421 cases per 100,000 (in 2000) to 132 cases per 100,000 (in 2020), the occurrence of drug-susceptible TB (DS-TB) and the associated mortality rate remain high [9].
Mathematical modelling is essential in understanding the epidemic’s trajectory and designing effective control measures under assumptions [10, 11]. In this study, a mathematical model is formulated for the transmission dynamics of MDR-TB in Ethiopia with optimal control and cost-effectiveness analysis.
2. Model Formulation and Analysis
2.1. MDR-TB Model
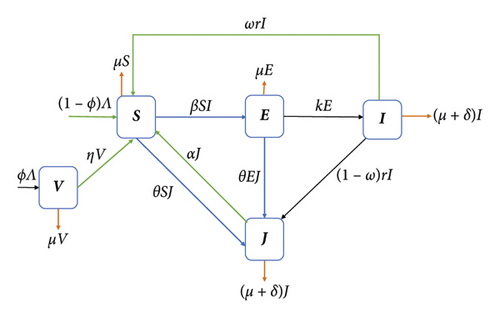
This section presents the mathematical model for multidrug-resistant tuberculosis (MDR-TB). This model is comprised of a set of ordinary differential equations. By considering a homogeneous mixing within the population, the total population N(t) is subdivided into five epidemiological groups: susceptible individuals S(t), vaccinated individuals V(t), individuals exposed to drug-susceptible TB E(t), infectious individuals with drug-susceptible TB I(t), and infectious individuals with MDR-TB J(t).
Within the model, the parameter Λ represents the rate at which individuals are recruited into the susceptible class. On the other hand, the parameter μ represents the natural death rate for each class within the system. The vaccination rate for healthy individuals is denoted as ϕ. We assume the vaccine is imperfect. Therefore, some of those who have received vaccinations are expected to be exposed to bacteria at a rate of η.
Susceptible individuals will be exposed to drug-susceptible TB if they come into effective contact, at a rate β, with individuals from the I-class. Moreover, it is assumed that the susceptible individuals became MDR-TB infected at a rate θ. Some individuals in class E may progress to class I at rate k. If treatment is administered for the I-class with a rate r, then some will complete their treatment correctly at a rate ωr for (0 ≤ ω ≤ 1). However, some individuals in the I class may fail to take their treatment correctly and may develop MDR-TB at a rate (1 − ω)r. The recovery rate of individuals from infected MDR-TB after treatment is α. It is assumed that the recovered individuals from both classes will move to the S-class. Furthermore, infectious individuals in I and J classes will die due to the disease at a rate δ. Figure 1 shows the model flow diagram.
2.2. Model Analysis
2.2.1. Positivity of the Solution Set
The variables S(t), V(t), E(t), I(t), and J(t) denote the number of people and are assumed to take positive values. From biological and mathematical considerations, it is necessary to prove that starting from positive initial conditions implies that the solution always remains positive.
Theorem 1. If the initial data S(0), V(0), E(0), I(0), and J(0) ≥ 0 are nonnegative, then the solution S(t), V(t), E(t), I(t), and J(t) of system (1) is positive for all t > 0.
Proof. From the first equation of the model, we have (1)
By letting
We have
Then, equation (4) can be described as
So,
Integrating both sides of (6) gives
Similarly, using the second equation of model (1), we obtain that
Equation (8) can be rewritten as
Integrating both sides of (9) gives
Note that from equation (10), we can show that
Similarly, we can show that E(t), I(t), and J(t) are nonnegative. So, the solutions S(t), V(t), E(t), I(t), J(t) of system (1) are positive for all t > 0.
2.2.2. Invariant Region
The invariant region of the model describes the region in which the solution of the model (1) is biologically meaningful.
Theorem 2. The invariant region Ω defined by
2.2.3. The Basic Reproduction Number
Generally, the reproduction number for the coexistence of both diseases in the population is R0 = Max {R1, R2}.
2.2.4. Stability Analysis of the Disease-Free Equilibrium Point
Theorem 3. The DFE, P0, is locally asymptotically stable (LAS) when the basic reproduction number R0 < 1 and is unstable for R0 > 1.
Proof. We determine the local stability of P0 using the eigenvalues of the Jacobian matrix at P0, which is given by
If R2 < 1, then the eigenvalues λ1 = −μ1, λ2 = −(η + μ) and λ3 = (α + δ + μ)(R2 − 1) contain negative real parts. The remaining eigenvalues of G(P0) can be determined from the following submatrix:
The characteristic polynomial of Q is given by
Applying the Routh–Hurwitz stability criterion [15], it can be shown that the eigenvalues of the submatrix Q have negative real parts for R1 < 1. Hence, the disease-free equilibrium point of system (1) is locally asymptotically stable if R0 < 1 and unstable if R0 > 1.
Hence, both DS-TB and MDR-TB will die out from the population if R0 < 1, while both diseases will invade and persist in the population if R0 > 1.
2.2.5. Existence of the Endemic Equilibrium Point (EEP)
- (1)
1 < R1 < 1 + (μ/k) and 0 < R1 − R2 < (1/x2 + x3)[θμ2(r + δ + μ)2 + x2θ(δ + μ) + x3rβ(1 − ω)]
- (2)
R1 > 1 + (μ/k) and 0 < R1 − R2 > (1/x2 + x3)[θμ2(r + δ + μ)2 + x2θ(δ + μ) + x3rβ(1 − ω)]
2.2.6. Analysis of the MDR-TB-Only Model
Theorem 4. Model (30) at DFE, M0 = (Λ(η + μ(1 − ϕ)/μ(η + μ)), (Λϕ/η + μ), 0), is globally asymptotically stable (GAS) for R2 < 1 and unstable for R2 > 1.
Proof. We follow a methodology similar to the stability analysis of [16–20]. We observe that
In view of (11), we have
Let us define a function
We prove now that is negative-definite.
This proves that , whenever R2 < 1. Hence, F(t) is a Lyapunov function on Ω1. Therefore, by LaSalle’s invariance principle [21], every solution of model (30), with any initial conditions in Ω1, approaches M0 as t⟶∞, whenever R2 < 1. Thus, M0 is GAS in the region Ω1.
Theorem 5. If R2 > 1, then model (30) has a unique positive endemic equilibrium M1 = (S∗, V∗, J∗), where
Proof. It follows logically from the above that whenever R2 > 1, a unique positive MDR-TB-only endemic equilibrium point exists.
3. Extension of the Model to Optimal Control
- (i)
Vaccination control (u1): It represents using the Bacillus of Calmette and Guerin (BCG) vaccine.
- (ii)
Distancing control (u2): It represents an effort to protect susceptible individuals from exposure to tuberculosis by effectively reducing contact between vulnerable and infectious individuals. These include isolation of infected persons, social distancing, wearing face masks, diagnostic campaigns, and public health awareness programs.
- (iii)
Treatment for DS-TB (u3): It represents the effort to reduce treatment failure in DS-TB infectious individuals, such as taking care of patients until they complete the treatment.
- (iv)
Treatment for MDR-TB (u4): It represents the effort of treating and curing MDR-TB-infected individuals.
In this optimal control problem, our main objective is to reduce the number of MDR-TB-infected individuals in the population while reducing the overall cost of controlling the disease dynamics.
Subject to the terms of model system (37), the constant Bi measures the relative cost interventions associated with the control ui for i = 1, 2, 3, 4. The functions are the cost functions that correspond to the controls ui, which is nonlinear (as in [22, 23]). In equation (38), the values of t0 and tf are taken as 0 and 20, respectively, to determine Ethiopia’s 20-year (2019–2038) effective MDR-TB control strategy.
3.1. Existence of an Optimal Control
Here, are the adjoint functions. The following result can be obtained by applying Pontryagin’s maximum principle to the existence of the optimal control problem.
Theorem 6. Let , and be the control functions for the control problem given in (37) and , and be the solutions of state variables. Then, there are adjoint variables λ1, λ2, λ3, and λ4 that satisfy the following equations:
Proof. The form of the adjoint system and the transversality conditions associated with this optimal control problem are obtained by applying Pontryagin’s maximum principle [26]. For this purpose, we differentiate the formulated Hamiltonian function with respect to S, V, E, I, and J as follows:
Finally, by applying the optimality condition
4. Numerical Simulations
The forward-backward sweeping method is used to solve the optimal control problem. The solution’s algorithm is based on the approach suggested in [28]. System (37) is simulated forward to achieve convergence, while the Hamiltonian function is simulated backward in time.
The unit of time used for the parameter values is one year. We calculate the initial number of vaccinated children as the product of the average number of newborns and the vaccination coverage, which is V0 = 1.001 × 10⁶. In 2019, the incidence rate of MDR-TB in Ethiopia was 0.71% [27]. Hence, we take J0 = 0.0071 × I0 = 1115. In the same year, 75% of MDR-TB patients in Ethiopia were treated successfully [8]. So, we take the value of α as 0.75.
A recent estimation indicated that 3.3% of MDR-TB cases worldwide occurred among new TB cases in 2019 [29]. We take 3.3% of β to get the value of θ. Hence, θ = 5.43 × 10⁻⁵. The values of the remaining parameters and the initial values of the variables used in our simulations are presented in Tables 1 and 2.
| Symbols | Description | Units | Value | Source |
|---|---|---|---|---|
| Λ | Recruitment rate | Humans/year | 1.4 × 10⁶ | [25] |
| β | Transmission rate for DS-TB | 1/ year | 1.646 × 10⁻⁷ | [25] |
| θ | Transmission rate for MDR-TB | 1/year | 5.43 × 10⁻⁵ | Estimated |
| ϕ | Vaccination rate of newborns | 1/ year | 0.715 | [18] |
| η | Loss of protection for vaccination | 1/ year | 0.5 | [18] |
| μ | Natural mortality rate | 1/ year | 0.016 | [30] |
| k | The transfer rate from E to I | 1/ year | 0.023 | [25] |
| r | Treatment rate of I | 1/ year | 0.546 | [18] |
| ω | The recovery rate from DS-TB | Dimensionless | 0.832 | [29] |
| α | The recovery rate from MDR-TB | 1/ year | 0.75 | [8] |
| δ | Death rate due to TB | 1/ year | 0.17 | [8] |
4.1. Use of Single Control
-
Strategy A: u1, vaccination control
-
Strategy B: u2, distancing control
-
Strategy C: u3, treatment for DS-TB
-
Strategy D: u4, treatment for MDR-TB
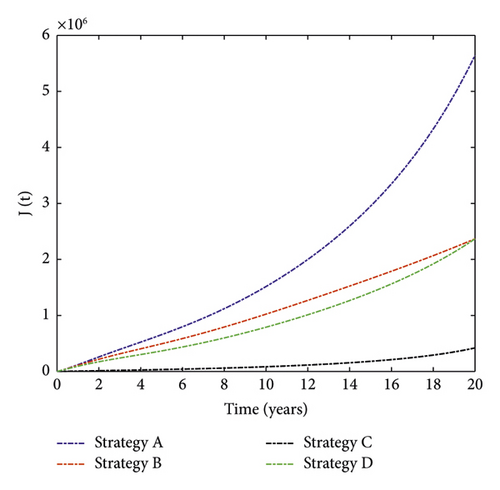
The simulation result of MDR-TB-infected individuals with different single control interventions is plotted in Figure 2. It can be observed that the number of MDR-TB-infected individuals can be significantly decreased when Strategy C (successful treatment for DS-TB) is applied. In contrast, Strategy A (only vaccination control) has the least impact on reducing the number of patients. This shows that it is beneficial to use treatment for DS-TB to prevent the disease.
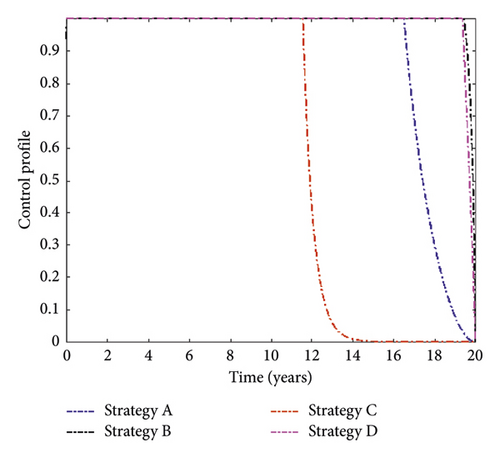
The control profiles in Figure 3 indicate that distancing and treatment for MDR-TB controls should be implemented at the maximum level until the end of the implementation. In contrast, the treatment for DS-TB and vaccination controls retained their highest bound for 13 and 18 years, respectively, and then declined until they reached their minimum value.
4.2. Use of Dual Controls
-
Strategy E: vaccination (u1) and distancing (u2)
-
Strategy F: vaccination (u1) and treatment for DS-TB (u3)
-
Strategy G: vaccination (u1) and treatment for MDR-TB (u4)
-
Strategy H: distancing (u2) and treatment for DS-TB (u3)
-
Strategy I: distancing (u2) and treatment for MDR-TB (u4)
-
Strategy J: treatment for DS-TB (u3) and treatment for MDR-TB (u4)
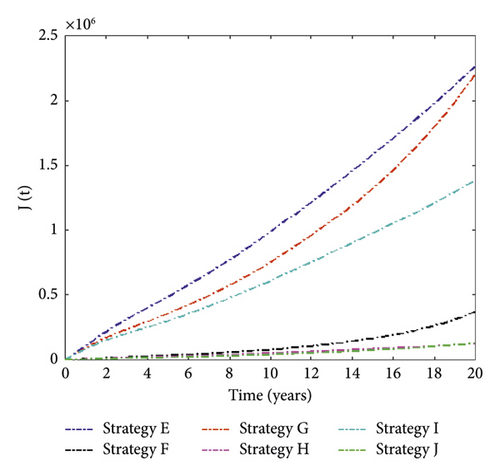
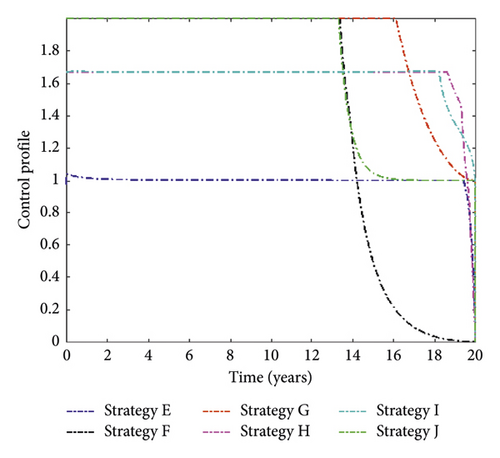
We noticed in Figure 4 that Strategy J has the highest number of MDR-TB infections averted, followed by Strategies H, F, I, G, and E. The control solution profile is shown in Figure 5.
4.3. Use of Triple Controls
-
Strategy K: vaccination, distancing, and treatment for MDR-TB
-
Strategy L: vaccination, distancing, and treatment for DS-TB
-
Strategy M: vaccination, treatment for DS-TB, and treatment for MDR-TB
-
Strategy N: distancing, treatment for DS-TB, and treatment for MDR-TB
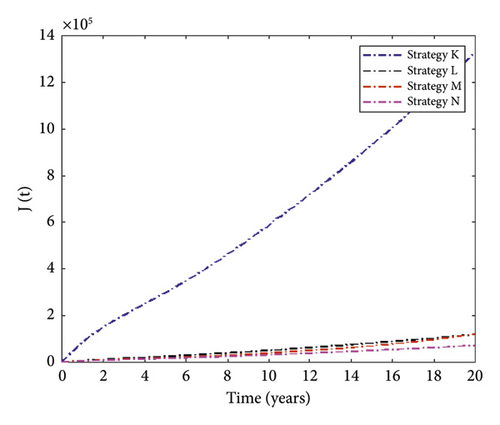
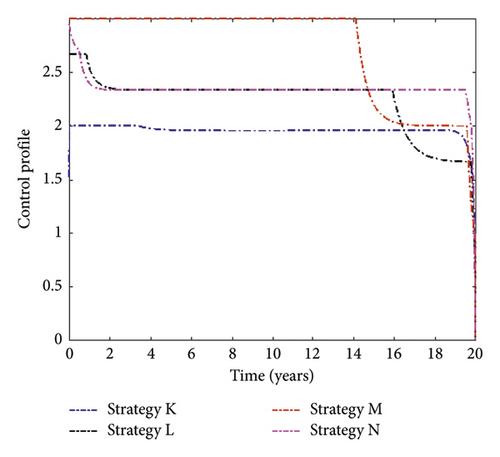
Figure 6 presents simulation results for MDR-TB-infected individuals with different triple control interventions. We can see that Strategy N (the combination of distancing, treatment for DS-TB, and treatment for MDR-TB) can significantly reduce the number of people infected with MDR-TB. In contrast, Strategy K (the combination of vaccination, distancing, and treatment for MDR-TB) has the least effect on reducing case numbers. The control function of this strategy is displayed in Figure 7.
5. Cost-Effectiveness Analysis
5.1. ICER for Single Control Strategy
| Strategy | Total infection averted | Total cost ($) |
|---|---|---|
| B(u2) | 3.85 × 10⁶ | 3.86 × 10⁶ |
| D(u4) | 3.85 × 10⁶ | 4.03 × 10⁶ |
| A(u1) | 5.7 × 10⁵ | 6.85 × 10⁵ |
| C(u3) | 5.8 × 10⁶ | 5.8 × 10⁶ |
ICER (Strategy D with respect to Strategy B) = (4.03 × 10⁶ − 3.86 × 10⁶/3.8497 × 106 − 3.8487 × 10⁶) = 174.28.
ICER (Strategy A with respect to Strategy B) = (6.85 × 10⁵ − 3.86 × 10⁶/5.723 × 105 − 3.8487 × 10⁶) = 0.97.
ICER (Strategy C with respect to Strategy A) = (5.8 × 10⁶ − 6.85 × 10⁵/5.79 × 106 − 5.723 × 10⁵) = 0.98.
Eventually, Strategy C is more cost-effective than Strategy A. Therefore, the control program that considers the application of Strategy C (successful treatment of DS-TB) will achieve a more efficient result.
5.2. ICER for the Dual Control Strategy
First, we must rank the strategies in order of increasing based on averted infection, as shown in Table 4. The incremental cost-effectiveness ratio for the dual control strategies is calculated in Table 5. From the table, we conclude that Strategy H (i.e., the combination of distancing and the successful treatment of DS-TB) is the most cost-effective of all dual control strategies.
| Strategy | Total infection averted | Total cost ($) |
|---|---|---|
| E(u1 and u2) | 3.95 × 10⁶ | 4.07 × 10⁶ |
| G(u1 and u4) | 4.01 × 10⁶ | 4.12 × 10⁶ |
| I(u2 and u4) | 4.83 × 10⁶ | 5.02 × 10⁶ |
| F(u1 and u3) | 5.84 × 10⁶ | 5.96 × 10⁶ |
| H(u2 and u3) | 6.003 × 10⁶ | 6.02 × 10⁶ |
| J(u3 and u4) | 6.086 × 10⁶ | 6.27 × 10⁶ |
| ICER | Decision |
|---|---|
| ICER(E) = (4.07 × 10⁶/3.95 × 106) = 1,03 | — |
| ICER(G, E) = 4.12 × 10⁶ − 4.07 × 10⁶/4.01 × 106 − 3.95 × 106 = 0.84 | Strategy G is less costly than strategy E. Strategy E is then ignored, and the analysis continues by comparing strategy I with G |
| ICER(G) = 4.12 × 10⁶/4.01 × 106 = 1.03 | — |
| ICER(I, G) = (5.02 × 10⁶ − 4.12 × 10⁶/4.83 × 106 − 4.01 × 10⁶) = 1.097 | Strategy I is cheaper and more effective than strategy G and hence, the analysis continues by comparing strategy I and strategy F |
| ICER(I) = (5.02 × 10⁶/4.83 × 106) = 1,04 | — |
| ICER(F, I) = (5.96 × 10⁶ − 5.02 × 10⁶/5.84 × 106 − 4.83 × 10⁶) = 0.93 | This comparison indicates that strategy F is cheaper than strategy I, and the analysis continues by comparing strategy F and strategy H |
| ICER(F) = (5.96 × 10⁶/4.83 × 106) = 1.02 | — |
| ICER(H, F) = (6.02 × 10⁶ − 5.96 × 10⁶/6.003 × 106 − 4.83 × 10⁶) = 0.35 | Strategy H is less costly and more effective than strategy F. As a result, strategy F is eliminated from subsequent ICER computations |
| ICER(H) = (6.02 × 10⁶/6.003 × 106) = 1,002 | — |
| ICER(J, H) = (6.27 × 10⁶ − 6.02 × 10⁶/6.086 × 106 − 4.83 × 10⁶) = 3.07 | Strategy H is less costly and more effective than strategy J |
5.3. ICER for the Triple Control Strategy
| Strategy | Total infection averted | Total cost ($) |
|---|---|---|
| K(u1, u2, u4) | 4.89 × 10⁷ | 5.19 × 10⁶ |
| M(u1, u3, u4) | 6.09 × 10⁷ | 6.37 × 10⁶ |
| L(u1, u2, u3) | 6.098 × 10⁷ | 6.22 × 10⁶ |
| N(u2, u3, u4) | 6.14 × 10⁶ | 6.34 × 10⁶ |
This indicates that Strategy L is cheaper and more effective than Strategy N.
Finally, the comparison result reveals that Strategy L is cheaper and more effective than Strategy N. Therefore, Strategy L (combination of vaccination, distancing, and successful treatment of DS-TB) is the best of all triple control strategies.
6. Conclusions
In this study, we presented a compartmental model to understand the transmission dynamics of MDR-TB in Ethiopia. We first established that model (1) is well posed epidemiologically and mathematically. Then, we have described the conditions for the stability of the equilibrium points.
We applied preventive controls in the form of vaccination, distancing, and two treatment controls for DS-TB and MDR-TB. Theoretically, we proved the existence of optimal control and studied the characterization of optimal control by Pontryagin’s maximum principle. In addition, the incremental cost-effectiveness ratio of single, coupled, and triple combinations of control strategies was investigated to determine the most effective method to control the spread of MDR-TB in Ethiopia.
Among the four single controls, it is found that the successful treatment of DS-TB is the most effective strategy in curtailing the spread of MDR-TB. Therefore, the Ethiopian government should improve DS-TB therapy by reducing treatment failures in DS-TB patients if only one control strategy is used.
Within the six dual control strategies, a combination of distancing and successful treatment of DS-TB is the most cost-effective strategy compared to others. Therefore, if dual control strategies are considered, we recommend the Ethiopian government focus on isolation policy, educational campaigns, and monitoring DS-TB patients to complete their treatment correctly. Considering the combination of the triple control strategy, the combination of successful treatment of DS-TB with distancing and vaccination control is the most cost-effective strategy.
This study is unique from other studies because the model was fitted to Ethiopian data and suggested effective methods to eradicate MDR-TB from the country. On the other hand, the study will yield better results if we include more control strategies. For example, directly observed therapy (DOT) is a strategy that helps DS-TB patients complete their treatment effectively. Therefore, our future research will focus on incorporating this strategy.
Conflicts of Interest
The authors declare that they have no conflicts of interest.
Open Research
Data Availability
The data used to support the study′s findings are included in the article.


