TTA-GEP: Terrain Traversability Analysis with Geometry and Environmental Perception for the Path Planning of Planetary Rovers
Abstract
Terrain traversability analysis (TTA), the key to the navigation of planetary rovers, is significant to the safety of the rover. Therefore, owing to its complexity, the Martian terrain is worth analysing comprehensively based on the terrain variability and hazard level. In this work, we propose a novel method for terrain traversability analysis for the path planning of planetary rovers by integrating Martian terrain geometry features with terrain semantic information, which includes geometry and environmental perception (GEP). Specifically, we deploy semantic segmentation to classify common terrain types, such as rocks, bedrocks, and sand, obtaining semantic information as one part of terrain traversability analysis at the same time. Simultaneously, the point cloud is generated by using binocular images from the planetary rover navigation camera (Navcam) to construct a 2.5D elevation map of the environment to analyse the geometric characteristics of the terrain. Besides, we implement path planning based on the results of TTA-GEP. Overall, our proposed method improves the performance of the terrain traversability analysis and reduces the risk of planetary rovers while detecting in an unstructured environment.
1. Introduction
Extraterrestrial planet exploration is an important research direction in the field of aerospace, and patrol detection is one of the important forms of exploration [1]. In particular, when planetary rovers conduct exploration on the surface of Mars, the extraterrestrial navigation of autonomous robots faces severe challenges due to the great unknown, complexity, and uncertainty of the unstructured Martian surface [2]. On the one hand, the terrain on the Martian surface is more complicated and unstructured. On the other hand, due to the limitations of technology and distance, we cannot obtain all the information of the extraterrestrial environment. Hence, hazardous and unstructured environments may pose threats to planetary rover operations. Especially, sandy terrain can cause the rover to sink into it and make it impossible to continue driving. For example, Courage was so deep in it because of the sand that NASA had to abandon the exploration mission. Furthermore, steep area can cause the rover to roll over. Meanwhile, Curiosity’s wheels were damaged by wear and tear due to the impact of rocks [3]. Therefore, to guarantee the safety and extend the service life of the planetary rover, the rover must bypass hazardous areas during its travel, meaning that it will not have any collision with obstacles. Thus, it is essential to enhance the ability of the planetary rover to perceive and analyse its environment. Since the geometric analysis of the terrain cannot determine the type of terrain, the planetary rover is unable to avoid risky terrain types, leaving the rover in danger. Therefore, our proposed method, integrating terrain geometry features with terrain semantic information, can ensure the rover’s own safety and reduce the dependence on human commands by assessing the terrain around the rover autonomously.
In general, terrain traversability is employed to measure the difficulty of crossing a particular area and can indicate the geometric characteristics of the terrain like slope, roughness, and height difference, which lays the foundation for proper path planning in sophisticated environments; these geometric metrics are related to the optimality of the paths as well [4]. Several studies have proposed geometric methods to estimate terrain traversability. For instance, Tanaka et al. [5] analyse terrain traversability based on fuzzy logic and use a fuzzy inference module to convert traversability values into risk values, avoiding uncertainty in sensor data and generating travelable directions for mobile robots. Some researchers [6, 7] apply stereo vision to the visual odometer and navigation system of the Mars Exploration Rovers (MERs), using stereo vision to perceive the geometric aspects of the environment. In another work, Meng et al. [8] generate elevation grid maps using point cloud data acquired by LiDAR, combining RANSAC and least squares methods to estimate the geometric features of the terrain. Some algorithms [9, 10] similarly construct a 2.5D elevation map using the data from a radar-acquired point cloud and an odometer, which is subsequently used to derive traversability by evaluating roughness, slope, and step height. In addition, mobility is important in path planning. To satisfy the field mobility of the lunar rover, two metrics of terrain, terrain slope and terrain roughness, were considered by Ishigami [4]. However, in some cases, the sandy terrain and the flat terrain are similar in height. Thus, the planetary rover can easily cross the flat terrain while it is unable to cross the sandy terrain. Apparently, the geometric approach ignores the semantic information of its environment and does not incorporate semantic information in traversability analysis. The pure geometric analysis ignores this important information. Consequently, it cannot meet the actual mission requirements very well.
Meanwhile, some studies have acquired scene data from sensors [11, 12] for semantic segmentation [13, 14] to obtain semantic maps [15]. For example, Hosseinpoor et al. [16] use aerial RGB images to segment images by different threshold values of height. However, it is not sufficient to analyse traversability by semantic information alone. For instance, areas with relatively low altitude but uneven terrain can equally pose difficulties to the traversability of rovers.
Hence, in this paper, to analyse the terrain traversability of Mars’ unstructured terrain, we propose a novel fusion method called TTA-GEP, in which we integrate terrain geometric features with terrain semantic information, for planetary rover path planning. Firstly, we build 2.5D elevation maps by stereo vision, which are used to evaluate the geometric features of the terrain. Secondly, a terrain classifier is used to enhance the terrain traversability analysis via terrain types. Specifically, the semantic information not only helps the planetary rover to identify the terrain type of the scene but also improves the ability to perceive risks to guarantee the safety of the mission. Finally, we use TTA-GEP for path planning. As shown in Figure 1, we use the Navcam images and camera matrix as the input of our framework. The Navcam images are sent to the terrain classifier for semantic segmentation which is used to obtain the terrain types and generate the semantic map for the terrain traversability analysis. The point cloud of the place where the planetary rover is located is generated by Navcam images and camera matrix, which is projected into a 2.5D elevation map. Then, we analyse the terrain traversability by integrating geometry analysis based on the 2.5D elevation map with semantic information by terrain classifier. Finally, we use the result of the traversability analysis to plan the path for planetary rovers.

- (1)
A terrain classifier of the Martian terrain is realized to identify the Martian terrain types and generate a semantic map of Mars as well
- (2)
A method called TTA-GEP to estimate traversability by integrating terrain semantic information with terrain geometric features, including terrain types and the geometric information acquired from elevation data such as slope, elevation difference, and roughness into the evaluation function is proposed
- (3)
We use TTA-GEP for rovers’ path planning, and experiments indicate that the proposed method improves the ability to perceive the environment and reduces risks for the rovers
The remainder of this paper is organized as follows. In Section 2, we describe related work. Section 3 introduces our proposed TTA-GEP method. The simulation results are reported in Section 4, followed by conclusions at last.
2. Related Work
2.1. Terrain Classification
For the planetary rover, the unknown and unstructured environment makes its task quite challenging. Besides, most of the Martian surface is covered by loose soil; hence, planetary rovers driving on this ground are prone to slippage, which affects operational safety [17]. Furthermore, the planetary rover can perceive the environment while driving. As a result, classification based on terrain characteristics can further improve its ability to analyse its own traversability and consequently, avoid the traversable risks arising from the terrain promptly. Therefore, terrain classification plays an essential role in improving the safety and operational efficiency of planetary rovers. For example, Liu et al. [18] proposed a hybrid attention semantic segmentation (HASS) network, which aggregates both local interclass and global intraclass contextual information, comparing the terrain consistency of the same class and considering the relationship between neighbouring terrains simultaneously, to further improve the accuracy of segmented classes. In another study, Rothrock et al. [19] proposed soil property and object classification (SPOC), which can classify planetary orbital images and planetary surface images, respectively. The approach is successfully applied in the traversability estimation for the rover and Mars Science Laboratory (MSL) sliding prediction missions. Additionally, Goh et al. [20] proposed a semisupervised learning framework to improve the robustness of image segmentation. Meanwhile, Swan et al. [21] created a large-scale terrain classification dataset called Al4Mars for Mars. Brooks and Iagnemma [22] classified terrain through vibrations caused by the interaction between the wheels of the planetary rover and soil. This technique avoids the instability of classification generated by changes in light intensity in vision-based classification methods. Further, Manduchi et al. [23] classified terrain and detected obstacles based on the inherent characteristics of different terrain types using a stereo camera and a single-line radar. Finally, Halatci et al. [24] integrated vision classification methods with sensor classification to improve classification accuracy.
2.2. Path Planning
Planetary rovers are capable of traversing the planetary surface autonomously and rapidly, avoiding obstacles effectively, and conducting exploration missions, which is important to maximize their scientific value. In recent years, with the development of semantic segmentation, there exist an increasing number of techniques that combine terrain classification with path planning. For example, Egan and Göktogan [25] proposed a traversability estimation algorithm for path planning and control (TEAPAC) by integrating obstacle-aware information and terrain classification results. In another study, Ebadi et al. [26] used the DeepLabv3+ framework to segment the skyline in Mars images to automatically estimate the planetary rover’s global position. Besides, autonomous robots need to perform inspection tasks in a nuclear storage environment. Hence, Wang et al. [27] proposed to convert the obstacles distribution into a two-dimensional binary map that includes the location and orientation of the target points, which constructs maps that may be used for path planning on the purpose of check. Additionally, in [28], semantic information is considered during path planning. More specifically, the semantic information is integrated into the navigation task to construct cost maps using semantic information. Meanwhile, Chiodini et al. [29] proposed a technique to generate the 3D semantic map of the Martian environment for trajectory planning and target identification by using the stereo images acquired by the planetary rover as input. In addition, Sadat et al. [30] proposed a neural network architecture, which uses voxelized radar data and a priori mapping scheme, to provide a probabilistic semantic occupancy layer containing the current and predicted positions of obstacles and vehicles for autonomous vehicles in urban environments. Subsequently, the model selects vehicle trajectories from a set of motion primitives by optimizing a cost function that includes safety-related penalty terms computed via predicted semantic segmentation, driving comfort, and other terms related to traffic rules independent of semantic information. The two-dimensional semantic grid in [31] is also used for traversability estimation to reach the target location specified by the human operator in the rescue mission through the D ∗ path planning algorithm.
3. Technical Approach
In this section, our proposed method is described by modules. In Section 3.1, the method to generate the 2.5D elevation map from the point cloud is presented. In Section 3.2, we present the method to classify the terrain by using deep learning. Terrain traversability analysis is introduced in Section 3.3 while path planning is in Section 3.4.
3.1. Environment Representation
When constructing the configuration space of a robot using grid maps, the conventional approach divides the entire map into the obstacle and obstacle-free areas. To be more specific, for one grid there are two states, including both the obstacle and obstacle-free [32]. Thus, if there is an obstacle in the grid, this grid is marked as an impassable area; conversely, the grid is marked as an obstacle-free area that is passable. However, the planetary surface terrain is complex with significant unstructured features, and the above map representation obviously cannot sufficiently reflect the planetary surface environment to meet the requirements of planetary rover operation in the Mars scenario. To fully represent the terrain features of the planetary surface, we adopt a 2.5D grid map for the map representation of the Martian surface.
3.2. Terrain Classifier
The semantic segmentation of the terrain is one of the important parts of the whole framework by semantic segmentation. Specifically, through the classifier, each pixel gets a label with a predefined terrain class when inputting a Navcam image. It means that the planetary rover can classify the terrain and achieve a more comprehensive understanding of the terrain where the rover is located, such as sand, rocks, and soil. For planetary rovers, mountains, rocks, and sand are obstacles; sand is geologically soft and can cause wheels to sink, which threatens the safety of planetary rovers, all of which are impassable. In this work, three different deep neural network architectures, HRNet [36], SegFormer [37], and DeepLabv3+ [38], were tested and compared. HRNet maintains high-resolution information of images while reducing the loss of details. Deeplabv3+, including hole convolution with multiple hole rates, increases the receptive field and improves the ability to extract semantic features. Segformer, introducing the architecture of transformers [39, 40], has a global receptive field, which is more robust but more difficult to train. We selected HRNet, and the results of our experiments in Section 4.1 show that it achieves better performance. In addition, the dataset is S5Mars [41], which has 6000-labeled images containing nine labels of soil, bedrock, rock, rover, sky, ridge, trace, sand, and hole. The detailed descriptions of these nine classes are given in Table 1.
| Class | Description |
|---|---|
| Soil | Martian soil, flat and yellow-black in color. |
| Bedrock | Stones that are relatively flat and not exposed to the ground. |
| Rock | Stones that are large in size and completely exposed to the ground. |
| Rover | The body of the planetary rover. |
| Sky | Martian sky. |
| Ridge | Mountains in Mars. |
| Trace | Wheel trajectory. |
| Sand | Sandy region. |
| Hole | Traces left by the planetary rover during sampling. |
The label of each point Pi(x, y, z) of the point cloud is generated from the pixel (u, v) of the Navcam images. More so, the scale of the elevation map and the point cloud is not the same. When projecting the point cloud, each grid will contain several points Pi, which correspond to different labels Li, and each grid only has one height value and one label; thus, it is necessary to match the point cloud data and labels in one grid. Furthermore, we divide it into the following three cases. First, if there is only one point in the grid, the height of the grid is the height of this point, and the grid label is the label of this point. Second, if there are two points in the grid, the height of the grid is taken as the height of the higher point, and the grid label is the label of the corresponding point. Third, if there are more than two points in the grid, the height of each grid is sorted, and the middle height is taken as the height of the grid; and the grid label is the label of the corresponding point. Currently, the above-proposed strategy can meet our requirements. However, how to handle the grid data more reasonably and match the labels of each grid needs our further research.
3.3. Terrain Traversability Analysis
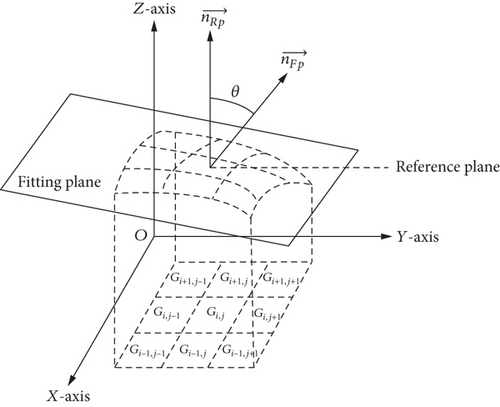
Terrain traversability analysis is an indispensable part for the path planning of planetary rovers. To analyse terrain traversability, we can obtain three terrain features [42] from the elevation data, which includes slope [43], roughness, and elevation difference. However, when analysing digital elevation maps, topographic features cannot be precisely reflected if only one grid is considered at a time. Therefore, we utilize the window method to analyse a grid as the center and analyse the grid in the window area of this grid as a whole to reduce the error and improve the accuracy. First, we need to fit the window area to the plane shown in Figure 2.
Before analysing terrain traversability, we set thresholds for slope, roughness, and elevation difference, respectively. If any geometric feature of any grid exceeds the corresponding threshold, it will be marked as impassable.
If either of the two equations above is satisfied, the current grid is impassable and the maximum cost is assigned to this grid.
Furthermore, the hazard level of different terrain types for planetary rover operation determines the different terrain costs of each grid. Particularly, soil offers the least resistance to the wheels; thus, it is the most desirable and the least risky terrain for planetary rovers. Specifically, a bedrock, which is not exposed to the ground, will cause wear and tear on the wheels. In addition, rocks, ridges, and sand are not considered as traversable regions, giving them the highest cost. Thus, these areas should be avoided when running. Additionally, different terrain types mean different terrain costs, and the cost is assigned to each type according to our requirements; hence, the terrain semantic cost Stc of each grid is matched with the label of each grid.
3.4. TTA-GEP for Path Planning
4. Experiments
4.1. Terrain Classification
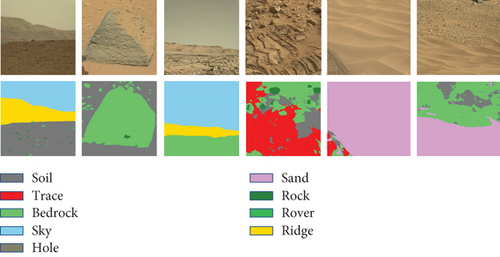
Table 2 displays the test results of the three network architectures on S5Mars. Compared with other classes, the three networks perform better on soil, bedrock, sky, ridge, and sand, which have a better predictive accuracy. The reason for this is that these terrain types have distinct features, and the textures are easy to distinguish. For the prediction of soil, rover, sky, ridge, and sand, HRNet performs better than the other two networks. Besides, in terms of mIoU, the overall performance of HRNet is significantly better than the other two networks. Due to the complexity of the transformer architecture, training Segformer can be more challenging than the other two segmentation models. As shown in Figure 4, the first line shows the source images while the images predicted by HRNet are on the second line. Furthermore, the IoU of rock is low, because there are more samples of bedrock and fewer samples of rock in the dataset. Meanwhile, the IoU of hole is 0, which is caused by the obvious lack of samples as well.
| Network | SegFormer | DeepLabv3+ | HRNet |
|---|---|---|---|
| Soil | 63.91 | 79.29 | 81.47 |
| Bedrock | 85.2 | 91.08 | 90.97 |
| Rock | 2.41 | 19.28 | 14.84 |
| Rover | 40.5 | 79.37 | 86.51 |
| Sky | 78.57 | 89.38 | 90.53 |
| Ridge | 73.93 | 88.78 | 89.95 |
| Trace | 6.7 | 75.72 | 75.71 |
| Sand | 66.73 | 71.39 | 74.2 |
| Hole | 0 | 0 | 0 |
| mIoU | 46.44 | 66.03 | 67.13 |
4.2. Environmental Construction
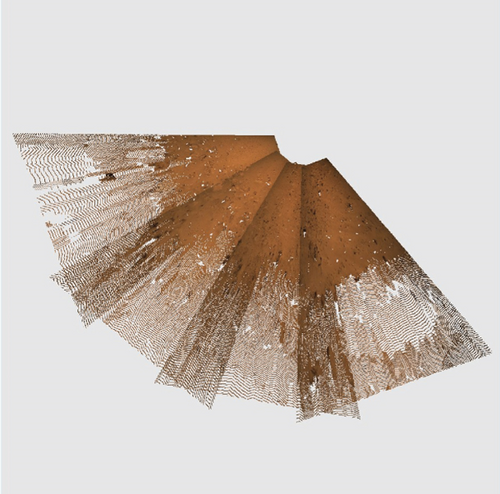
Based on the method of environment construction mentioned above, we input the camera matrix and binocular images acquired by the Navcam to construct a 2.5D elevation map with the point cloud generated by stereo matching. The size of each grid map is 2000 × 2000 and the resolution of each grid is 0.02 × 0.02 m2. In addition, we visualize the map by OpenGL [46], and the top view of the 2.5D elevation map is shown in Figure 5(a). Specifically, the methods we adopt clearly reflect the information regarding the Martian surface terrain and contribute to subsequent traversability analysis and path planning. Figure 5(b) shows the semantic map, which integrates the labels with the 2.5D elevation map. The green area is the region of bedrock; and the fusion of terrain labels and elevation maps can help us further identify terrain types and what the environment is like while the rover is running.

4.3. TTA-GEP and Path Planning
We validate the effectiveness of our proposed method in the environment constructed in Section 4.2. In this experiment, parameters needed are recorded in Table 3. More specifically, the cost of traversability is displayed in [0, 1] with different colors as shown in Figure 6, where the value of the red area is one, which represents completely impassable. The remaining areas are passable and the boundaries are indicated by yellow and green.
| Parameter | Value |
|---|---|
| L (cm) | 150 |
| Rmr (m) | 5 |
| Ps, Ph, Pts , and Pr | 0.5, 0.25, 0.15, and 0.1 |
| spitch and sroll (deg) | 15, 15 |
| Threshold of height (cm), slope (deg), and roughness (cm) | 15, 10, 3 |
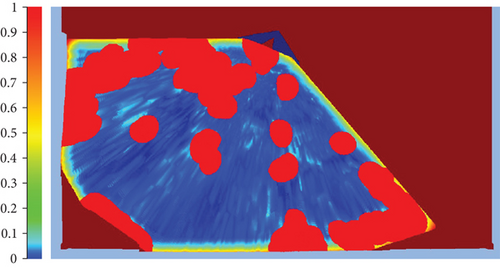
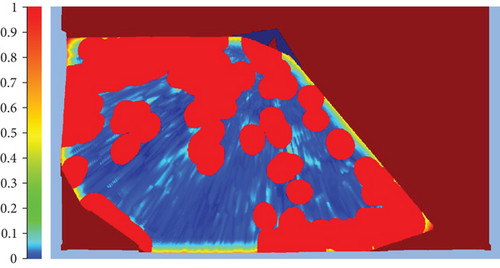
In Figures 6(a) and 6(b), the results of the terrain traversability analysis are obviously different under the same configuration of parameters. Particularly, the red area in Figure 6(b) is obviously larger than that in Figure 6(a). Combining the results of Figure 5(b) semantic and elevation map fusion, the concentrated green bedrock region near the rover is reflected in the corresponding position in Figure 6(b). It means that our method has the ability to complement the performance of terrain traversability analysis. But for some of the green areas of bedrock, which are small and far away from the planetary rover, they are not fully represented in Figure 6(b), because the point cloud generated is affected by the accuracy of stereo matching and lack of data caused by sparse of point clouds. However, the impact of this problem may be solved by improving the accuracy of the stereo matching or updating the map in time after the planetary rover travels a certain distance. Overall, the better performance of our proposed method improves the ability to perceive the environmental risks and reduce possible risks.
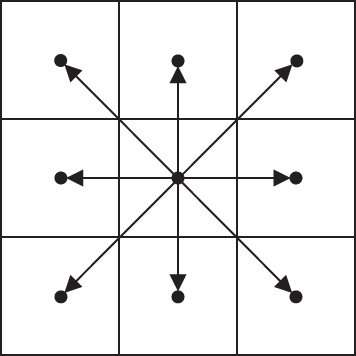
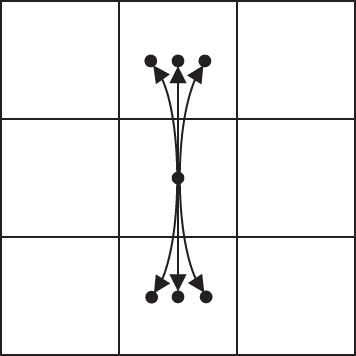
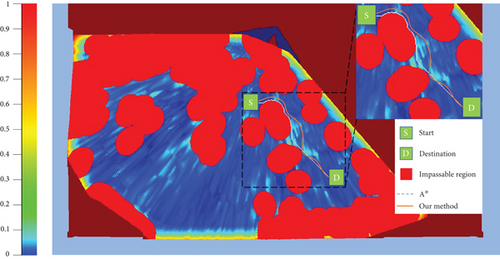
What is shown in Figure 7 is the results of classical A ∗ algorithm and our proposed method for path planning with the setting in Figure 6(b), where S represents the starting point and D represents the end. In Figure 7, we can see that classical A ∗ algorithm only considers the cost of distance and has no kinematic constraints. Thus, the planned path is shorter and takes the form of straight lines. Our proposed method meets kinematic constraints and considers not only the geometric features of the terrain but also the influence of different terrain types. Table 4 shows the expected time of execution of planning and the length of paths for both methods at the same starting and ending points. Compared to classical A ∗, our method has a 4.32% decrease in planning time and a 12.2% increase in the length of the path. However, the increase in the length of the path makes the operation of the planetary rover safer, which is worthwhile. Thus, TTA-GEP is a conservatively analytical method to analyse terrain traversability. In addition, it can improve the safety of the path and extend the service life of rovers.
| Method | Time (s) | Length of path (m) |
|---|---|---|
| A ∗ algorithm | 364.21 | 12.13 |
| Our method | 348.47 | 13.61 |
| Change (%) | -4.32 | +12.20 |
5. Conclusion
In this paper, we propose a novel method called TTA-GEP to analyse terrain traversability by integrating terrain geometry with terrain semantic information. The terrain classifier is built on HRNet, and the model is trained by using a dataset called S5Mars containing nine labels of soil, bedrock, rock, rover, sky, ridge, trace, sand, and hole. When inputting a Navcam image, the classifier gives each pixel of the image a terrain type which has an impact on the terrain traversability analysis. This method enables autonomous terrain classification to identify hazardous terrains and integrate terrain semantic information and terrain geometric features to analyse terrain traversability, compensating for the shortcomings of analysing traversability relying only on geometric analysis or terrain semantic analysis. Furthermore, we plan paths based on TTA-GEP by using a variant of hybrid A ∗. Since the real environment is more complicated, the validation process simplifies the analysis by imposing constraints. Overall, we achieved the expected results in the experiments. A series of experiments indicate that TTA-GEP is an effective method for terrain traversability analysis in unstructured Martian surface, which improves the safety not only for the path but also for rovers. In future work, our method may be combined with spacecraft attitude controllers [47] to further enhance the safety of spacecrafts. However, in more complex environments, our approach may face more challenges; and thus, we need to continuously improve the validity and robustness of our approach in our future work.
Conflicts of Interest
The authors declare that there is no conflict of interest regarding the publication of this paper.
Acknowledgments
This work is supported by the Key Laboratory of Space Flight Dynamics Technology (KJW6142210210309) and the Key Research and Development Projects in Zhejiang Province (2022C01204).
Open Research
Data Availability
The data supporting this are from previously reported studies and datasets, which have been cited.


