Parameter Identification of Frame Structures by considering Shear Deformation
Abstract
This paper presents a method to identify the damages in frame structures with slender beams. This method adjusts the parameters of the structure to match the analytical and the measured displacements. The effect of transverse shear deformation on the nodal analytical displacement is analyzed, and the parameter identification of frame structures with slender beams is performed. The results demonstrate that parameter-identification accuracy can be considerably improved by considering the transverse shear deformation in the frame structure with slender beams. The proposed method can accurately identify the damages in frame structures with slender beams using displacement measurements.
1. Introduction
Frame structures are widely used in civil engineering applications, such as constructions and industrial buildings. However, they are susceptible to damage due to aging, load, and environmental influences, such as corrosion [1–3]. One or more components of the frame structure may be damaged, resulting in changes in the physical properties of the structure, mainly at the damaged location. The “as-is” conditions of these structures are different from the original design. To assess the “as-is” condition of the structure and conduct the safety evaluation, it is necessary to identify parameters of the structure model [4–6]. Although many identification methods are effective in analog measurement, some of them are prone to error, such as modeling error, when used in real situations. Even the slightest error affects the parameter identification of the structure model.
Parameter identification is achieved by adjusting the parameters of the structure to match the analytical and the measured data [7]. The methods of parameter identification can be categorized as static and dynamic parameter-identification methods [8–14]. Sanayei and Onipede [15] proposed a method to identify the structural parameters of the truss and frame structural elements using applied static forces and measured displacements. Banan et al. [16] studied the method of identifying the structural parameters using static displacements. Ghrib et al. [17] presented a method for damage identification of Euler–Bernoulli beams using static-deflection measurements. Bonessio et al. [18] presented a multimode approach for multidirectional damage identification in frame structures; the method reduces damage identification errors by analyzing the multidirectional effects of damages. Vaez and Fallah [19] identified the site and extent of multiple damage cases of frame structure using a two-stage damage-identification approach. Zhang and Johnsonb [20] proposed a novel substructure-identification method to identify the damage of multistory multibay plane frame structures and revealed how structural responses affect the identification accuracy using identification-error analysis. In these studies, various aspects of parameter identification of frame structures, including the optimal placement of sensors, improvements in measurement technique, and error analysis, have been studied.
The classical Euler–Bernoulli beam theory is usually used to analyze the behavior of structural elements because it can properly simulate the behavior of slender beams [21–24]. For slender beams, various studies have suggested that using Timoshenko beam theory can improve the accuracy of structural analysis. Dixit [25] used the natural frequency and mode shape generated by the analysis frame to compare the effects of Euler–Bernoulli beam theory and the beam theory considering shear deformation on structural parameters. Even though the Euler–Bernoulli beam theory is basically accurate in estimating the frequency of slender beam, the results obtained by Timoshenko beam theory have almost no errors. Silva et al. [26] considered the shear deformation and performed an inelastic second-order analysis on steel Vogel portal frames with slender beams. According to the results of this study, compared with the analysis of the Euler–Bernoulli beam theory, the numerical results of the frame considering the shear deformation have larger displacements and provide better structural response. Su and Ma [27] used ray and normal mode methods to study the dynamic transient responses of a simply supported Timoshenko beam subjected to an impact force. Although the error in the resonant frequency obtained by the Euler–Bernoulli beam theory has been reduced, all the resonant frequencies obtained from the Timoshenko beam theory are very consistent with those of the ABAQUS 3-D model. The study suggests that Timoshenko beam theory is suitable for evaluating the resonant frequency of a slender simply supported beam. Assuming that the measured data is accurate, the difference between measured and analytical data can be used to effectively identify the damage of the structure. Therefore, errors in analytical model may affect the accuracy of damage identification [28, 29]. However, a limited number of studies discuss the influence of transverse shear deformation on the parameter identification of frame structures with slender beams.
In this study, steel-frame structures with slender beams were identified based on the static parameter-identification method, and to include the shear effect, Timoshenko beam theory is considered and compared with the Euler–Bernoulli beam theory. The effect of shear deformation on the nodal analytical displacement of wide flange cross-section and rectangular cross-section frames is analyzed. Damage considered in the present study is mainly due to corrosion and would result in reduced cross-sectional areas. The damage identification is performed by minimizing the measured and analytical displacements, and the optimization method used is the interior-point method. Furthermore, the influence of transverse shear deformation on the parameter-identification accuracy of the frames with different cross-sectional slender beams is discussed.
2. Formulation for Parameter Identification
In this parameter-identification method, the objective function is defined in terms of the difference between the analytical and measured displacements. The analytical displacements can be obtained using the stiffness method [30, 31]. The damage conditions of the members of the structure can be determined on the basis of the applied static forces and the measurements of the nodal displacements of the structure.
3. Member Stiffness Matrix of Frame Structure
Changes in the atmospheric environment lead to structural corrosion, causing a reduction in the thickness of components [35]. The subject of this study is the wide flange cross-section and rectangular cross-section. In this study, the frame structure’s “as-is” condition is different from its “as-built” condition owing to the corrosion. Assuming that the depth of corrosion is d, which is unknown and needs to be determined, it represents parameter p in equation (6).
4. Effect of Shear Deformation on Nodal Displacement
Considering the shear deformation can improve the accuracy of the analytical displacement Da of equation (4). A large error in the analytical displacement causes the objective function of equation (5) to fail to converge during the optimization. To study the effect of shear deformation on the nodal displacements of steel-frame structures, frame structures with different cross-sectional dimensions were studied by considering shear deformation. The results were compared with the nodal displacements of the structure neglecting the shear deformation.
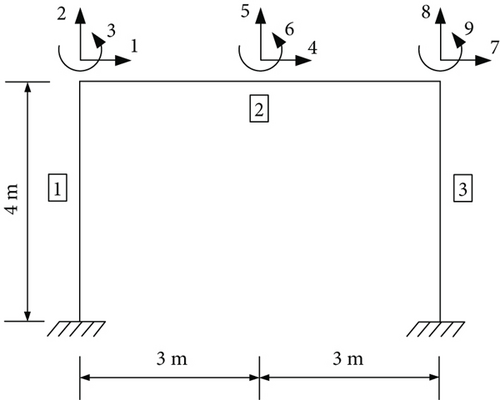
A one-story, one-bay steel-frame structure (Figure 1) with slender beams (depth-to-span ratio < 1/15) was analyzed. The frame members are wide flange cross-sections, and all members have the same cross-section. Three different dimensions are studied, and the dimensions are presented in Table 1. The modulus of elasticity is 206 GPa, and the shear modulus of the material is 79.23077 GPa. Forces of 10 kN and -10 kN were applied along degrees of freedom 4 and 5, respectively, to excite the frame structure, and displacements were determined along degrees of freedom 1–9.
| Shape | h (mm) | b (mm) | t1 (mm) | t2 (mm) |
|---|---|---|---|---|
| A | 150 | 100 | 5 | 4 |
| B | 200 | 100 | 5 | 4 |
| C | 250 | 100 | 5 | 4 |
Therefore, the sensitivity of the wide flange cross-section to the shear deformation can be analyzed by comparing the nodal displacement errors caused by shear deformation.
First, nodal displacements based on the Euler–Bernoulli beam theory were obtained. The member stiffness matrixk′based on the Euler–Bernoulli beam theory was obtained from equation (7) on settingαin equation (9) as 0. The nodal displacement can also be obtained by equation (4). Subsequently, nodal displacements were recalculated based on the Timoshenko beam theory. The member stiffness matrix k′ of the frame member is obtained from equation (7); the nodal displacement can also be obtained by equation (4). Finally, nodal displacements were obtained from the finite element model. The absolute value of the relative error in the nodal displacements can be calculated based on the nodal displacements calculated using the Timoshenko beam theory, the Euler–Bernoulli beam theory, and the finite element method.
Figure 2 shows the nodal displacement errors from the Euler–Bernoulli beam theory and the Timoshenko beam theory, the grey bar represents the absolute value of the relative error between the Euler–Bernoulli beam theory and finite element model’s calculation, and the blue bar represents the error between the Timoshenko beam theory and finite element model’s calculation. Figures 2(a)–2(c) correspond to the errors for shapes A, B, and C, respectively.
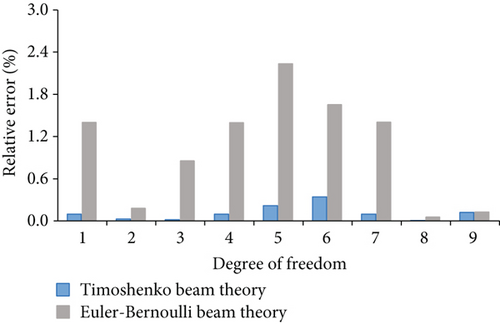
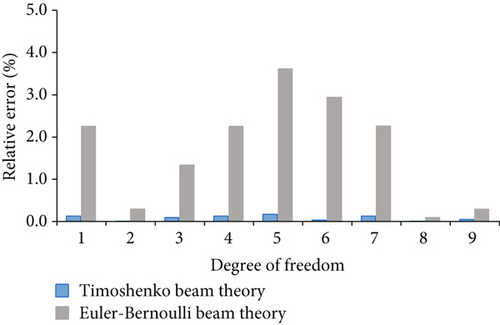
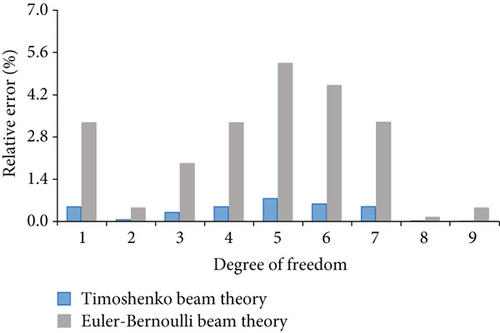
In Figure 2, the horizontal axis represents the degree of freedom, and the vertical axis represents the error. It can be seen from Figure 2 that the error of the nodal displacement for all the wide flange frames considering the shear deformation is less than 1%. The maximum errors between the nodal displacements calculated using the Euler–Bernoulli beam theory and finite element method are 2.23%, 3.62%, and 5.24% for shapes A, B, and C, respectively. According to Figure 2, the calculations of both the Euler–Bernoulli beam theory and the Timoshenko beam theory are close to the finite element model’s calculation. However, the results from the Timoshenko beam theory can provide more accurate results by considering the shear deformation.
5. Parameter Identification by considering Shear Deformation
To demonstrate the effect of the transverse shear deformation on the parameter-identification method of the frame using static displacements, the one-story frame structure with wide flange cross-section described in Figure 1 is analyzed. For the “as-built” condition, the cross-sections of all the members are assumed to be shape C (Table 1). Assuming that corrosions exist in members 1–3, the depths of corrosion for members 1–3 are 0.25, 0.5, and 0.75 mm, respectively. The “as-is” depths of corrosion of the members 1–3 need to be determined. To excite the structure, forces of 10 kN and -10 kN were applied along the degrees of freedom 4 and 5, respectively. The measured displacements are along the degrees of freedom 1, 4, 5, and 7.
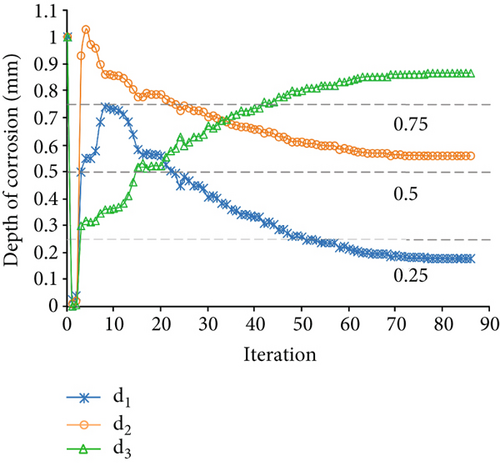
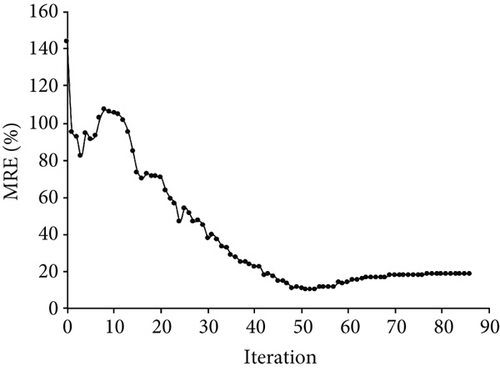
Figure 3(a) displays the changes in d1, d2, and d3 during the optimization process. The dashed lines in the figure represent the “as-is” depth of correction of members 1, 2, and 3. According to Figure 3(a), the final optimal values of d1, d2, and d3 were identified, and the results were found to be inconsistent with the “as-is” condition. The variation of MRE during the optimization process is shown in Figure 3(b). The error in the final optimal values based on the Euler–Bernoulli beam theory is 18.36%.
Next, the structural parameters were identified based on the Timoshenko beam theory. The member stiffness matrix k′ of the frame member was obtained from equation (7); equation (5) expresses the objective function to identify the corrosion condition. The start point of depth of corrosion d was equal to 1. The constraints on d were set between 0 and 2 according to the “as-built” condition. The interior-point method was also used to solve the optimization problem. Figure 4(a) displays the changes in d1, d2, and d3 during the optimization process. After 97 iterations, the final optimal values of d1, d2, and d3 were identified, and the results were found to be consistent with the “as-is” condition. The variation of MRE during the optimization process is shown in Figure 4(b), and the final MRE value is 1.67%.
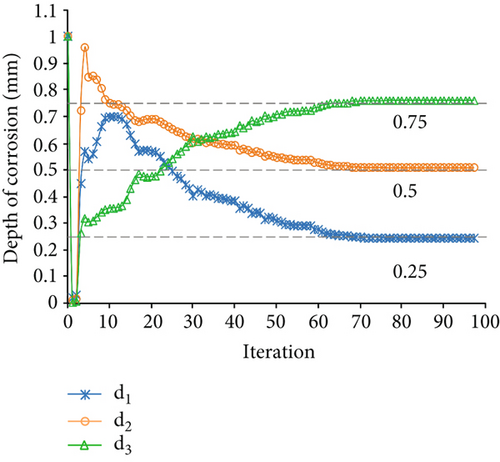
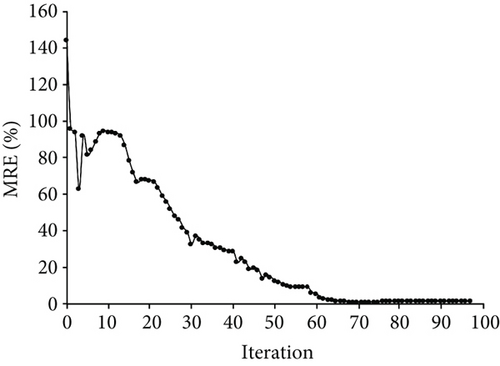
Compared to the Euler–Bernoulli beam theory-based method, the final optimal values determined by using the Timoshenko beam theory-based parameter-identification method can improve the accuracy of MRE by 16.69%.
6. Parameter Identification for Frame Structures with Different Wide Flange Cross-Section
The effect of shear deformation on the accuracy of parameter identification has been presented in Section 5. A two-story, one-bay steel-frame structure with slender beams is shown in Figure 5. This structure is used to demonstrate the effect of the transverse shear deformation on the frame-structure parameter identification with different wide flange cross-sections. All the members have the same cross-section. The frame “as-built” condition has three different cases. In cases 1, 2, and 3, the cross-sections of the members are shapes A, B, and C, respectively. The cross-sectional dimensions of shapes A, B, and C are listed in Table 1. Assuming that corrosions exist in members 1, 2, and 4, the depths of corrosion for members 1, 2, and 4 are 0.7, 1, and 1.2 mm, respectively. The “as-is” depths of corrosion for members 1, 2, and 4 are unknown and need to be determined. In this study, forces of 2 kN and -2 kN were applied along degrees of freedom 4 and 11, respectively, to excite the structure.
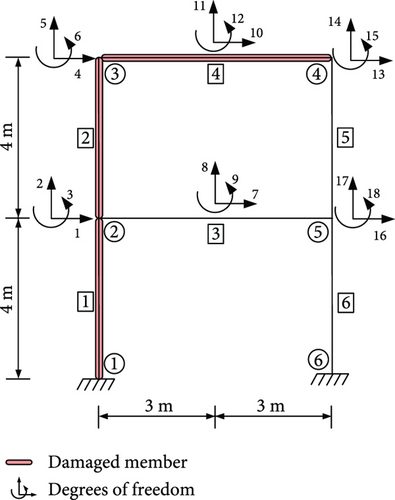
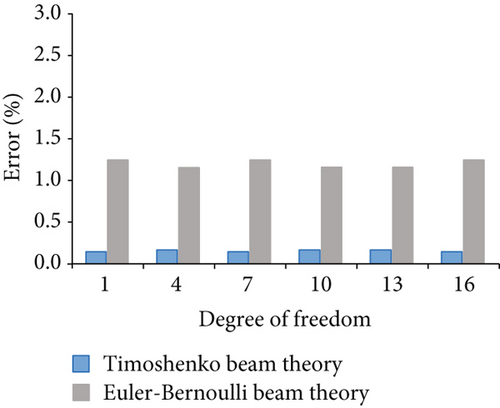
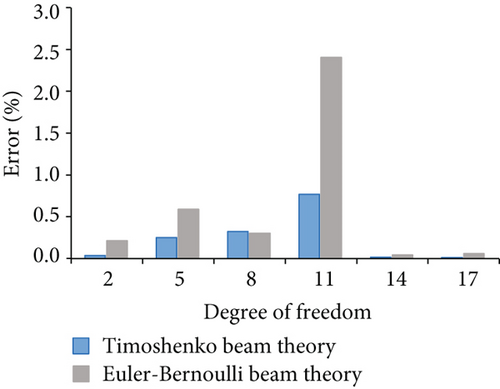
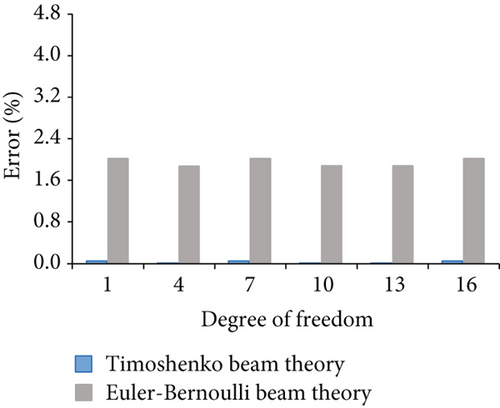
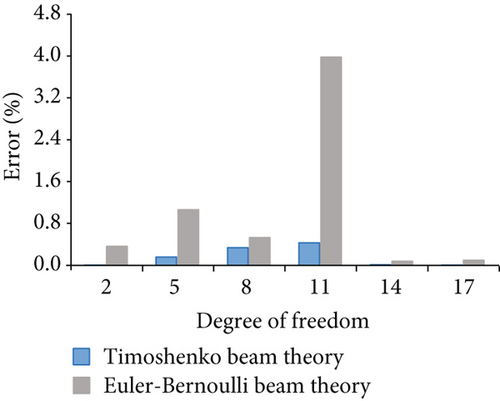
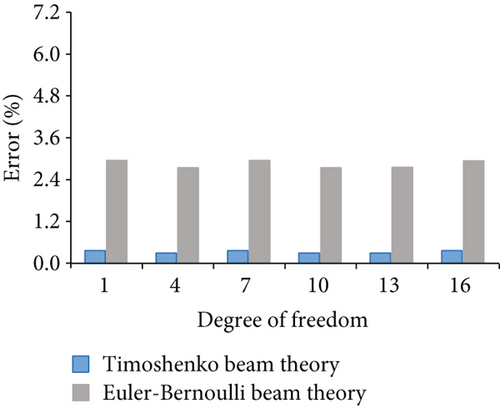
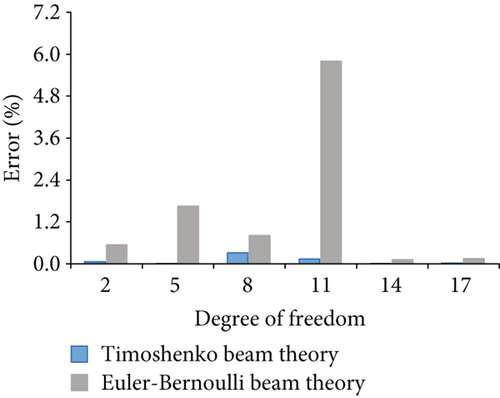
Figure 6 shows the nodal displacement errors for case 1 from the Euler–Bernoulli beam theory and the Timoshenko beam theory. Figure 6(a) shows the errors corresponding to horizontal degrees of freedom 1, 4, 7, 10, 13, and 16. Figure 6(b) shows the errors corresponding to vertical degrees of freedom 2, 5, 8, 11, 14, and 17. The maximum error from the Timoshenko beam theory is 0.77% and from the Euler–Bernoulli beam theory is 2.41%. Figure 7 shows the errors for case 2, and the maximum error from Timoshenko beam theory is 0.43% and from the Euler–Bernoulli beam theory is 3.98%. Figure 8 shows the errors for case 3, and the maximum errors from the Timoshenko beam theory and the Euler–Bernoulli beam theory are 0.36% and 5.80% for the horizontal and vertical degree of freedom, respectively. According to Figures 6–8, the nodal displacements calculated using the Timoshenko beam theory are closer to the finite element model’s calculation, and all the errors are less than 1%.
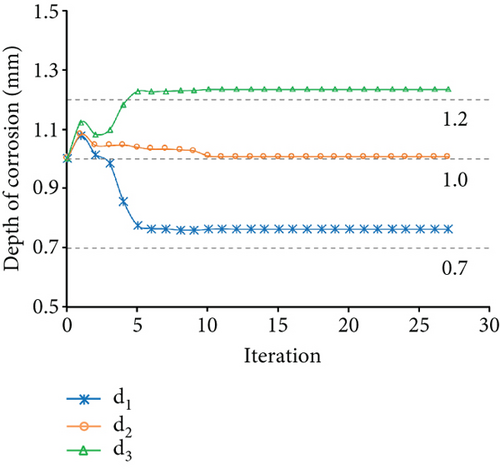
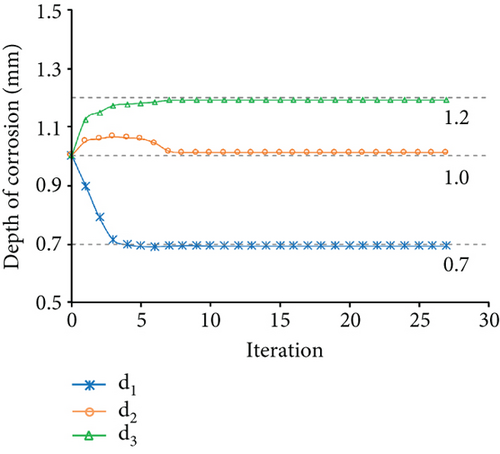
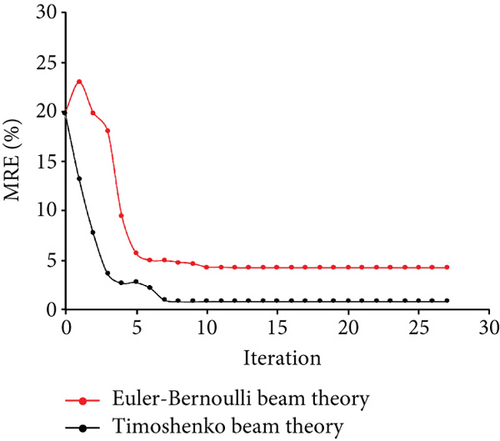
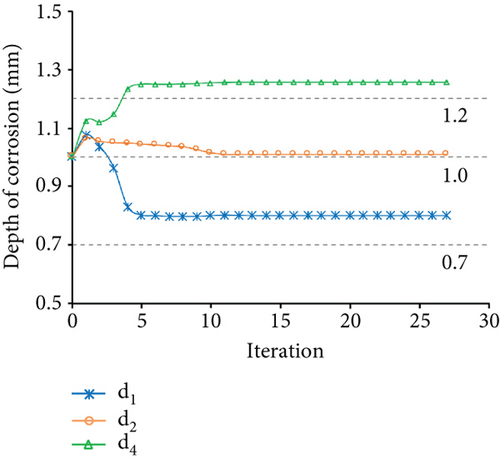
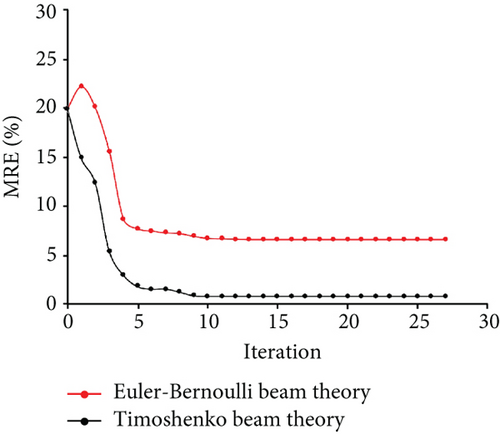
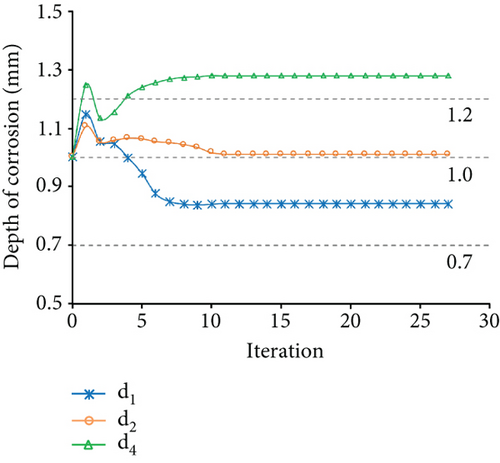
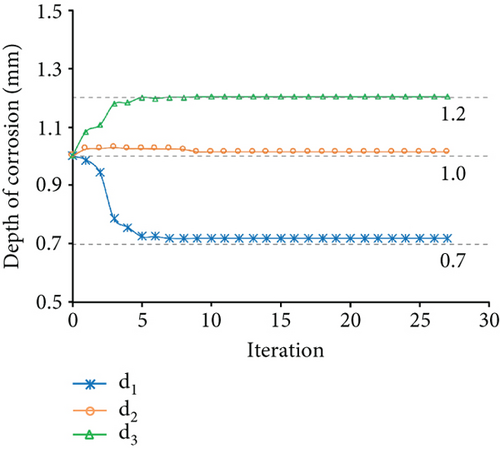
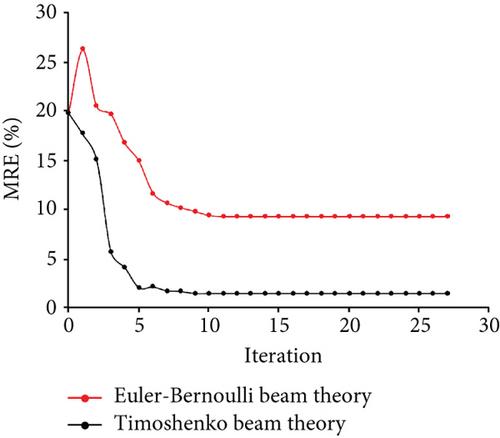
The measured displacements are along degrees of freedom 1, 4, 7, 10, 11, 13, and 16. Figure 9 shows the identification results of case 1. Figures 9(a) and 9(b) show the optimization results of the parameter identification for the frame structure, based on the Euler–Bernoulli beam theory and the Timoshenko beam theory, respectively. Figure 9(a) reflects the variations of d1, d2, and d4 with the number of iterations, based on the interior-point method, and the final optimal value of d was found to be inconsistent with the “as-is” values. Figure 9(b) shows that the final optimal value of d was consistent with the “as-is” values. The variation of MRE during the optimization process is shown in Figure 9(c) based on the Euler–Bernoulli beam theory and the Timoshenko beam theory. Figures 10 and 11 show the identification results of case 2 and case 3, respectively. Based on Figures 9–11, the final MRE values for shapes A, B, and C corresponding to different beam theories are listed in Table 2.

| Method | Shape A | Shape B | Shape C |
|---|---|---|---|
| Euler–Bernoulli | 4.21% | 6.54% | 9.30% |
| Timoshenko | 0.88% | 0.81% | 1.51% |
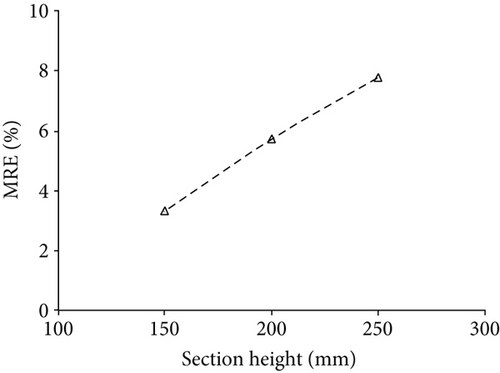
Figure 12 shows the accuracy improvement in the final optimal values with different shapes; the vertical axis represents the improvement in MRE by using the Timoshenko beam theory, and the horizontal axis represents the variation in the height of section. Compared to the parameter-identification method based on the Euler–Bernoulli beam theory, the parameter-identification method using the Timoshenko beam theory can improve the accuracy of MRE by 3.33%, 5.73%, and 7.79% for cases 1, 2, and 3, respectively. Thus, it can be observed from the identification results that the parameter-identification method based on Timoshenko beam theory can improve the identification accuracy significantly.
7. Parameter Identification for Frame Structures with Different Rectangular Cross-Section
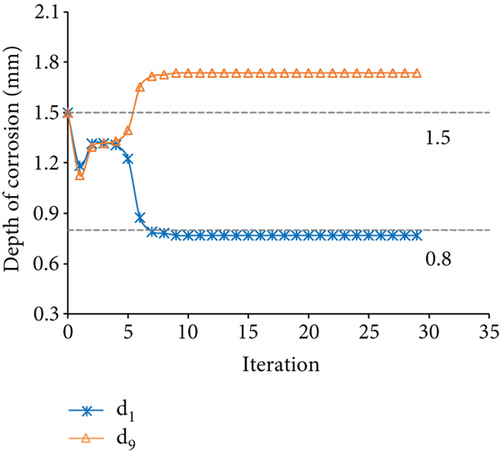
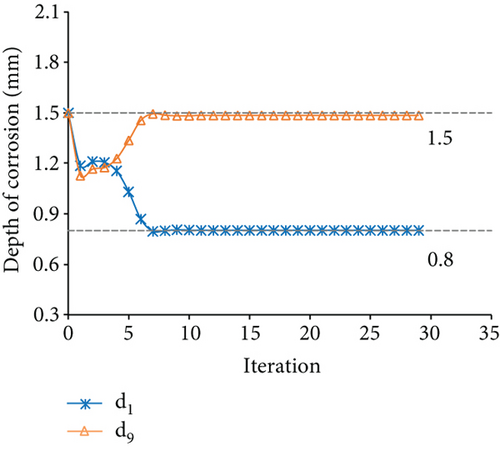
Figure 13 shows a three-story, two-bay frame structure with slender beams. This structure was used to analyze the effect of transverse shear deformation on the frame-structure parameter identification with different rectangular cross-section. Table 3 shows the rectangular cross-sectional dimensions. There are three different cases corresponding to the frame “as-built” condition. In cases 4, 5, and 6, all the members’ cross-sections are shapes D, E, and F, respectively. Assuming the corrosion exists in members 1 and 9 of the frame. The depths of corrosion for members 1 and 9 are 0.8 and 1.5 mm, respectively. The “as-is” depths of corrosion for members 1 and 9 are unknown and need to be identified. In this analysis, force of 2.5 kN is applied along degrees of freedom 1, 4, and 7, respectively, to excite the structure.

| Shape | h (mm) | b (mm) |
|---|---|---|
| D | 30 | 15 |
| E | 35 | 15 |
| F | 40 | 15 |
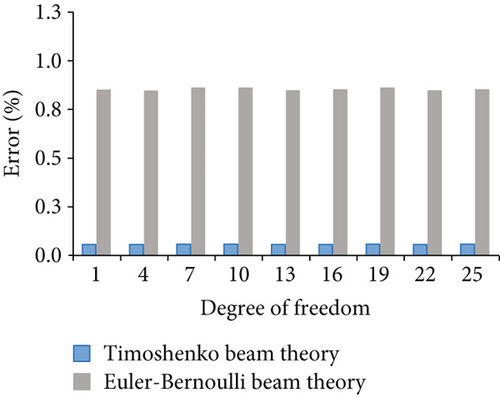
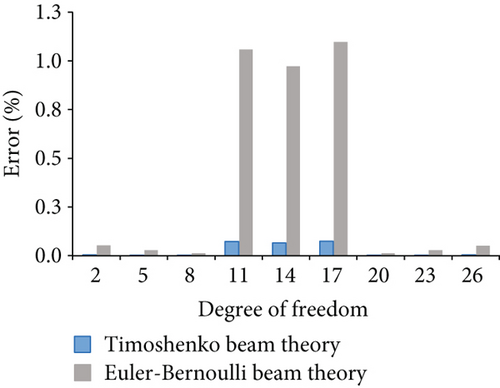
Figure 14 displays the nodal displacement errors for case 4. Figure 14(a) shows the errors corresponding to horizontal degrees of freedom 1, 4, 7, 10, 13, 16, 19, 22, and 25. Figure 14(b) shows the errors corresponding to vertical degree of freedom 2, 5, 8, 11, 14, 17, 20, 23, and 26. Although the calculations of the Euler–Bernoulli beam and Timoshenko beam theory are close to those of the finite element model, the nodal displacement of the frame considered shear deformation is less error. Figures 15 and 16 show the errors for case 5 and case 6, respectively.
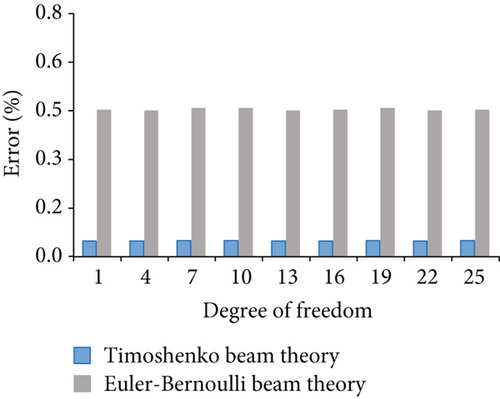
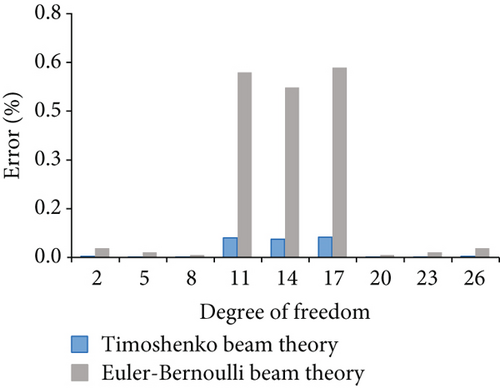
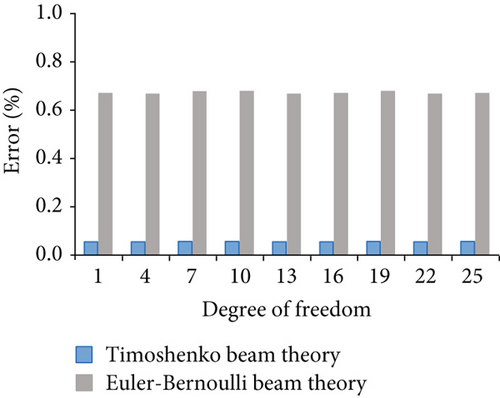
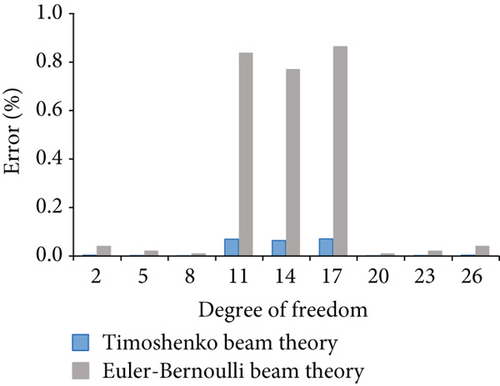
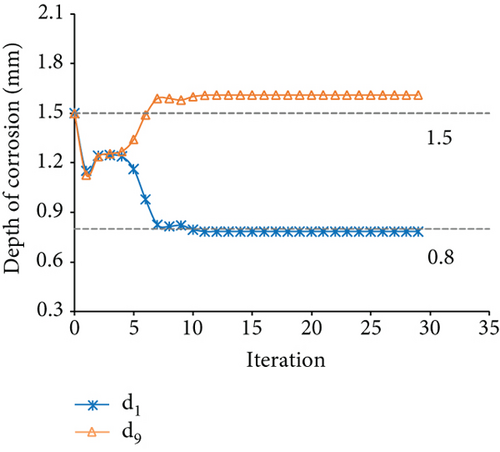
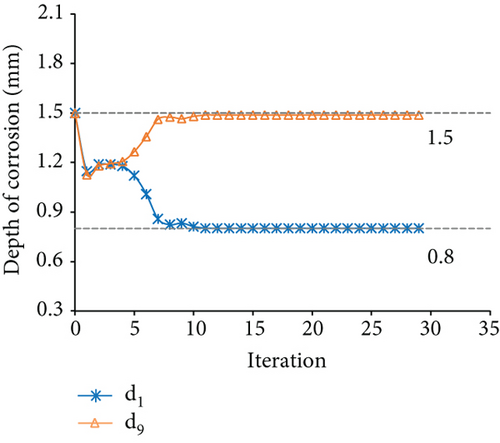
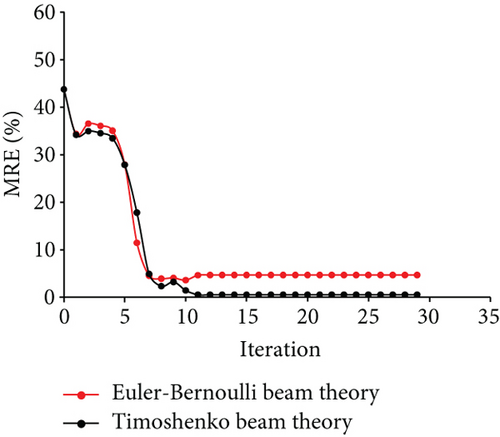
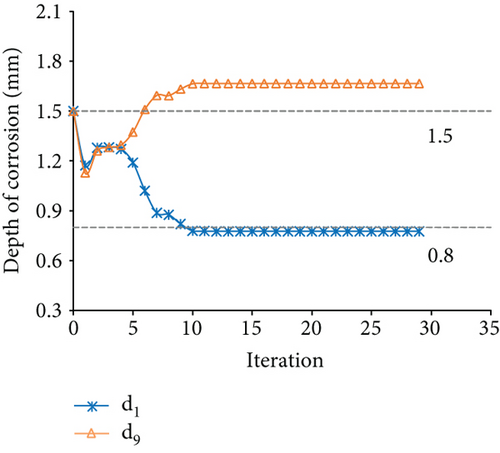
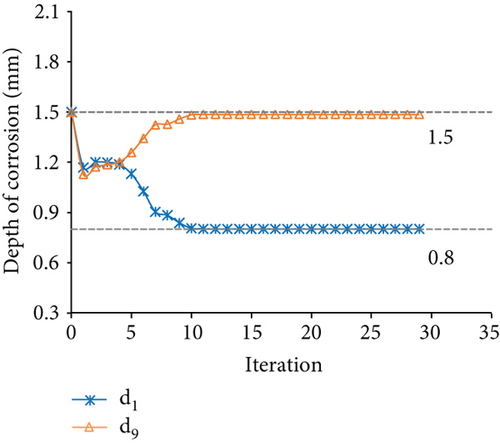
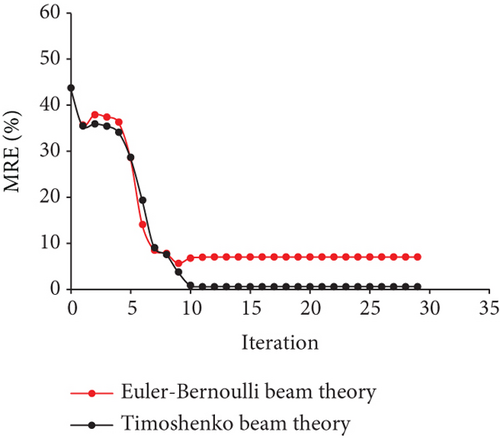
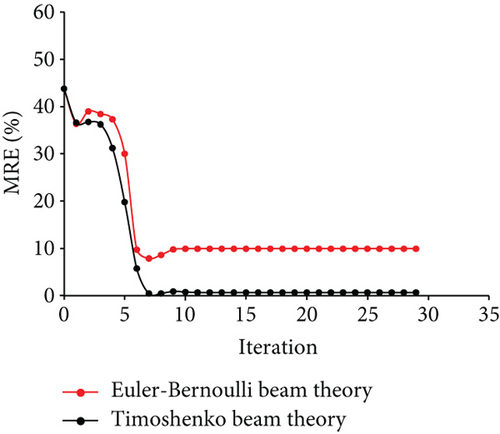
The measured displacements are along degrees of freedom 1, 4, 7, 10, 13, 16, 19, 22, and 25. Figure 17 displays the results of the identification for case 4. Figures 17(a) and 17(b) show the optimization results of the parameter identification for the frame structure, based on the Euler–Bernoulli beam theory and the Timoshenko beam theory, respectively. Figure 17(a) reflects the variations of d1 and d9 with the number of iterations, based on the interior-point method. The final optimal value of d was identified and was inconsistent with the “as-is” values. Figure 17(b) demonstrates that the final optimal value of d was identified, which was consistent with the “as-is” values. The variation of MRE during the optimization process is shown in Figure 17(c), based on the Euler–Bernoulli beam theory and the Timoshenko beam theory. Figures 18 and 19 show the identification results for case 5 and case 6, respectively. Table 4 shows the final MRE values for shapes D, E, and F using different beam theories.
| Method | Shape D | Shape E | Shape F |
|---|---|---|---|
| Euler–Bernoulli | 4.66% | 7.04% | 9.92% |
| Timoshenko | 0.50% | 0.58% | 0.68% |
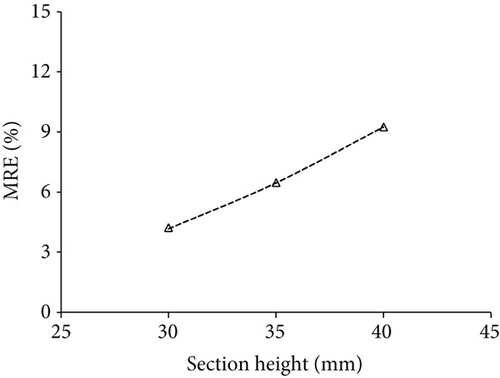
Figure 20 displays the accuracy improvement in the final optimal values for different rectangular cross-sections. Compared to the parameter-identification method based on the Euler–Bernoulli beam theory, the parameter-identification method using the Timoshenko beam theory can improve the accuracy of MRE by 4.16%, 6.46%, and 9.24% for cases 4, 5, and 6, respectively. It can be inferred from the results that using the Timoshenko beam theory to identify damage can substantially enhance the performance of damage identification methods for frames with rectangular cross-section.
8. Conclusions
In this study, the effect of shear deformation on the nodal displacement and parameter identification of steel-frame structures with slender beams was analyzed. This study presents a novel method to identify damaged frames with slender beams by considering shear deformation. To reduce the frame-structure analytical errors in the optimization processes, the parameter-identification method was modified to include the transverse shear deformation. It was shown that for different cross-sectional steel frames with slender beams, the errors of the nodal displacements obtained by the two beam theories and finite element method are relatively small. In this case, the theories are generally accepted as equivalent. However, this paper demonstrated that although errors from these theories are not obvious when calculating nodal displacements, the errors in parameter identification are very significant. Considering the transverse shear deformation can effectively improve the accuracy of parameter identification, and the results are consistent with the structure “as-is” condition.
Conflicts of Interest
The authors declare that they have no conflicts of interest.
Acknowledgments
This research was funded by the Natural Science Foundation of Jiangsu Province, China (Grant No. BK20200492).
Open Research
Data Availability
The data used to support the findings of this study are included within the article.


