Study of Friction and Wear Behavior of Graphene-Reinforced AA7075 Nanocomposites by Machine Learning
Abstract
In this research, the friction and wear of AA7075 nanocomposites reinforced with graphene and graphite were studied. Graphene’s inclusion dramatically enhanced the material’s mechanical characteristics, friction, and wear resistance. AA7075 is strengthened with less graphene, and AA7075, reinforced with more graphite, exhibits similar wear and friction behavior. Wear rate and coefficient of friction predictions for AA7075-graphene nanocomposites were made using five machine learning (ML) regression models. ML simulations reveal that the wear and friction of AA7075-graphene composites are most sensitive to the proportion of graphene presence, the loadings, and the hardness.
1. Introduction
Due to their high quality, nanocomposites have found widespread use in a wide variety of technological applications. Weight-critical aerospace and automotive industries and tribological applications favor AA7075 nanocomposites over monolithic AA7075 [1, 2]. While AA7075 is highly stiff, strong, and corrosion resistant, it has poor tribological qualities and will seize in dry sliding or with inadequate lubrication. Nanocomposites of ceramics, graphene, graphite, and fiber-reinforced AA7075 have excellent mechanical and tribological properties [3]. Numerous studies have looked into the effects of incorporating ceramic particles into AA7075 composites to boost the materials’ strength and tribological behavior. Powder metallurgy, centrifugal, stirring, and even traditional casting are just some of the many transformations applied to these nanocomposites [4]. The disadvantages of these composites include the difficulty in evenly dispersing the ceramic particles throughout the AA7075 matrix, increased brittleness, and decreased machinability. As a low-cost alternative with the potential to reduce seizing propensity, friction, and wear, AA7075-graphite composites have attracted a lot of interest. Casting, spray depositing, and powder metallurgy is common approaches to working with these nanocomposites. Therefore, the graphite particles embedded in AA7075-graphite nanocomposites improve the tribological performance of sliding applications. Large graphite particles can decrease the mechanical properties of self-lubricating AA7075-graphite nanocomposites. Recent studies explain graphene-infused, self-lubricating AA7075-graphene nanocomposites that improve tribological and mechanical properties.
Graphene consists of sheets of single-atom carbon arranged in a honeycomb pattern [5]. Graphene is unlike other materials because of its unusual friction and wears features. Because of its atomically flat surfaces and ultrathin layers, graphene has applications at both the nano and microscales. Graphene lasts a long time since it has a high mechanical strength [6]. Using the nanoindentation method of atomic force microscopy, Arun et al. [7] determined that graphene is the most robust material yet quantified for monolayer graphene membranes. They found that the tensile strength of defect-free monolayer graphene was 131 GPa, whereas Young’s modulus (E) was 1 MPa. Researchers [8] conducted their research and found that the bilayer has a tensile strength of 127 GPa, the trilayer has a tensile strength of 102 GPa, and Young’s modulus of each is 1.05 and 0.99 GPa. Nanocomposites are composite materials that improve the mechanical and material properties produced by combining a matrix and reinforcing components, such as the matrix’s toughness and flexibility and the reinforcement’s strength and moduli. Unlike further carbon-based struts like graphite or else carbon nanotubes, graphene’s plate structure makes its dispersion in the matrix phase easier. Graphene is an appealing choice for use as the reinforcing phase in self-lubricating nanocomposites because of its high mechanical capabilities, low cost, and good electrical, optical, and thermal properties.
Recent research [9, 10] has detailed the mechanical properties of graphene-reinforced AA7075 nanocomposites and the technologies used to make them. Graphene distributed throughout the metal matrix contributes to the nanocomposite’s mechanical strength. The aggregation of particles may negatively affect the stability, which causes a nonuniform dispersion. Examples include the AA7075-graphene nanocomposites, which saw a 62% increase in tensile strength compared to the AA7075 base alloy when using graphene nanosheets as the reinforcing phase [11]. According to studies by Ul Haq and Anand [12], adding graphene at 3 and 5 wt% to an aluminum AA2124 matrix boosted the material’s tensile strength by 20.4% and 21.6%, respectively, while also increasing the yield strength by 104% and 127.6%. Adding graphene nanoplatelets at a weight percent of 0.1–1 to an aluminum AA7068 matrix has been shown to boost the material’s tensile strength, as reported by Ul Haq and Anand [13]. But others, such as Hasan et al. [14] and Patel et al. [15] found that adding graphene to AA7075 nanocomposites reduced the material’s tensile strength.
Friction, wear, and lubrication are all aspects of tribology, which studies the relationship between moving and contacting surfaces and the forces acting upon them. The tribological behavior of AA7075-graphene nanocomposites has been the subject of several recent reports [16, 17]. The tribosurface of AA7075-graphene nanocomposites is coated with soft lubrication layers of graphene, making it suitable for sliding applications after a brief break-in period. A Gr-rich solid lubricating layer at the contact as more graphene smears out during further sliding. The lubrication layer isolates moving surfaces to prevent metal-on-metal interaction, similar to self-lubricating AA7075-graphite matrix composites, decreasing wear and friction. It predicts that multimaterial composites with graphene than graphite particles will have higher tribological performance [18]. It is because of the former’s increased mechanical strength and hardness. Tribological behavior is of paramount importance in the design and synthesis of machine components involving sliding, rotating, or oscillating contacts since it is a system reaction rather than a material feature.
Understanding the behavior of AA7075-graphene nanocomposites is crucial for scheming effective systems for tribological approaches. It is an interesting process because the wear and friction performance of the two materials depends on variant material, mechanical, and tribological variables. One-sample trials and simple 2-parameter correlations have been the mainstays of research on AA7075-graphene nanocomposite wear behavior and friction. To perform this type of study, the coefficient of friction (COF) or wear resistance is plotted against a solitary factor, while all other experimental variables are held constant. It is often insufficient and inefficient to develop thorough knowledge when complicated tribological relationships are present simply. While the 2-parameter analysis has limitations, circumvent it by using a data-driven method that simultaneously considers numerous factors’ impact across a larger domain.
It demonstrates that a fundamental obstacle to tribological research is the lack of calculations from the first rules of physics and chemistry. Data-driven AI and machine learning (ML) algorithms have allowed scientists to look at higher order correlations between several variables than was possible with the standard 2-parameter study. Complex ML models, such as the gradient boosting machine (GBM) and the artificial neural network (ANN), use elaborate approaches to understand the patterns in the dataset and produce accurate predictions. Friction and wear of AA7075-graphene nanocomposites were studied by Yang and Buehler [19] under different lubrication conditions, with the use of both separate and combined models. Statistical methods explain the friction and wear processes of AA7075-graphene nanocomposites. To better predict friction and wear and to identify trends in the tribological properties of these materials, we will employ experimental data to train ML models.
2. Mechanisms of Wear and Friction in AA7075-Graphene Nanocomposites
Tribology is concerned with the study of wear and friction because they are the most important causes of substantial corrosion and energy loss in dynamic arrangements. Friction and wear mechanisms in multiphase nanocomposites such as AA7075-graphene are challenging to characterize. Using AA7075-graphene nanocomposites as examples, the wear and friction mechanisms were seen and measured.
Adhesion between the sliding surfaces (Van der Walls, ionic, covalent, and metal bonds) contributes to COF [20]. Friction coefficient d fluctuates according to mechanical properties, including solidity, strength, and modulus, by the micro and macroscopic distortion of severities of the tribosurface. Friction’s adhesion component is affected by the asperity contact area among the rubbing surfaces. After a short break-in period, a soft graphene tribofilm forms on the AA7075-graphene nanocomposites tribosurface. The actual severity contact area between nanocomposites and the counter face lessens as a stable solid-lubricating graphene coating forms. Due to the reduced metal-on-metal interaction and decreased asperity contact area, the sticky component of the COF falls considerably. Graphene’s addition to an AA7075 matrix dramatically improves the material’s hardness, tensile strength, and flexibility. Since steel is more rigid than most other counter face materials, friction’s deformation or plowing component is declining.
Under varying loads, wear occurs when two surfaces gradually lose material due to sliding against one another. Inspecting the worn area can expose the primary wear processes for a specific substantial combination. Most AA7075 nanocomposites’ wear in tribological applications falls into adhesive wear, abrasive wear, and delamination wear [21]. Adhesion between the sliding surfaces leads to wear known as adhesive wear. Displacement and surface fracture at the asperity layer cause the material to break apart and move between characters. As a result, AA7075 wears more slowly. Several tribological tests [22] have shown that adhesive wear is the dominant wear process for AA7075-Gr.
The operating situation and material attribute mainly determine the significant wear process. Wang et al. [23] state that the wear during sliding contact could range from insignificant to severe, depending on the average load. The transition between these two wear regimes results in drastically different wear behavior and happens at a critical load. In the same way, the sliding velocity also shows a shift in its wear pattern. A lower wear rate and the dominance of abrasion as the effective wear mechanism describe the mild wear regime. Surface smoothness and the presence of tiny grooves running slantways are telltale signs of abrasive wear on AA7075-graphene nanocomposites. The graphene coating continues to function and helps limit wear in light wear [24, 25]. The wear rate increases dramatically as the load or sliding speed increases, marking the shift from mild-to-severe wear (outside the range of acceptable values). Because of this, the lubricating coating is often irreparably harmed or loses its ability to prevent excessive wear [26]. Exfoliation wear necessitates poor mechanical characteristics due to inhomogeneous mingling of the reinforcing phase, displacement accumulation, and fracture at a subsurface layer. Delamination wear causes thin laminates to discard as waste due to the instability of crack propagation at the tribosurface’s subsurface. Exfoliation, craters, and scratches are far less common on AA7075-graphene nanocomposites than on base AA7075, according to research by Li et al. [27] and Hossain et al. [28].
3. Variables Affecting Wear and Friction of AA7075-Graphene Composites
The wear and friction of AA7075-graphene nanocomposites are affected by tribological and material-specific factors. Here, it uses conventional analysis to discuss how these factors affect friction and wear.
3.1. Material Variables
Variables in materials include their makeup, microstructure, characteristics, and parameters related to the production method. Considerations such as industrial process, heat treatment, graphene weight, graphene type, thickness, matrix arrangement, and mechanical characteristics are all relevant when studying the friction and wear of AA7075.
3.1.1. Impact of the Heat Treatment and Manufacturing Method
According to theoretical studies, increasing the graphene content of AA7075 composites can significantly enhance the material’s mechanical and tribological characteristics. These advancements are impossible to achieve without a uniform distribution of graphene in the AA7075 matrix and a robust interfacial connection between the two. That is why AA7075-graphene nanocomposites require careful attention during production and heat treatment. Defects in manufacturing include nanoparticle aggregation, pore formation, poor interfacial connection, carbide creation, and cracks in subsurface regions. Casting, severe deformations, additive manufacturing, and powder metallurgy are all standard techniques for making these nanocomposites. Production of AA7075-graphene nanocomposites has thus far relied most heavily on powder metallurgy. A filthy AA7075-graphene surface and oxidation of the AA7075 matrix are expected outcomes of this method due to the incorrect selection of process variables. There has been a shift away from casting AA7075-graphene nanocomposites in favor of powder metallurgy. This production method can be inexpensive but does not permit much management over the graphene’s distribution in the AA7075 matrix. Casting procedures include high processing temperatures encouraging interfacial interactions between AA7075 and graphene. In addition, graphene nanoparticles are prone to segregation and accumulation due to the density mismatch between AA7075 and graphene. The weakness of these nanocomposites is due to porosity, which concerns the gravity casting method. All of these casting defects might reduce the quality of the casting in terms of mechanical and tribological characteristics. Microstructural flaws like crashes and breakages may occur during the production of AA7075-graphene composites using a robust plastic deformation strategy. The porosity and low flexibility of AA7075-graphene composites may make it challenging to create complex shapes using additive manufacturing techniques such as selective laser melting. AA7075-graphene composite’s mechanical and surface qualities are very variable and dependent on the heat treatment methods and other factors.
3.1.2. Impact of Graphene Content
Graphene improves the tribological performance of composites by acting as a matrix material. Graphene, whether in a single sheet or several, acts as a solid lubricant when incorporated into a matrix for use in sliding mechanisms. The tribological characteristics of these nanocomposites modify by the method graphene changes their mechanical properties.
(1) Solid Lubricating Agent Graphene. Graphene addition to AA7075-graphene nanocomposites decreases COF and wear rate by improving the hardness and encouraging tribofilm formation.
Orowan reinforcement, load transmission, grain refining, and a mismatch in coefficient of thermal expansion (CTE) among graphene and the AA7075 make graphene-reinforced nanocomposites more challenging to work through. The addition of graphene decreases the wear rate because it improves hardness, which is inversely related to wear as calculated by the Archard equation. We can see in Figure 1(a) that the wear rate of AA7075-graphene nanocomposites steadily goes down as the graphene content increases. The wear rate reduces rapidly when the graphene content is lower, and then at a higher critical graphene content, the wear rate decreases more gradually. After the optimal graphene content attains, a slight wear rate acceleration obtains. It may be because AA7075-graphene becomes more brittle after reaching a specific graphene concentration in the matrix. This marginal improvement, however, pales in comparison to the substantial wear rate improvement that would result from reducing the graphene content.
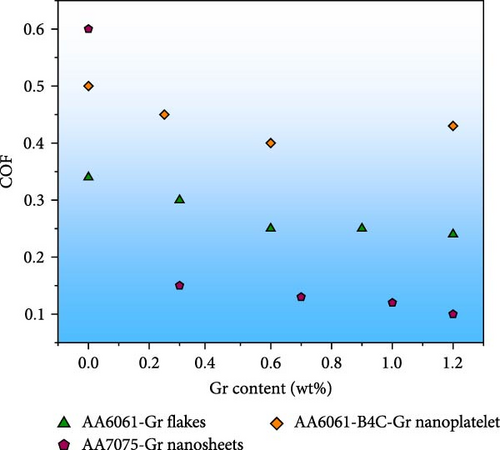
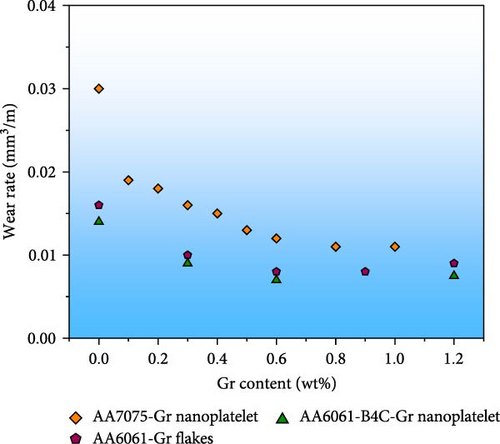
When bulk graphene nanosheets disperse throughout the tribosurface through sliding wear, and create a graphene-rich tribofilm. By reducing the contact between the asperities of the contact surface and the maximum peak (Rp) and minimum valley (Rv) of the surface profile, a stable micro tribofilm can reduce wear. The lubricating properties of the tribofilm lessen the need for metal-on-metal contact, which in turn facilitates the friction heat produced by the sliding contact. Graphene addition consistently reduces the COF in AA7075-graphene nanocomposites, as seen by the COF against graphene content graphs (Figure 1(b)). Changes in COF are dramatic after even a little increase in graphene concentration from 0 wt%. A threshold graphene concentration got, after which additional surges in graphene content lead to a decrease in COF, but one less severe than before.
Using graphene (graphene nanoplatelets, oxide, microplatelets, flakes, monolayer Gr, rGO, and multilayer graphene) as the reinforcing phase reduces friction and wear, with the degree of reduction depending on the number of graphene layers and the kind of graphene utilized. It demonstrates that the frictional force decreases as the number of graphene layers increases. By allowing interlayer sliding, the frictional force lessens in multilayer Gr, graphene nanosheets, and graphene nanoparticles. Furthermore, Roccapriore et al. [29] have experimentally demonstrated that three or four-layer graphene is more resilient than monolayer graphene and resistant to sliding wear. The superior friction performance of AA7075-graphene composites over graphite nanocomposites can be substantially attributed to interlayer sliding between graphene nanosheets.
(2) Mechanical Properties of Graphene and Its Incorporation. The mechanical characteristics of AA7075 nanocomposites, such as hardness, strength, and Young’s modulus, vary with reinforcing particle size. The mechanical properties of AA7075 diminish when big reinforcing particles or particle aggregation promote defects like pores and cracks. In Figure 2, graphene content is compared to tensile and hardness strengths for AA7075-graphene nanocomposites in Figure 1. As graphene adds, the material’s tensile strength and hardness increase up to a certain point but then begin to decrease.
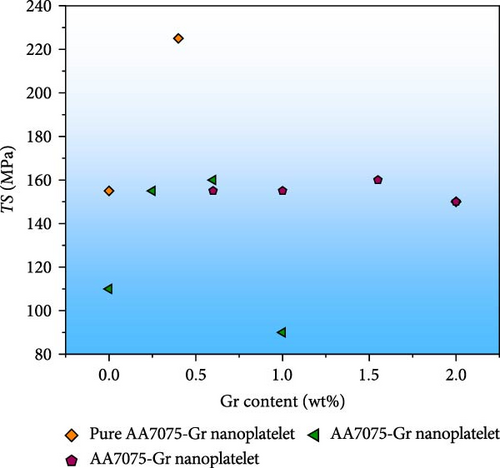
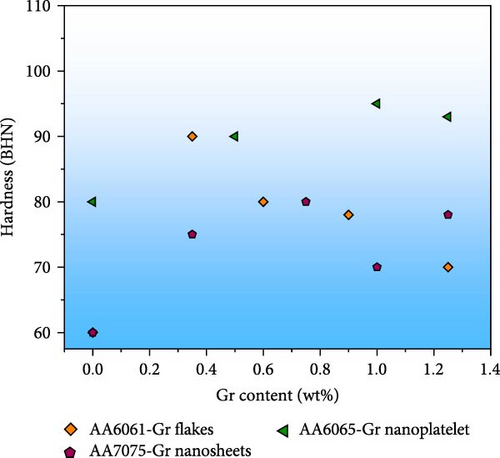
Mechanical qualities in AA7075-graphene nanocomposites improve by ensuring that graphene is evenly distributed and oriented throughout the composites. Researchers [30] found that the increased strength of composites can be attributed, in part, to the fact that the graphene nanoparticles (GNPs) are dispersed evenly throughout the AA7075 composites, allowing for efficient load transfer. They also discovered that mechanical behavior degraded and graphene shearing at the tribosurface increased while utilizing 1.2 wt% graphenes as the reinforcement. They reasoned that the GNPs could not usually diffuse across the matrix due to the increased weight percentage. Agglomeration expands porosity and cracks and degrades the structure, as seen by Zhao and Fang [31] when more than 1.2 wt% graphene adds. Furthermore, substantial flaws in AA7075-graphene nanocomposites are promoted by graphene agglomeration, leading to premature composite failure [32].
The higher strength of AA7075-graphene nanocomposites results from several different mechanisms, such as mismatch in CTE, load transmission, grain refining, and Orowan reinforcing [33]. The CTE mismatch enhances the interfacial prismatic punch of dislocations, increasing the composites’ strength. High-aspect-ratio graphene reinforcements are the most effective at transmitting loads because they form strong bonds with the matrix. Increased interfacial contact between GNPs and the AA7075 matrix attain by their 2D structure and crumpled surface [34]. Hall–Petch connection [35] explains why grain refining makes a difference in strength. By introducing nanoparticles like GNPs, the Orowan bypass mechanism creates residual dislocation loops, which increase strength via repulsive back stress [36].
3.1.3. Impact of the Matrix Arrangement
The characteristics of the AA7075 utilized as the matrix affect the mechanical and tribological performance of AA7075-graphene composites. Strength, elasticity modulus, and hardness are only some of the mechanical qualities that improve upon by mixing pure AA7075 alloys with other alloying elements [37]. Each AA7075 alloy has distinct microstructural features that influence how much graphene disperses in the matrix, how strong the links are between the matrix and the reinforcing phase, and whether or not a chemical procedure is even possible. Properties like wear resistance and the critical load at which moderate to severe wearing occurs define by the AA7075 in AA7075-graphene nanocomposites (Figure 3(a)).
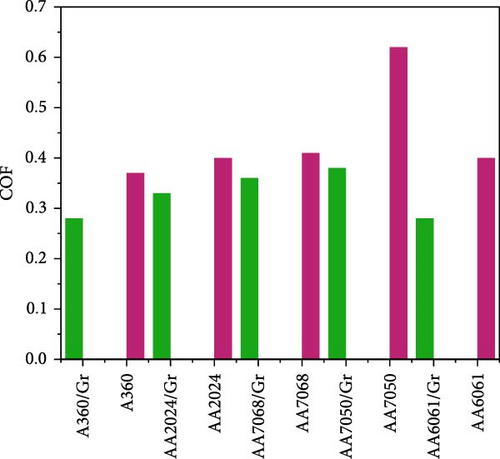
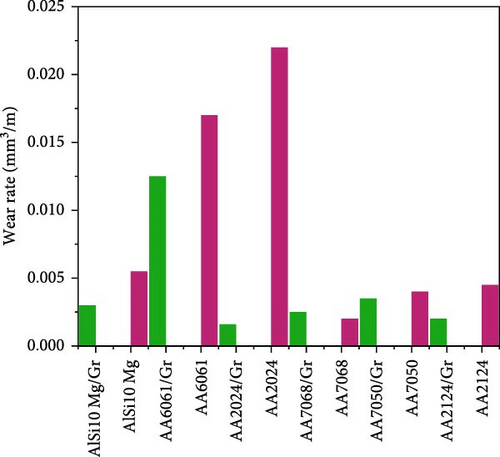
Average wear and COF under similar loading and testing circumstances for several types of unstrengthened AA7075 alloys and comparable graphene-reinforced (0.25–0.5 wt%) composite are displayed in Figure 3. Compared to their unreinforced counterparts, AA7075-graphene composites consistently showed lower friction and wear behavior (Figure 3(b)). Some alloys have a more noticeable discrepancy between COF and wear rate than others. Also, it is not always the case that reducing COF would slow down your wear rate or vice versa. Though reduced by adding 0.3% graphene to AA7075, the wear rate is slightly lower.
3.2. Tribological Variables
In this post, we will go over how various factors in tribological tests can impact the wear and friction performance of AA7075-graphene composites. Before conducting tribological testing, a few considerations are typical load, sliding distance, speed, and lubrication status.
3.2.1. Impact of Normal Load
According to Karathanasopoulos et al. [38], the average load is critical in determining when wear will progress from mild to severe. Average load’s effect on AA7075-graphene and AA7075-graphene nanocomposites COF and wearing rate in Figure 4. More force results in better nano- and microscale asperity contact between the sliding surfaces. The tribosurface will plastically deform more when there are more asperities in connection. All of them contribute to a greater degree of resistance. The load dependence of wear and friction qualities may be more nuanced in AA7075-graphene nanocomposites because they are a two-stages self-lubricating material. Because the softer phase on the tribosurface might stretch out more with an increase in load. Since this is the case, AA7075-graphene nanocomposites have been shown in several studies to raise or reduce COF under normal load (Figure 4(b)).
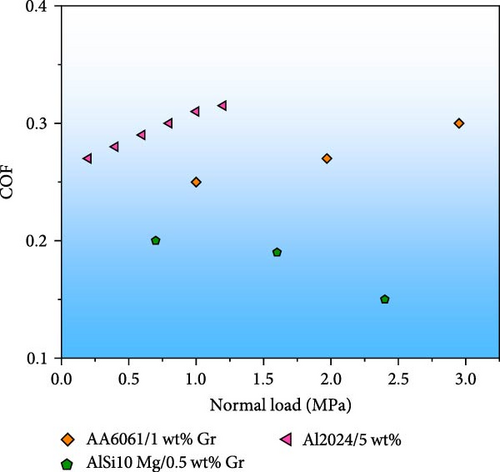
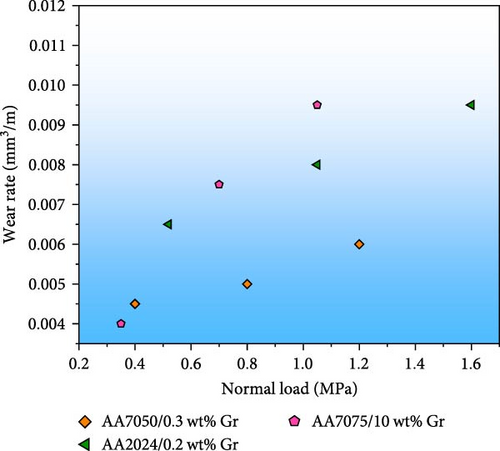
Furthermore, it indicates that under constant loads, friction and wear were greater in AA7075-graphene composites with a higher weight percent of graphene than in those with a much lower weight percent of graphene (Figure 4). AA7075-graphene composites have advantageous mechanical properties. The graphene phase incorporated in the metal disperses via scraping the tribosurface. Repeated rubbing can cause the development of a stable Gr-rich coating, which, in comparison to the starting state, lowers the amount of wear and friction among the stressed surfaces. However, after a solid graphene covering has developed, friction and wear will likely rise under typical loading settings. When the graphene coating is unharmed, friction and wear reduce, allowing for mild wear at lower specific loads. When subjected to more significant stresses, the graphene-rich layer is frequently damaged beyond repair or loses its ability to prevent the extreme wear that is otherwise detected. Researchers [39] found that the AA7075-graphene nanocomposite’s wear mechanisms change from abrasive to delamination wear as the load increases. Surface roughness and shear strain were also higher in conjunction with high normal loads. Wear rate and COF for AA7075-graphene nanocomposites predicts with the help of an ANOVA.
3.2.2. Impact of Sliding Distance
Calculating the impact of the sliding distance of wear and friction is complicated due to the AA7075 matrix composites. The solid–fluid layer’s production, load, and sliding properties may complicate the relationship. Figure 5 displays the correlation between sliding distance, wear rate, and COF for AA7075-graphene, and AA7075-graphite multimaterial composites. The COF and the rate of wear for AA7075-graphite nanocomposites both increased with sliding distance. These [40] result from long-term sliding due to microthermal softness triggered by interface heat and a diminished graphene coating on the tribosurface.
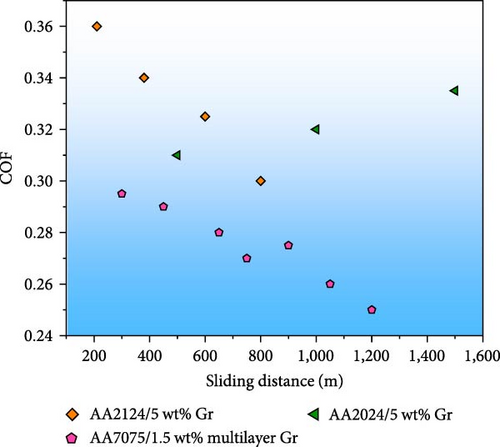
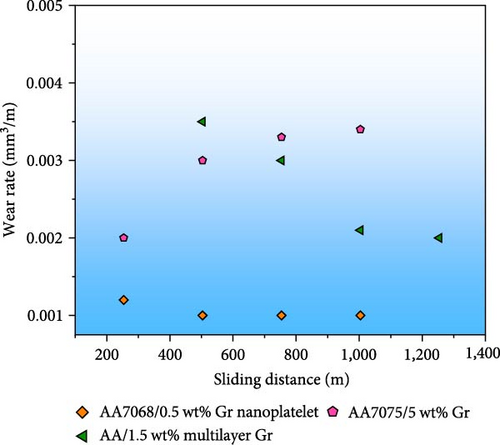
Constantly decreasing the COF and wear rate by sliding AA7075-graphene nanocomposites is a viable strategy. The complex graphene components that protrude from the surface of AA7075-graphene composites are the root of their wear resistance. This relationship links the wear rate and the sliding distance inversely. Stable graphene layers on the tribosurface further reduce the COF by allowing for a longer sliding distance with the same amount of effort. Sliding distance affects wear rate more than the COF, as shown by the ANOVA results for AA7075-graphene composites tribological data by Li et al. [41].
3.2.3. Impact of Sliding Speed
Frictional heat generates at a constant rate, and the tribosurface temperature rises in response to an increase in sliding velocity. This warming helps the matrix soften micro thermally. In addition, it facilitates the production of oxides and the dissolution of microstructure-associated precipitates, hence lowering flow stress. All of them contribute to the accelerated AA7075 nanocomposite wear rate. Figure 6 displays the correlation between sliding velocity and wear, and COF of AA7075-graphene and AA7075-graphite nanocomposites.
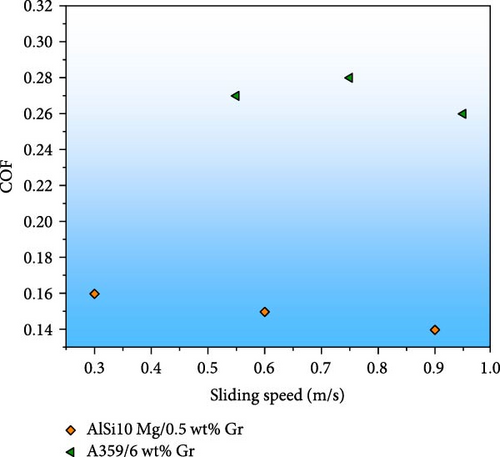
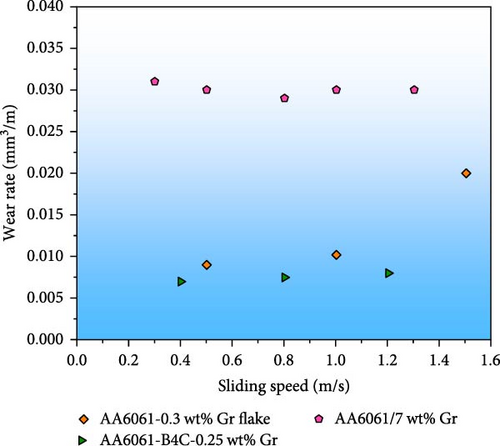
If the speed is low, the wear mechanism is relatively high; if it is high, the wear mechanism is quite severe. Low wear rates are reported in AA7075-graphene nanocomposites at low sliding speeds because of the fully functional graphene lubricating coatings. Wear rate briefly reduces with sliding speed [42] in the low-wear regime of AA7075-graphite nanocomposites. Wear increases for AA7075-graphene and AA7075-graphite nanocomposites as sliding speeds approach critical values. However, while having a more excellent reinforcing percentage, the wear rates found in AA7075-graphene nanocomposites were significantly lower.
In contrast, up to a certain sliding speed, the COF of AA7075-graphite and AA7075-graphene nanocomposites decreases. Increasing the sliding speed reduces the adhesive component of friction in addition to the lubricating provided by graphene or graphite-rich layers. Sliding contacts generate frictional heat, further reducing friction as speed increases. Even when sliding slowly, rises in strain rate raise flow hardness and strength [43]. COF and wear decrease when the contact area among mating surfaces diminishes.
4. Friction and Wear Behavior of AA7075-Graphene and AA7075-Graphite Composites
As indicated by a review of tribological performances from several studies, graphene as the reinforcing phase requires a substantially lower weight percentage than graphite to achieve the same COF and wear rate under similar loading conditions. When bigger graphite particles introduce into the AA7075 matrix, the material’s mechanical characteristics—hardness, flexibility, and strength—suffer severely. As a result of the AA7075 matrix, large graphite particles prefer to cluster together. Because of the previous factors, these composites may not be as effective as AA7075-graphene composites in terms of tribological performance. In contrast, smaller graphene nanoparticles scatter more uniformly in the AA7075 matrix. The addition of graphene nanoparticles to AA7075 composites significantly boosts their mechanical properties and, by extension, tribological performance. These hypotheses explain the superior performance of nanoparticle-reinforced AA7075-graphene composites in wear and friction tests.
It is intended to statistically evaluate the hypothesis that a much lower weight percent of graphene as the reinforcement in the AA7075 matrix can exhibit the same frictional behavior as a much bigger weight percent of graphite using the experimental results from the previous investigations. By employing the life cycle assessment function in IBM SPSS Statistics, we compared COF data for AA7075-graphite (10 wt%) and AA7075-graphene (0.5 wt%) under identical loading conditions to ascertain whether or not the COF values of the paired combinations is comparable. For AA7075-graphite composites, the mean and standard deviation of the COF were 0.1968 and 0.0862, while for AA7075-graphene composites, these values were 0.2047 and 0.0603. These numbers are representative of 33 datasets. According to the central limit formula, the sample size of the trial was sufficient to guarantee a normal approximation. In the linear component analysis, the p-value for the linear component was 0.77. Hence, the null hypothesis was not rejected (since a p-value less than 0.05 are considered essential). It can be concluded with 95% confidence interval that there is no significant difference in the mean COF value of the AA7075-graphene (5 wt%) and AA7075-graphite (10 wt%). The results suggest that the graphene reinforcement phase in the AA7075 matrix may offer the same features as a greater quantity of graphite in the AA7075 matrix under identical tribology settings.
5. Methods and Materials
This study provides the improved performance and refinement of the ML approach for calculating friction and wear. Data gathering, processing, model creation, and parameter optimization for various ML models are covered here.
5.1. Acquisition of Data and Input/Output Factors
The accuracy of ML predictions is highly dependent on the quality of the data employed to practice the models. Building ML models is done with a sizable, well-curated dataset from multiple sources, including various input–output correlations. Diversifying your data sources is advised, as over-reliance on information from a single source can reduce the models’ generalization ability. It takes a lot of time and effort to set up a battery of tribological testing rigs and prepare samples of widely variable material characteristics that analyze to yield the required data. In order to develop reliable ML representations and have amassed tribological behavior data for Gr-enhanced AA7075 composites from the existing literature [20]. The developed ML models that can forecast COF and wear rate based on analyses of datasets, including 432 and 390 specimen data points, respectively. Tribological and material characteristics assess as predictors in the established regression models. Several variables consider, including graphene concentration, AA7075 concentration, SiC concentration, hardness, tensile strength, graphene type, graphene production process, heat treatment, flexibility, density, and many more. Consideration of sliding distance, load, velocity, counter face, and tribological testing technique. There were both categorical and numeric inputs; examples include graphene kind, production method, heat treatment, counter face, and tribotesting method.
5.2. Data Preprocessing and Standardization
Data preparation includes tasks, including cleansing, repairing missing and odd values, randomizing, normalizing, and splitting the data into training and testing sets. While handling the share of data preprocessing and relying heavily on Python and its many available tools. Appropriate processes manually deal with missing and abnormal values in the datasets. We mixed up the data to prevent unintentional biases from entering the ML models. Getting the inputs into more consistent numerical values increases the adaptability of created system. Robust scaler, a tool for normalizing data and scaling its features to account for outliers, was used for this purpose. For the purpose of developing ML regression models, it is important to split the dataset into a training set and a testing set.
5.3. Machine Learning (ML) Models
If we have a set of input factors, supervised ML-trained regression models may be able to predict a result. To forecast the wear rate and friction of AA7075-graphene composites based on 15 materials and input parameters, developed five ML regression models (ANN, KNN, random forest (RF), support vector machine (SVM), and GBM). For ML analysis and model creation, Python and the sci-kit-learn library utilize. Our earlier studies [25–27] provide detailed coverage of the ML above models.
To make predictions, nonparametric KNN regression models use the training data points closest to the target value (neighbors). Forecasts can be made with KNN, an acronym for “k nearest neighbors,” by looking at how similar instances are in a particular training set. Standard methods for tuning the KNN regression model include modifying the number of neighbors tested and the importance placed on the comparative distance among points. The KNN model’s responsiveness to new data points may be influenced by overfitting or underfitting if n neighbors are kept relatively small.
To forecast outcomes, SVM regression models plot data on hyperplanes of increasingly finer granularity. Given that these hyperplanes exist in the high-dimension input data space, SVM can deal with complicated nonlinear relationships. Various kernel functions (such as the linear, polynomial, sigmoid kernel, radial basis function (RBF), etc.) utilize when structuring data on hyperplanes. Previous studies [1, 6] suggested that the RBF function worked better for tribological data. Two variables, the kernel coefficient (γ) and the regularization factor (C), determine how well an SVM model performs. When there are many input variables and only a few observations, SVM models nevertheless perform well.
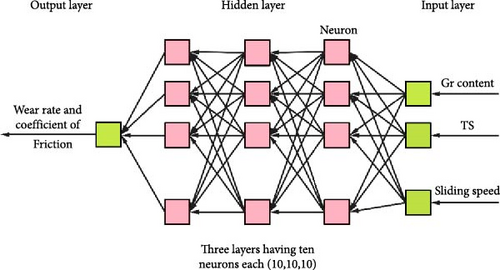
Regression models based on ANNs are cutting-edge tools because of their ability to detect and incorporate nonlinear correlations into predictions. This model’s learning strategy equates to the human brains. Many materials science and tribology areas have succeeded with ANN models. To bridge the gap between the input and output layers in an ANN model, multiple “neurons” or “intermodal units” are scattered throughout several “hidden” layers. It is a complex structure of layers and intermodal units that processes input into meaningful insights. In developing our ANN models, we explored the possibility of using multilayer perceptron (MLP), which process data in a feed-forward fashion. Figure 7 depicts an ANN’s feed-forward MLP regressor design. In this research, three-tiered hidden layers use in the ANN regression models. Ten intermodal units (neurons) employ in each concealed layer. After extensive experiments, we determined that tan h and ReLU were the best activation functions for the ANN techniques used to forecast COF and wear rate.
The prediction model in GBM and RF models uses ensemble techniques based on decision trees. Regression models on decision trees for tribological data. The decision trees used in these models formulate in fundamentally different ways. While GBM uses a sequential approach, RF maintains unpredictability in data selection for creating decision trees. Bagging and boosting are the processes used by RF and GBM for this reason. Efficiency is augmented, and resilience is grown in RF models by avoiding overfitting, thanks to the bagging method. Increasing the number of features and depth of the decision trees in a model can improve its performance. Each tree in the boosting mechanism has its loss function (which can be arbitrarily differentiable) optimized to correct the errors of its predecessor. Since this is the case, GBM is an excellent method for exploring complex causal relationships. It is necessary to optimize their maximum depth, learning value, and some boosting stages (n estimator).
5.4. Optimization of the Machine Learning Models
It is essential to carefully optimize the created ML models to maximize their prediction performance. In the previous paragraph, we covered the topic of the factors of many models that need optimum. The grid and cross-validation to fine-tune our prediction models’ variables were used. These optimization techniques again to run the prediction algorithms with different values for each input parameter were employed. Tables 1 and 2 display the optimal optimization parameters for forecasting wear rate and COF. The complexity of an ANN depends on various factors. The activation function calculates the weightage amount of input variables for an ANN model. The best results were when attempting to forecast COF using an ANN model with three hidden layers and 10 neurons per layer, regularization variables α = 0.012, and activation function tan h (Table 1).
| Type name | Chosen factors |
|---|---|
| Artificial neural network | Activation function: tan h, α = 0.013, hidden layers = (10,10,10) |
| k-Nearest neighbor | Number of considered neighbors = 6, weights = “uniform” |
| Random forest | Maximum features = 5, n_estimators = 80 |
| Support vector machine | Kernel = RBF, γ = 0.09, C = 100 |
| Gradient boosting machine | Learning rate = 0.9, maximum-depth = 3, n_estimator = 150 |
- RBF, radial basis function.
| Type name | Chosen factors |
|---|---|
| Artificial neural network | Activation function: tan h, α = 0.05, hidden layers = (10,10,10) |
| k-Nearest neighbor | Number of considered neighbors = 4, weights = “uniform” |
| Random forest | Maximum features = 6, n_estimators = 30 |
| Support vector machine | Kernel = RBF, γ = 0.3, C = 100 |
| Gradient boosting machine | Maximum depth = 8, learning rate = 0.02, n_estimator = 150 |
- RBF, radial basis function.
Similarly, optimal settings for other models manipulate and improve their predictive abilities with concerning.
6. Result and Discussion
In this part, we report the data from our ML analyses and assess how well they perform using standard performance evaluation criteria. Also highlighted are the results of a data-driven investigation into the impact of various input variables on wear and friction in AA7075-graphene nanocomposites.
6.1. Result for COF Prediction
Several commonly employed statistical performance measures for gauging an ML regression model’s performance; include the coefficient of determination (R2), mean absolute error (MAE), mean square error (MSE), and root mean square error (RMSE). A regression model with an R2 value between 0 and 1 and >0.9 indicates a very accurate prediction model. With R2 < 0. The R2 values for these five COF prediction models ranged from 0.8692 to 0.9643, and their error rates were low (Table 3). However, the GBM (R2 = 0.9642) and RF (R2 = 0.9637) models (both based on a decision tree) produced the best prediction results. It determined that the GBM and RF models’ bagging and boosting processes worked well to deal with friction data containing categorical factors.
| Machine learning model | ANN | KNN | RF | SVM | GBM |
|---|---|---|---|---|---|
| Mean absolute error | 0.0342 | 0.0415 | 0.0252 | 0.0347 | 0.0225 |
| Mean squared error | 0.0038 | 0.0047 | 0.0014 | 0.0035 | 0.0013 |
| Root mean squared error | 0.0625 | 0.0695 | 0.0375 | 0.0593 | 0.0367 |
| R2 value | 0.8943 | 0.8695 | 0.9637 | 0.9043 | 0.9642 |
- GBM, gradient boosting machine; SVM, support vector machine.
As regards accuracy in predicting COF, a GBM model with 150 boosting steps and a max deepness of two for separate regression performed the finest. Using the COF data, learning rates of 0.8 and above, together with other enhanced characteristics, were successful. Figure 8 shows how the COF measured in the lab compares to the COF predicted by the top GBM model. The anticipated and experimental COF values correlated highly well.
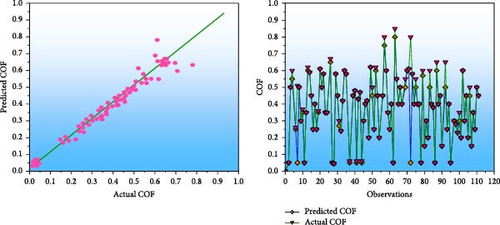
A set of 80 decision trees in the RF model, with four characteristics assessed at the optimal split, yielded the best R2 value (0.9637), indicating the highest prediction performance (max features). The KNN based on distance functions was the simplest of the created models but also the least effective. The better predictive performance in the KNN model attains by assigning equal weight to a set of five neighboring data points used to construct a forecast for a novel data point. However, compared to other ML models, the model still had trouble dealing with the complicated COF dataset. The ANN model has an R2 of 0.8943, indicating that it accurately predicted the COF with high confidence. The accuracy of the ANN model’s predictions is satisfactory, with just modest error terms.
6.2. Impact of Input Parameters in the Forecasting of Coefficient of Friction
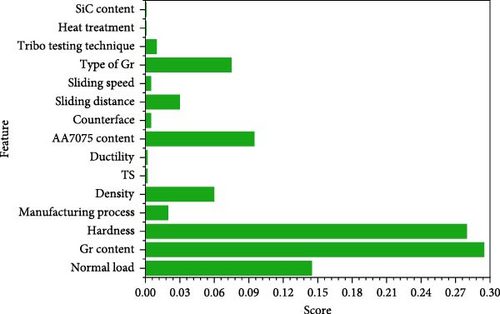
The significant feature of the RF model demonstrates forecasting the COF for AA7075-graphene nanocomposites. It shows that every input variable is crucial (Figure 9). If each factor on the feature importance analysis chart gives the same weight, the final score will be 1, as this is the minimum acceptable value. Individuals are more likely to contribute significantly to output prediction if their scores are higher, while individuals with lower scores are less likely to make any contribution. For the chosen input variables to affect the COF, they must all have non-zero values (Figure 9). The most important predictors of COF were graphene concentration, hardness, and load.
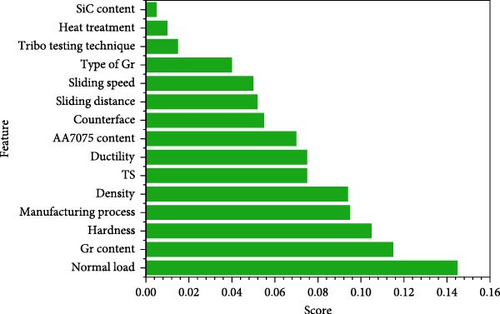
The graphene weight percentage is critical to further the self-lubricating effect and decrease friction, as described. For COF forecasting, the hardness of the material was also a significant factor. Research also demonstrated that COF forecasts for AA7075-graphene nanocomposites significantly impact the type of graphene employed.
6.3. Wear Rate Prediction
Table 4 displays the criteria used to evaluate the performance of ML models used to forecast wear rates for AA7075-graphene nanocomposites. R2 values for the top-performing models were between 0.8902 and 0.9472. Among these were GBM, ANN, and RF. Furthermore, the KNN model based on distance functions incorrectly estimated the wear rate because it oversimplified the complicated relationships in wear data. In spite of the complexity of the dataset involving wear rates, ANN performed admirably. The best overall prediction performance was achieved by the GBM model built on top of a decision tree. The typical could estimate the wear rate with a max accuracy of 94.69%. Despite definite factors in the wear rate, the GBM regression model’s boosting method produced reliable outcomes.
| Machine learning | ANN | KNN | RF | SVM | GBM |
|---|---|---|---|---|---|
| Mean absolute error | 0.0105 | 0.0143 | 0.0093 | 0.0131 | 0.0105 |
| Mean squared error | 0.0009 | 0.0027 | 0.0010 | 0.0012 | 0.0007 |
| Root mean squared error | 0.0273 | 0.0513 | 0.0321 | 0.0342 | 0.0246 |
| R2 value | 0.9341 | 0.7357 | 0.9045 | 0.8902 | 0.9472 |
- GBM, gradient boosting machine; SVM, support vector machine.
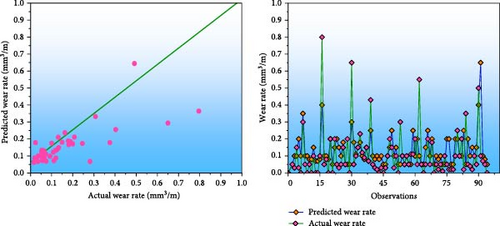
Figure 10 compares the top GBM regression model’s prediction and the observed (experimentally measured) wear rate. Results showed a strong relationship between predicted and measured wear rates. Similarly successful in predicting wear was RF, another decision tree-based model. The model executes successfully if the R2 value is more than 0.9 and the error term values are modest. The ANN model performed admirably as a wear rate predictor with an R2 of 0.9328 and exceptionally tiny MAE, RMSE, and MSE values. The ANN model with three hidden layers of 10 neurons each, the “real” activation function, and an intermediate regularization term (α = 0.05) performed admirably with the complex wear rate data. Again, other models significantly outperformed the distance function-based KNN model when dealing with complex wear data.
6.4. Prediction Performance Comparison
For AA7075, AA7075-graphene composites, and AA7075-graphene composites, we evaluated machine language algorithms for COF and rate of wear prediction in dry conditions. The ML models trained with a decision tree (generalized decision tree, GBM, RF) consistently produce improved prediction ability for friction and wear rate when fed a categorical input. The AA7075-graphene and AA7075-graphite composite ML models showed statistically significant performance improvements over the ML algorithms for the AA7075 base alloys. Friction and wear parameters of composites made of AA7075 and graphite or graphene significantly impact the graphite and graphene self-lubricating action in the AA7075 matrix. Graphene and graphite percentages were significant in predicting wear and friction in studies of these composites. That’s why our models made such precise forecasts. In the absence of lubrication, the COF and wear rate for AA7075 are susceptible to changes in material hardness and other tribological characteristics. The dataset reflected the complexity of the link between input and output variables and the degree to which they were unknown. As a result, the ML models were less effective than their graphene and graphite counterparts in AA7075.
6.5. Impact of the Input Parameters on Forecasting of Wear Rate
Wear on AA7075-graphene nanocomposites can be predicted using the RF model’s feature significance attribute (Figure 11). All inputs with a score greater than zero affect the wear rate. We found that the concentration of Gr, its hardness, and the usual load best predict wear using feature importance research. Graphene content is the most critical element in AA7075-graphene nanocomposites, with a direct correlation between increased mechanical characteristics and a self-lubricating effect. Since hardness was a brake on material loss during tribological interactions, it was an essential factor in wear prediction. Because surface hardness resists material removal rate more than bulk strength, that hardness substantially influences friction and wear more than TS. The standard load plays a crucial role in forming and maintaining the graphene coating on the tribosurface and controlling the transition from moderate-to-severe wear. Graphene type was more influential than COF in determining wear rate in AA7075-graphene nanocomposites. The type and amount of graphene layers and the self-lubricating action can influence the porosity, flexibility, hardness, strength, and connectivity of AA7075. Depending on its shape during tribological interactions, microcracking and brittle fracture can be induced in graphene. Wear in AA7075-graphene nanocomposites may be significantly impacted by all these factors.
The COF and wear rate of AA7075-graphene nanocomposites can be predicted with up to 96% accuracy using the ML models constructed. Without conducting any experiments, we can reliably predict COF and wear for various loading scenarios and material properties. Additionally, these algorithms can narrow in on the most crucial elements affecting wear and friction in AA7075-graphene nanocomposites by analyzing data from over 20 individual tests. To refine the AA7075-graphene nanocomposites synthesis procedure and identify optimal working conditions for actual use.
7. Conclusion
- (1)
The addition of graphene to AA7075-graphene nanocomposites increased their hardness and tensile strength in several ways.
- (2)
The formation of a graphene-rich layer at the tri-surface is responsible for the decrease in wear rate and COF observed in the AA7075-graphene nanocomposites.
- (3)
Graphene concentrations in AA7075 composites analysis and results show that COF reductions are numerically similar at much lower graphene levels in the AA7075 composites as the reinforcing phase when tested under the same circumstances. Comparing wear rates across different nanocomposites found minimal variation.
- (4)
The models developed to anticipate wear and friction in AA7075-graphene nanocomposites performed exceptionally well. An ANN (R2 = 0.9341, RMSE = 0.0273, MSE = 0.0009, and MAE = 0.0105) model providing the best forecasting for wear and GBM (R2 = 0.9472, RMSE = 0.0246, MSE = 0.0007, and MAE = 0.0105) while the decision tree (R2 = 0.9642, RMSE = 0.0367, MSE = 0.0013, and MAE = 0.0225) and RF (R2 = 0.9637, RMSE = 0.0375, MSE = 0.0014, and MAE = 0.0252).
- (5)
Using ML, COF’s most essential determinants were load, graphene content, and hardness. But the wear behavior of AA7075-graphene nanocomposites was most affected by graphene content, average load, and hardness.
Ethical Approval
All procedures performed in this study involving human participants were in accordance with the ethical standards of the institutional and/or national research committee and its later amendments or comparable ethical standards.
Conflicts of Interest
The authors declare that they have no conflicts of interest.
Open Research
Data Availability
All data supporting the findings of this study are included in this article.


