[Retracted] Evaluation and Analysis of Assisted Instruction and Ability Improvement Based on Artificial Intelligence
Abstract
Teachers are a very important part of university education. They have the responsibility of teaching and educating people, and it is also their unshakable responsibility to train all-round talents for the country. If we want to improve students’ quality, we must improve teachers’ teaching quality and pay attention to the research of teachers’ teaching ability. This paper analyzes the connotation of artificial intelligence-assisted instruction. Then, Bayesian active learning modeling is used. This paper mainly adopts the way of questionnaire and empirical research methods and launches a basic investigation on the teaching ability of university teachers. Through investigation, the following problems are summarized: (1) insufficient self-knowledge reserve and weak teaching theoretical foundation and (2) inaccurate orientation of teaching objectives and single teaching methods. Schools need to enrich training methods, establish multiple effective mechanisms for evaluation, meet the basic requirements of each teacher, and play the role of inspiring teachers. As for teachers, they need to have a good attitude, be full of interest in teaching and educating people, have a strong sense of responsibility, and constantly improve themselves and improve themselves.
1. Introduction
This paper emphasizes the importance of task environment as the decisive factor of agent proper design. The work of artificial intelligence is explained by the definition of intelligent agent and its functions in production system, reactive agent, real-time conditional planner, neural network, and rich decision system [1]. How teachers’ ability will directly affect the cultivation of students. Therefore, in order to cultivate innovative talents, teachers should improve their teaching level and teaching ability [2]. Constrained programming is a powerful paradigm for solving combinatorial search problems, which absorbs a wide range of technologies from artificial intelligence, computer science, databases, programming languages, and operational research. Based on constrained programming, the manual provides a fairly comprehensive coverage of work in all these areas, enabling readers to have a fairly accurate concept of the whole field and its potential [3]. This paper is mainly aimed at advanced undergraduates who want to engage in Bayesian network technology and computer science. The first is what I call practitioners. Practitioners are interested in learning sufficient material on the subject to be able to assist domain experts in building Bayesian network systems [4]. Information teaching has new requirements for teachers. This paper analyzes the practical guidance, teaching reflection, and other aspects and gives which aspects to train teachers from [5]. This book shows that most of the ideas behind intelligent systems are simple and clear, and the methods used in the book have been widely tested through several courses provided by the author. The book introduces the field of computer intelligence. In university settings, this book can be used as an introductory course for computer science, information systems, or engineering departments [6]. This paper explains how matrix theory appears and effectively participates in a process and has a feasible application in game theory. Matrix technology shows itself to be essential, and their introduction can provide us with a simple and accurate method to find solutions [7]. This book emphasizes the importance of task environment as the decisive factor of agent proper design, interprets agent learning as expanding programmer’s scope in unknown environment, and shows how this role limits its design, which is beneficial to the representation of knowledge and explanatory reasoning [8]. In this paper, we review the extensive research on time representation and reasoning without focusing on any specific applications. We outline the basic problems, methods, and results in these two fields and summarize the latest developments in related fields [9]. This paper introduces the application of finite element analysis software ANSYS buckling analysis in the teaching of material mechanics. The advanced CAE method makes the column stable and makes full use of computer simulation means to make up for the lack of practice and improve students’ knowledge level [10]. This paper uses neural network technology to build a teaching quality evaluation model. On the basis of introducing the neural network model and teaching quality evaluation, the paper also verifies its effect, and the results are almost the same as expected. Finally, the information processing in teaching evaluation is discussed [11]. With the development of the times, it is more and more common to add computer technology in the teaching process. This paper presents an online intelligent diagnosis and evaluation scheme based on J2EE. As an auxiliary teaching algorithm, the system has many functions such as teaching, diagnosis, testing, and feedback through automatic modification of subjective and objective questions and personalized design of diagnosis results [12]. In the past decade, many computer-based interactive physics programs have emerged at the university level. This paper considers one such project, the Cognitive and Emotional Results Studio Physics Program, which integrates the initial implementation of the unified physics learning environment [13]. This article, through the teacher’s trial lesson for video, let all the participants to evaluate and then put forward the teaching methods need to improve the place. The results show that their teaching ability has been improved and they have learned new teaching methods [14]. The application of electronic card in student escort is to design and build a system based on Arduino Uno microcontroller and RFID module. The system is expected to facilitate lecturers to check attendance, reduce students’ habit of checking attendance, and increase the use intensity of student identification cards [15].
2. Connotation of Artificial Intelligence-Assisted Instruction
2.1. Help the Common Improvement of Machine Intelligence and Human Intelligence
In the era of artificial intelligence, machine teaching is more flexible and humanized in technology, which can effectively improve the learning ability of teachers and students. Under the future educational situation, the symbiotic evolution of man and machine will become the inevitable trend of the combination of artificial intelligence and education, and the intelligent evolution of teaching machines will certainly contribute to human understanding of nature and people. With the in-depth development of knowledge transfer, interaction, and knowledge sharing among teachers, teachers and students, and students, massive knowledge, behavioral data, teaching tasks, and cases are spreading into the infinite wisdom sharing system, becoming the original floating force for continuous intelligent learning. At the same time, the highly intelligent teaching machine is constantly updating the comprehensive accumulation of human wisdom, using comprehensive wisdom and big data to break the blind spot of human thinking, generating a large number of new information that is difficult to extract by traditional methods, and providing it to teachers and students. Learning machines also use data storage capacity to enhance the depth and breadth of memory, improve the science and technology-art interaction between teachers and students through man-machine dialogue, support decision-making, improve the efficiency and effect of teacher education management, and expand widely the wisdom and skills of teachers and students.
2.2. Break the Dualism of Subject and Object of Education
In the era of artificial intelligence, the traditional connotation of machines has changed. First of all, machine-assisted training supported by teaching machines has become an important part of teaching and education, which almost penetrates into all directions of the training process. Intelligent machines have more and more human abilities through experiential learning and teacher feedback. Teachers and machines become each other’s topics and objects in the process of education, and they coexist and develop harmoniously. Second, in the era of artificial intelligence, machine-assisted training retains the characteristics of resource carrier and computer-assisted, but with the improvement of intelligence level, machines have become teachers, and the characteristics of resources have weakened and the subjective components have increased. Machines do most of the work for human teachers, so it is difficult for students to feel the difference between real teachers and machine teachers. Third, technological innovation accelerates man-machine integration. The communication between people and machines has become smoother. Machines can provide people with arithmetic and memory support and give people the ability to think and act that they could not do before.
2.3. Promote the Cooperation and Integration of Teachers, Machines, and Students
Machine-assisted instruction in the era of artificial intelligence is dedicated to building a paradigm connecting teachers, machines, and students, emphasizing the cooperation and evolution among teachers, machines, and students, and promoting man-machine integration and teaching. In contrast, human teachers are more experienced in teaching and problem-solving. At the same time, people’s advanced characteristics such as abstract thinking, logical reasoning, and learning have strong adaptability and adaptability to educational scenes, which is conducive to teaching interaction and enhances learning effect. Massive data storage, calculation, retrieval, and other functions of intelligent machines can help teachers quickly process and analyze data and perform many complex tasks on their behalf. Students who use intelligent teaching machines can get accurate personalized services, and students’ feedback data can also support the improvement of machine-assisted functions. In the era of artificial intelligence, machine-assisted education combines the interests of teachers and machine students. Human intelligence and intelligent machines capable of dichotomy, mutual adaptation, and spiral coevolution realize social cooperation. Training methods can also undergo qualitative changes.
3. Active Learning Modeling of Bayesian Extreme Learning Machine
3.1. Bayesian Extreme Learning Machine Modeling Method
3.1.1. Extreme Learning Machine
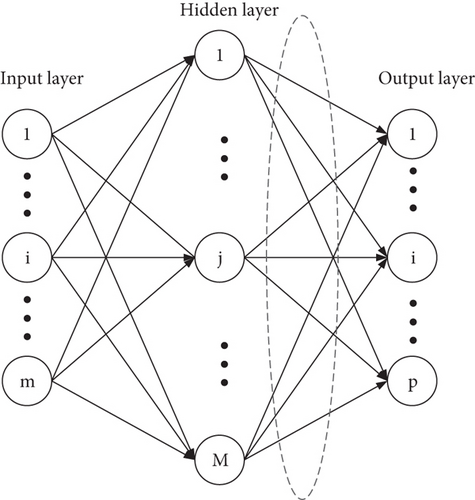
3.1.2. Bayesian Extreme Learning Machine
3.2. Active Learning Methods
3.2.1. Definition of Global Variance Change
3.2.2. Sample Selection Strategy of Bayesian Extreme Learning Machine
The generalization performance of the model is maximized by using formula (23).
3.2.3. Modeling Process
According to the updated XL, XU, and Sn after iteration, sample evaluation is carried out again by using formula (23), and new unlabeled samples are selected. When the number of selected unlabeled samples reaches a preset ns, ns unlabeled samples selected in the iteration process are labeled in batches, and BELM model parameters are reoptimized, and a new soft sensing model is established at the same time.
4. Experimental Analysis
4.1. Teachers’ Needs in the Application Environment of Multimedia Technology
4.1.1. Survey of Demand for Multimedia Facilities
Looking at Figures 2–4, we can draw that 94% of teachers said that they would encounter multimedia equipment failure in the teaching process. In the investigation of whether the equipment can meet the teaching needs, almost all teachers think that it can meet their teaching needs. Multimedia equipment is the basic material of artificial intelligence-assisted teaching. Schools should provide teachers with a good teaching environment to ensure the normal teaching.
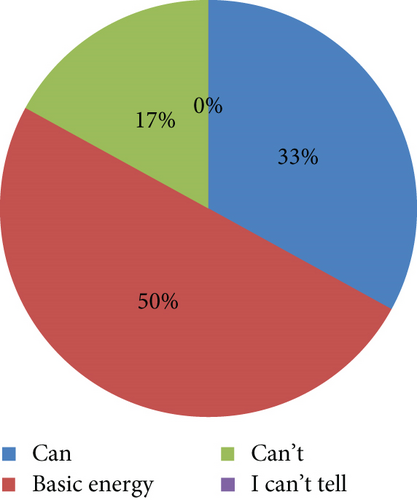
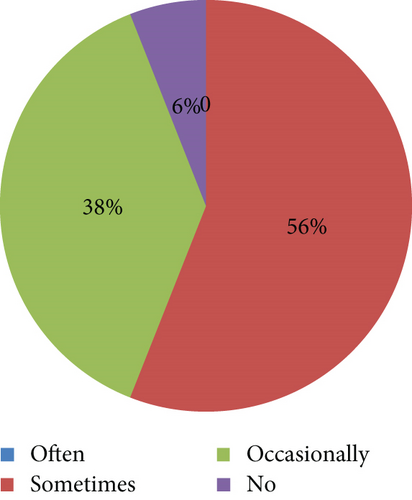
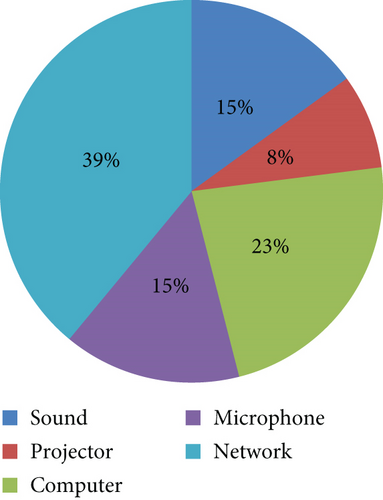
In the investigation of what aspects of multimedia equipment need to be improved, teachers put forward that the network environment, computer configuration, projector, microphone, and audio need to be optimized.
4.1.2. Investigation on Teachers’ Demand for Multimedia Technology
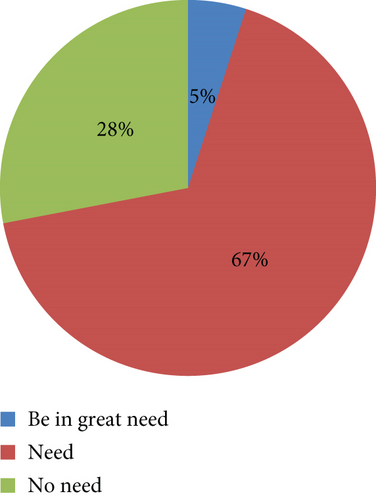
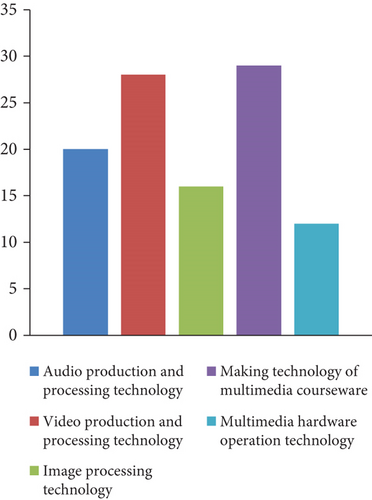
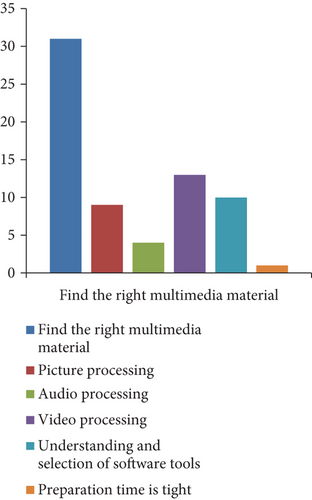
Through the data in Figures 5–7, we can know that most teachers are not confident in their multimedia technology and need to receive training.
4.1.3. Investigation on Teachers’ Sharing of Resources
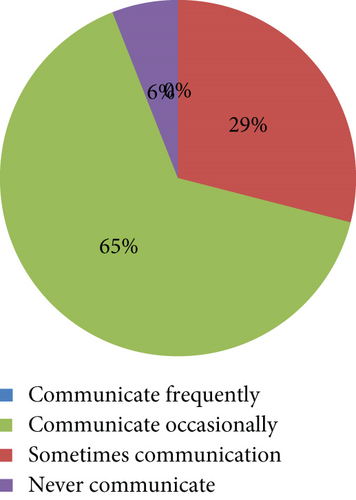
Observing the results in Figures 8 and 9, we can know that most teachers have little communication on courseware making, which is very unfavorable to the sharing of excellent teaching resources, and will lead to the reduction of teachers’ teaching efficiency. In the same courseware making process, if teachers communicate more, they will save a lot and effectively improve courseware making.
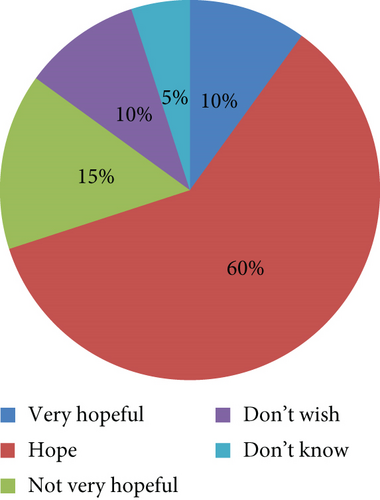
In the investigation of resource sharing, most teachers still hope to share resources, because sharing resources is related to the protection of teachers’ labor achievements, which can be solved by establishing courseware material resource library. Teachers can voluntarily upload the courseware they are willing to share to the resource library, which not only improves the efficiency of making courseware but also protects the success of teachers.
4.2. Subjects and Contents of the Survey
4.2.1. Validity Analysis of Pretest Questionnaire
Usually, we judge whether a data is suitable for factor analysis according to KMO value and Bartlett spherical test.
Using this analysis method, the results are shown in Table 1.
| Kaiser-Meyer-Olkin metric with sufficient sampling | 0.854 | |
|---|---|---|
| Bartlett’s sphericity test | Approximate chi-square | 4222.902 |
| Df | 946 | |
| Sig. | 0 | |
From the data obtained in Table 1, it can be found that the prequestionnaire structure is very good, which is especially suitable for factor analysis.
4.2.2. Reliability Analysis of Pretest Questionnaire
Whether the research results are stable or not is usually tested by reliability. According to this principle, the results in Table 2 are obtained:
| Scale name | Number of projects | Cronbach coefficient |
|---|---|---|
| Teaching cognitive ability | 7 | 0.818 |
| Instructional design ability | 14 | 0.806 |
| Teaching implementation ability | 9 | 0.783 |
| Teaching reflection ability | 7 | 0.72 |
| Teaching research ability | 7 | 0.842 |
| Total amount table | 44 | 0.912 |
Looking at Table 2, we can conclude that the questionnaire is very trustworthy and has very high internal consistency, which can be carried out as a formal questionnaire.
4.2.3. Investigation and Analysis of Measured Questionnaires
After we preinvestigated the questionnaire in the previous section, we can start the formal questionnaire survey. This time, the method of sampling survey was selected, as shown in Table 3.
| School name | Survey sample | Questionnaire recovery number | Recovery rate |
|---|---|---|---|
| Heilongjiang University | 40 | 35 | 88% |
| Harbin Normal University | 43 | 43 | 100% |
| Jiamusi University | 50 | 48 | 96% |
| Harbin Engineering University | 46 | 41 | 89% |
| Harbin University of Commerce | 40 | 38 | 95% |
| Qiqihar University | 41 | 41 | 100% |
| Overall | 260 | 246 | 95% |
In order to verify whether the presupposition theory is reasonable, we carried out factor analysis in Table 4.
| KMO value | Bartlett’s sphericity test | |
|---|---|---|
| Subscale 1: teaching cognitive ability | 0.799 | 0 |
| Subscale 2: instructional design ability | 0.88 | 0 |
| Subscale 3: teaching implementation ability | 0.821 | 0 |
| Subscale 4: teaching reflection ability | 0.825 | 0 |
| Subscale 5: teaching research ability | 0.84 | 0 |
| Total amount table | 0.895 | 0 |
The results in Table 3 show that the questionnaires all meet the criteria of factor analysis.
Factor analysis is performed on each data, and the results are shown in Table 5.
| Subscale name | Cumulative interpretation rate | Factor name | Behavior realization | Factor load |
|---|---|---|---|---|
| Subscale 1: teaching cognitive ability | 67.15% | Self-cognition | B1 | 0.832 |
| B2 | 0.8 | |||
| B3 | 0.793 | |||
| B4 | 0.771 | |||
| Student cognition | B5 | 0.895 | ||
| B6 | 0.732 | |||
| B7 | 0.725 | |||
| Subscale 2: instructional design ability | 60.73% | Teaching objectives | B8 | 0.613 |
| B9 | 0.881 | |||
| B11 | 0.661 | |||
| Teaching structure | B12 | 0.677 | ||
| B13 | 0.751 | |||
| B14 | 0.753 | |||
| B15 | 0.784 | |||
| B16 | 0.753 | |||
| B17 | 0.571 | |||
| Teaching method | B19 | 0.797 | ||
| B20 | 0.733 | |||
| B21 | 0.699 | |||
| Subscale 3: teaching implementation ability | 65.12% | Transmit teaching information | B22 | 0.721 |
| B23 | 0.789 | |||
| B24 | 0.587 | |||
| Stimulate interest in learning | B25 | 0.621 | ||
| B26 | 0.785 | |||
| B30 | 0.621 | |||
| Classroom regulation | B27 | 0.789 | ||
| B28 | 0.799 | |||
| B29 | 0.621 | |||
| Subscale 4: teaching reflection ability | 67.59% | Self-reflection | B31 | 0.543 |
| B32 | 0.912 | |||
| Reflection on teaching activities | B33 | 0.558 | ||
| B34 | 0.863 | |||
| B35 | 0.755 | |||
| Subscale 5: teaching research ability | 74.59% | Teaching theory research | B39 | 0.867 |
| B40 | 0.856 | |||
| B41 | 0.799 | |||
| Teaching practice research | B42 | 0.658 | ||
| B43 | 0.845 | |||
| B44 | 0.809 |
Then, the reliability analysis of the questionnaire is carried out, and the results are shown in Table 6:
| Scale name | Number of projects | Cronbach coefficient |
|---|---|---|
| Subscale 1: teaching cognition | 7 | 0.819 |
| Self-cognition | 4 | 0.837 |
| Student cognition | 3 | 0.734 |
| Subscale 2: instructional design | 12 | 0.875 |
| Teaching objectives | 3 | 0.714 |
| Teaching structure | 6 | 0.852 |
| Teaching method | 3 | 0.723 |
| Subscale 3: teaching implementation | 9 | 0.809 |
| Transmit teaching information | 3 | 0.618 |
| Stimulate interest in learning | 3 | 0.7 |
| Classroom regulation | 3 | 0.745 |
| Subscale 4: teaching reflection | 5 | 0.758 |
| Self-reflection | 2 | 0.602 |
| Reflection on teaching activities | 3 | 0.699 |
| Subscale 5: teaching research | 6 | 0.886 |
| Teaching theory research | 3 | 0.865 |
| Teaching practice research | 3 | 0.765 |
| Total amount table | 39 | 0.935 |
Looking at Table 6, we can conclude that the reliability of the data is very good, and we can continue the next research.
4.3. Analysis of Survey Results
4.3.1. Analysis of Demographic Variables
Looking at Tables 7 and 8, we can conclude that most teachers are stressed, and only a small part are not stressed.
| Background disguise | Frequency (person) | Percentage (%) | |
|---|---|---|---|
| Gender | Male | 85 | 34.6 |
| Woman | 161 | 65.4 | |
| Graduate of Fan College | Yes | 101 | 41.1 |
| No | 145 | 58.9 | |
| Age | Under 30 years old | 74 | 30.1 |
| 31-35 years old | 95 | 38.6 | |
| 36-40 years old | 77 | 31.3 | |
| Teaching experience | Less than one year | 50 | 20.3 |
| 2-3 years | 69 | 28 | |
| 4-5 years | 22 | 8.9 | |
| Over 5 years | 105 | 42.7 | |
| Educational background | College and below | 0 | 0 |
| Undergraduate | 14 | 5.7 | |
| Master graduate student | 125 | 50.8 | |
| Doctoral students | 107 | 43.5 | |
| Professional title | Teaching assistants | 31 | 12.6 |
| Lecturer | 143 | 58.1 | |
| Associate professor | 44 | 17.9 | |
| Teachers | 28 | 11.4 | |
| Type of institution | Double first-class universities and colleges | 86 | 34.9 |
| Double first-class colleges and universities | 83 | 33.7 | |
| Nondual institutions | 91 | 31.4 | |
| Frequency | Percentage | Effective percentage | ||
|---|---|---|---|---|
| Effective | Very large | 50 | 20.3 | 20.3 |
| Larger | 99 | 40.2 | 40.2 | |
| General | 85 | 34.6 | 34.6 | |
| Less | 4 | 1.6 | 1.6 | |
| No | 8 | 3.3 | 3.3 | |
| Total | 246 | 100 | 100 | |
From Table 9, we can conclude that most people choose the profession of teachers because it is more stable than other industries, and only a few people are forced to choose the profession of teachers because of professional problems.
| Frequency | Percentage | Effective percentage | ||
|---|---|---|---|---|
| Effective | Personal interest | 62 | 25.2 | 25.2 |
| The wishes of parents and others | 53 | 21.5 | 21.5 | |
| Professional restriction | 28 | 11.4 | 11.4 | |
| The occupation is relatively stable | 103 | 41.9 | 41.9 | |
| Total | 246 | 100 | 100 | |
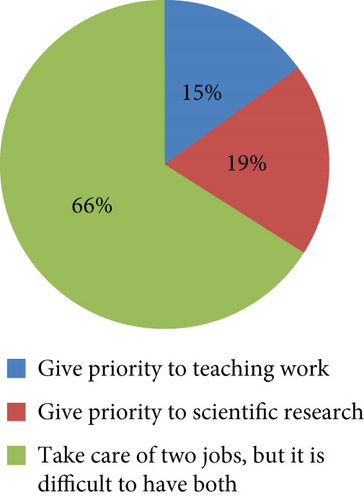
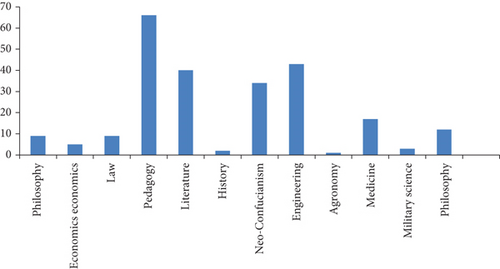
Looking at Figures 10 and 11, we can find that most teachers still choose both scientific research and teaching, so we can know that weighing the direct weight of the two is a big problem for teachers.
4.3.2. Analysis of the Overall Situation of Teachers’ Teaching Ability
Through descriptive analysis of teachers’ teaching ability, we get Table 10.
| Sample size | Maximum value | Minimum value | Average | Standard deviation | |
|---|---|---|---|---|---|
| Subscale 1: teaching cognition ability | 246 | 1 | 3 | 2.4123 | 0.36967 |
| Self-cognition | 246 | 1 | 3 | 2.3325 | 0.43911 |
| Student cognition | 246 | 1 | 3 | 2.5786 | 0.42901 |
| Subscale 2: instructional design ability | 246 | 1 | 3 | 2.5843 | 0.35199 |
| Teaching objectives | 246 | 1 | 3 | 2.4702 | 0.44033 |
| Teaching structure | 246 | 1 | 3 | 2.6463 | 0.38632 |
| Teaching method | 246 | 1 | 3 | 2.4255 | 0.42336 |
| Subscale 3: teaching implementation ability | 246 | 1 | 3 | 2.3785 | 0.38577 |
| Transmit teaching information | 246 | 1 | 3 | 2.5542 | 0.42217 |
| Stimulate interest in learning | 246 | 1 | 3 | 2.1667 | 0.52748 |
| Classroom regulation | 246 | 1 | 3 | 2.0146 | 0.49366 |
| Subscale 4: teaching reflection ability | 246 | 1 | 3 | 2.4236 | 0.42147 |
| Self-reflection | 246 | 1 | 3 | 2.4472 | 0.51035 |
| Reflection on teaching activities | 246 | 1 | 3 | 2.3058 | 0.44635 |
| Subscale 5: teaching research ability | 246 | 1 | 3 | 2.0935 | 0.55661 |
| Teaching theory research | 246 | 1 | 3 | 1.9702 | 0.66121 |
| Teaching practice research | 246 | 1 | 3 | 2.2168 | 0.5714 |
| Total amount table | 246 | 1 | 3 | 2.4128 | 0.31983 |
From the overall situation, it shows that teachers’ teaching ability is still very high. Only the low score of teaching theory shows that teachers’ cognition in this aspect is not enough and needs to be improved.
4.3.3. Difference Analysis under Different Variables
Differences between genders are as follows.
Table 11 shows that the gender differences make teachers have obvious scores in teaching ability. Among them, the differences in instructional design are mainly reflected in the design and selection of teaching methods. The differences in teaching implementation are mainly reflected in the adjustment and control of classroom, the differences in teaching reflection are mainly reflected in teachers’ self-reflection and reflection on teaching activities, and the differences in teaching research are mainly reflected in teachers’ theoretical research.
| F | Sig. | T value | Degree of freedom | Significance (bilateral) | Mean difference | ||
|---|---|---|---|---|---|---|---|
| Subscale 1: teaching cognition ability | Assuming methods are equal | 1.067 | 0.303 | 1.162 | 244 | 0.247 | 0.4027 |
| Assuming methods are not equal | 1.155 | 168.303 | 0.25 | 0.4027 | |||
| Subscale 2: instructional design ability | Assuming methods are equal | 0.776 | 0.379 | -0.603 | 244 | 0.547 | -0.3422 |
| Assuming methods are not equal | -0.594 | 163.404 | 0.554 | -0.3422 | |||
| Method design | Assuming methods are equal | 7.795 | 0.006 | -1.856 | 244 | 0.065 | -0.3145 |
| Assuming methods are not equal | -1.688 | 132.324 | 0.094 | -0.3145 | |||
| Subscale 3: teaching implementation ability | Assuming methods are equal | 2.37 | 0.125 | -1.22 | 244 | 0.224 | -0.56719 |
| Assuming methods are not equal | -1.172 | 153.196 | 0.243 | -0.56719 | |||
| Classroom regulation | Assuming methods are equal | 5.171 | 0.024 | -1.979 | 244 | 0.049 | -0.39065 |
| Assuming methods are not equal | -1.847 | 141.576 | 0.067 | -0.39065 | |||
| Subscale 4: teaching reflection ability | Assuming methods are equal | 8.481 | 0.004 | -3.036 | 244 | 0.003 | -0.8437 |
| Assuming methods are not equal | -2.818 | 139.519 | 0.006 | -0.8437 | |||
| Self-reflection | Assuming methods are equal | 9.944 | 0.002 | -2.389 | 244 | 0.018 | -0.32386 |
| Assuming methods are not equal | -2.231 | 141.83 | 0.027 | -0.32386 | |||
| Reflection on teaching activities | Assuming methods are equal | 7.223 | 0.008 | -2.94 | 244 | 0.004 | -0.51984 |
| Assuming methods are not equal | -2.779 | 146.355 | 0.006 | -0.51984 | |||
| Subscale 5: teaching research ability | Assuming methods are equal | 2.485 | 0.116 | -1.072 | 244 | 0.285 | -0.47965 |
| Assuming methods are not equal | -1.026 | 151.827 | 0.306 | -0.47965 | |||
| Theoretical research | Assuming methods are equal | 5.532 | 0.019 | -0.567 | 244 | 0.571 | -0.15097 |
| Assuming methods are not equal | -0.544 | 152.724 | 0.587 | -0.15097 | |||
| Total amount table | Assuming methods are equal | 2.184 | 0.141 | -1.095 | 244 | 0.275 | -1.83003 |
| Assuming methods are not equal | -1.063 | 157.428 | 0.29 | -1.83003 | |||
4.3.4. Differences between Different Educational Backgrounds
Observing Table 12 shows that teachers with different educational backgrounds are different in all aspects, and the main difference is reflected in cognition.
| F | Sig. | T value | Degree of freedom | Significance (bilateral) | Mean difference | ||
|---|---|---|---|---|---|---|---|
| Subscale 1: teaching cognition ability | Assuming methods are equal | 16.079 | 0 | 3.837 | 244 | 0 | 1.25224 |
| Assuming methods are not equal | 4.008 | 240.781 | 0 | 1.25224 | |||
| Self-cognition | Assuming methods are equal | 7.43 | 0.007 | 3.939 | 244 | 0 | 0.87115 |
| Assuming methods are not equal | 4.028 | 230.799 | 0 | 0.87115 | |||
| Student cognition | Assuming methods are equal | 13.454 | 0 | 2.305 | 244 | 0.022 | 0.38109 |
| Assuming methods are not equal | 2.389 | 237.764 | 0.018 | 0.38109 | |||
| Subscale 2: instructional design ability | Assuming methods are equal | 10.159 | 0.002 | 4.382 | 244 | 0 | 2.31417 |
| Assuming methods are not equal | 4.603 | 242.414 | 0 | 2.31417 | |||
| Goal design | Assuming methods are equal | 4.575 | 0.033 | 3.046 | 244 | 0.003 | 0.51287 |
| Assuming methods are not equal | 3.144 | 235.879 | 0.002 | 0.51287 | |||
| Process design | Assuming methods are equal | 6.344 | 0.012 | 3.688 | 244 | 0 | 1.08037 |
| Assuming methods are not equal | 3.841 | 239.831 | 0 | 1.08037 | |||
| Method design | Assuming methods are equal | 4.027 | 0.046 | 2.483 | 244 | 0.014 | 0.40451 |
| Assuming methods are not equal | 2.587 | 239.835 | 0.01 | 0.40451 | |||
| Subscale 3: teaching implementation ability | Assuming methods are equal | 0.451 | 0.503 | 5.178 | 244 | 0 | 2.21632 |
| Assuming methods are not equal | 5.293 | 230.474 | 0 | 2.21632 | |||
| Teaching information rack transmission | Assuming methods are equal | 15.271 | 0 | 3.791 | 244 | 0 | 0.60601 |
| Assuming methods are not equal | 3.945 | 239.387 | 0 | 0.60601 | |||
| Subscale 4: teaching reflection ability | Assuming methods are equal | 2.834 | 0.094 | 5.484 | 244 | 0 | 1.41605 |
| Assuming methods are not equal | 5.678 | 237.322 | 0 | 1.41605 | |||
| Reflection on teaching activities | Assuming methods are equal | 8.389 | 0.004 | 5.262 | 244 | 0 | 0.86719 |
| Assuming methods are not equal | 5.482 | 239.889 | 0 | 0.86719 | |||
| Subscale 5: teaching research ability | Assuming methods are equal | 1.775 | 0.184 | 4.662 | 244 | 0 | 1.93745 |
| Assuming methods are not equal | 4.62 | 208.361 | 0 | 1.93745 | |||
| Theoretical research | Assuming methods are equal | 0.034 | 0.853 | 4.626 | 244 | 0 | 1.14278 |
| Assuming methods are not equal | 4.636 | 216.78 | 0 | 1.14278 | |||
| Total amount table | Assuming methods are equal | 1.672 | 0.197 | 6.048 | 244 | 0 | 9.13622 |
| Assuming methods are not equal | 6.243 | 235.856 | 0 | 9.13622 | |||
According to the above research, we can conclude that there are significant differences in gender, graduation from normal colleges, professional titles, teaching years, and work pressure, which shows that these factors have certain influence on the improvement of teachers’ teaching ability. Therefore, schools should consider the above factors in the selection and training of teachers, including the cultivation and promotion of teaching ability.
5. Concluding Remarks
The educational level of school teachers will directly affect the educational quality of school staff and will also affect the employment and future development of students. It is a very important subject to improve the teaching ability of college teachers at present. This study mainly focuses on improving teachers’ teaching ability. Based on the actual situation of teachers in colleges and universities, through questionnaire survey, personal interview, and data collection, we can understand the first-hand information of teachers’ training and summarize the present situation. Based on the relevant literature, this paper analyzes the factors affecting the improvement of young college teachers’ teaching ability from the aspects of education administration, schools, and teachers and puts forward corresponding development strategies. The purpose of this paper is to find an effective way to improve the teaching ability of college teachers and then improve the quality of personnel training and help the progress of education.
Conflicts of Interest
The authors declared that they have no conflicts of interest regarding this work.
Open Research
Data Availability
The experimental data used to support the findings of this study are available from the corresponding author upon request.


