Static and Dynamic Characteristics of Steel-Concrete Composite Track Beam of Straddle Monorail with Cluster-Distributed Studs
Abstract
Because the transportation mode of straddle monorail is that the vehicle runs in the state of hugging the track, its track beam is usually a narrow-high cross section. In order to study the static and dynamic characteristics and variation law of prefabricated steel-concrete composite beam of straddle monorail with “cluster-distributed studs” (CDS), a full bridge test model with a scale ratio of 1 : 3 was made. Relevant theoretical analysis, numerical simulation, and model test were carried out, and the data of structural frequency and damping, load-deflection curve, and section height-strain curve were obtained. The results show the following: (1) the equivalent vertical bending stiffness of the composite track beam of straddle monorail is nonlinear. The greater the load, the faster the stiffness decrease, and the greater the difference with the theory of composite beam with “uniformly distributed studs” (UDS). (2) At the same section, the deformation of steel beam and concrete slab is not coordinated along the height direction. The strain value of concrete slab is significantly larger than that of the upper edge of steel beam, so it is difficult to apply the plane-section assumption. (3) Compared with all the measured results of the track beam test, the results of the detailed shell-solid FEM model based on the load-slip curve obtained by push-out test are close to them, and the maximum error is 11.4% difference in stress. (4) Compared with the results obtained by the theoretical formula of the UDS, the results obtained by the theoretical formulas of the CDS based on a “correction coefficient of vertical bending stiffness” proposed in this paper show less deviation comparing to the measured results of the track beam test and are more resilient. When the correction coefficient is 0.9, the maximum error is 23.8% difference in stress. In the design of this kind of structure, the proposed formula can be used for early scheme comparison and later size optimization. Compared with the detailed shell-solid FEM model, the proposed formula significantly reduces the design workload.
1. Introduction
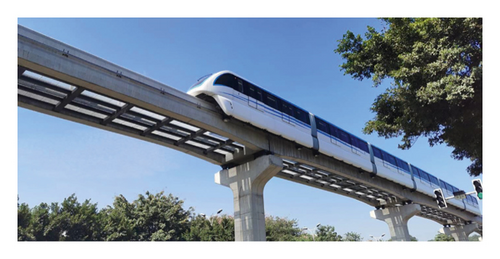
Developing rail transit is one of the main ways to solve urban traffic congestion and realize energy conservation and environmental protection. Subway construction has large investment (>600 million yuan per km), strong transportation capacity (>60,000 one-way person-times per hour), and high operation cost. It is mainly used in superlarge cities with concentrated passenger flow. For the majority of small- and medium-sized cities, it is difficult to meet the conditions of subway construction because of their small passenger flow demand and weak local finance. The medium-carrying-capacity rail transit, represented by the straddle monorail (Figure 1), can meet the passenger transport needs of small- and medium-sized cities, and its construction investment is only 1/3 to 1/4 of that of subway, so it is a reasonable choice of rail transit system [1–3]. The track beam of straddle monorail is not only the load-bearing structure of the monorail bridge, but also the track of the stabilizing wheel and running wheel of monorail vehicle, so the manufacturing precision of millimeter level is required. When using concrete beam, the construction technology requirements for the manufacturing and erection of track beam are very high. When using pure steel beam, there are large problems of vibration, noise, and weather resistance of running surface. When using the steel-concrete composite beam, the impact of the above problems can be effectively reduced. At present, the composite beam with “uniformly distributed studs” (UDS) as shown in Figure 2(a) is the main structural form, whose studs are relatively uniformly stressed. However, in order to realize the assembly construction, the concrete bridge deck needs to be divided into many blocks, and the wet joints and studs’ areas need a lot of on-site pouring, which will greatly increase the construction period. If the composite beam with “cluster-distributed studs” (CDS) in Figure 2(b) is adopted, it is convenient to prefabricate and assemble the bridge deck as a whole, which has the advantages of fast construction speed, good installation quality, and little influence on concrete shrinkage and creep, but its overall mechanical performance needs to be further studied.


For the composite beam with UDS in Figure 2(a), Nie et al. [4], Macorini et al. [5], Yu et al. [6], and Shao et al. [7] have carried out a large number of theoretical, simulative, and experimental studies. At present, there are still relatively few theoretical and experimental studies on the composite beam with CDS. Xu et al. [8] abstracted the composite beam as a beam model on elastic foundation and put forward an analytical formula for the longitudinal stiffness of uniformly distributed studs. Zhao et al. [9] determined the force sharing of different shear studs in the postpouring notch through push-out test. Based on numerical simulation and model test, Fan et al. [10] compared group nailing composite beams and cast-in-place composite beams and found that there were no significant differences in macroscopic constitutive curves and failure modes between them, but the former had larger slip and local stress. Fan et al. [10] compared the prefabricated composite beam and the cast-in-place composite beam based on numerical simulation and model test and found that there was no obvious difference between them in macroscopic constitutive curve and failure mode, but the slip and local stress of the former were larger. Wang [11] studied the influence of slip effect on the vehicle-bridge dynamic response of the suspended monorail steel-concrete composite track beam. Nie et al. [12], Cao et al. [13], and Zhu et al. [14] studied the long-term influence of slip on the macroscopic deformation and local stress of composite beams.
However, for the straddle monorail track beam, its beam width is a small fixed value (usually 690 mm). If the connection scheme of CDS is adopted, the reserved notch of concrete slab can only be a narrow size in transverse direction to avoid too much weakening of the slab section (Figure 2(c)). In order to ensure better force transmission effect of narrow notches, a scheme of interlaced arrangement of notches was proposed in this paper (Figure 2(b)). For the narrow-high beam of straddle monorail, the composite beam with CDS is different from the composite beam with UDS; the applicability of plane-section assumption and stiffness reduction of composite section need to be further studied [12, 15]. In order to clarify the static and dynamic characteristics of prefabricated steel-concrete composite track beam with CDS, the frequency, deformation, and stress distribution of the beam were studied by theoretical formula, numerical simulation, and model test in this paper.
2. Theories and Methods
For the composite beams with UDS, the number of shear studs is relatively large, and the interface slip between steel and concrete is relatively small. Therefore, the theoretical formula of steel-concrete composite beams without interface slip [4, 16, 17] can be used to calculate the mechanical properties, such as vertical bending stiffness, natural vibration fundamental frequency, and stress between steel beam and concrete slab. For the composite beam of straddle monorail with CDS, the number of shear studs is relatively small, and the interface slip between steel and concrete is relatively large. Therefore, there will be some error when calculating by the theoretical formula without interface slip. When the error is large, it is necessary to make appropriate correction. In consequence, on the basis of introducing the theoretical formula of the composite beam with UDS, a concept of “correction coefficient of vertical bending stiffness” is proposed in the following section, which can be used to calculate the steel-concrete composite track beam with CDS.
2.1. Theoretical Formulas of Static and Dynamic Characteristics of Composite Beam with UDS
In (1), Eeq and Es are equivalent elastic modulus and steel elastic modulus, respectively.
In (2), Aeq, As, Ac, and Ec are equivalent section area, steel beam section area, concrete slab section area, and concrete elastic modulus, respectively.
In (4), Hs is the distance between the section centroid of steel beam and the top surface of concrete slab, and Hc is the distance between the section centroid of concrete slab and the top surface of concrete slab.
In (5), Ieq, Is, and Ic are the section inertia moments of steel-concrete equivalent section, steel beam, and concrete slab, respectively.
In (10), M and N are bending moment and axial force of section, respectively, and y is the distance between any position of section and its neutral axis.
2.2. Simplified Theoretical Formulas of Mechanical Characteristics of Composite Track Beam with CDS
There are some obvious areas without studs in the composite beam with CDS, which will obviously lead to steel-concrete bond failure and slip effect when the force is large. Therefore, the bending stiffness of the composite beam with CDS should be different from that of the composite beam with UDS, and a correction coefficient can be used to describe the influence of this difference simply and intuitively. At present, some related papers also use α to describe the stiffness reduction of the CDS composite beam, but it is difficult to determine the value of α by analytical method because of too many influence factors of α. These factors include the sectional form of composite beams, the macroscopic force of composite beams, the number and spacing of shear nails, the size and spacing of notches, the bonding force between steel plates and concrete slabs, the reinforcement ratio of concrete slabs, and the influence of shrinkage and creep of concrete slabs. Therefore, the main purpose of this paper is to determine the reasonable value of α of the kind of special narrow-high composite beam of straddle monorail by comparing the experimental value with the theoretical value.
In (13), α can be a constant value or a value that varies with the load after considering nonlinearity.
3. Experimental Procedure
3.1. Engineering Structure Parameters
- (1)
Span layout: the track beam is simply supported beam with 50 m span, and its center distance of longitudinal supports is 49.2 m.
- (2)
Cross section layout: the distance between centers of tracks is 4.6 m; the total height of the beam is 3.1 m; the total width of the single-line beam is 0.69 m; the height of the steel box beam is 2.78 m; and the thickness of concrete slab is 0.32 m.
- (3)
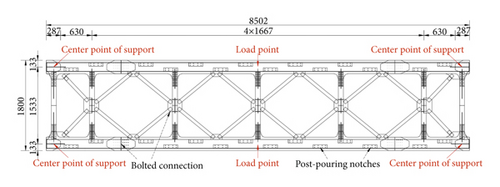
Plane layout: each reserved notch is 0.9 m in length, 0.21 m in width, 2.7 m in longitudinal center distance, and transversely interlaced.
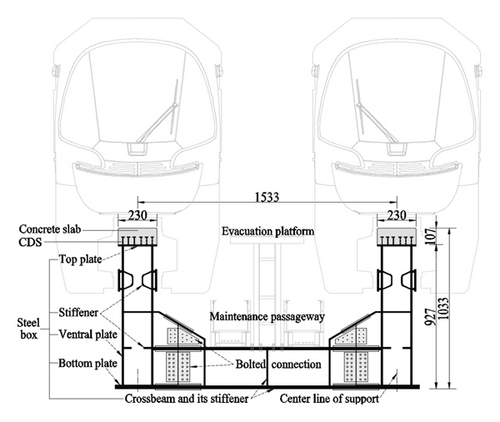
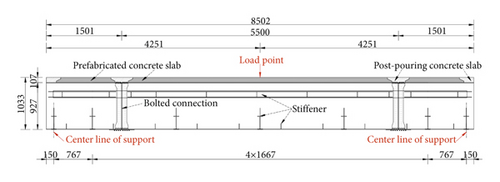
Limited by laboratory conditions, the composite beam was tested with a scale model in cross section. Under a certain longitudinal span, the actual situation can be simulated by adjusting the size of the load to achieve stress equivalence. As long as the stress state of the section produced by the scale model under the test load is consistent with that of the actual structure under the design code load, the results obtained can be considered to be similar to those of the real-life scenario. Based on the original parameters above, the size of test beam with a scale ratio of 1 : 3 is shown in Figure 3.
3.2. Detailed Finite Element Model
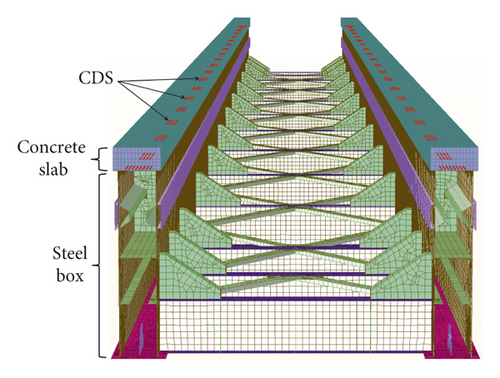
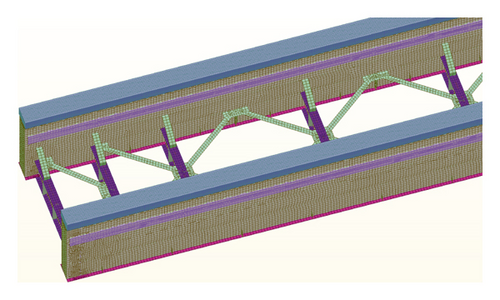
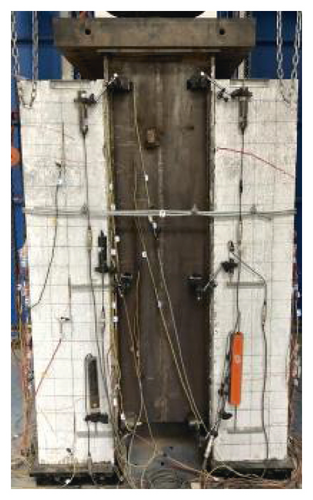
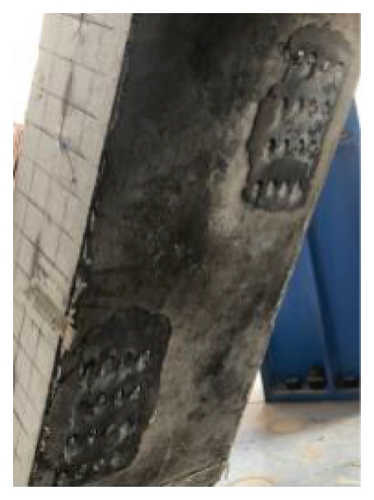
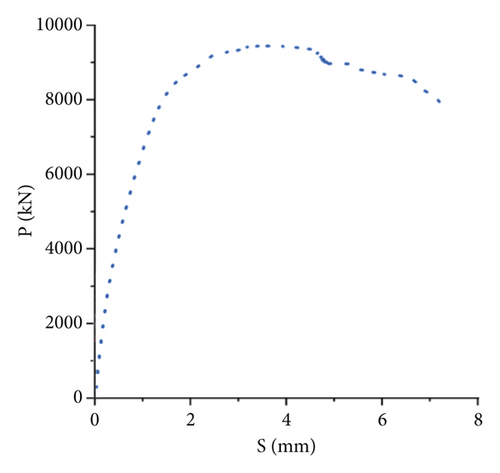
A detailed shell-solid FEM model of the test beam above was established by ANSYS. As shown in Figure 4, SOLID65 element was used for concrete, and SHELL181 element was used to model the main bearing plates, accessories, and ribbed stiffeners of all steel structures according to the actual size and position. The constitutive models of concrete slap and steel beam were elastic. Each stud was simulated by Combin39 nonlinear spring element in its actual position, and its load-slip curve was taken from the push-out test results in Figure 5. The test beam was divided into 165,000 solid elements and 197,556 shell elements in total.
3.3. Field Test Model before and after Assembly
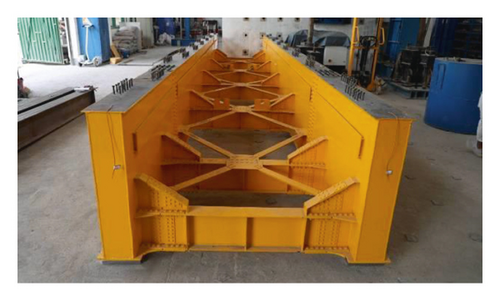
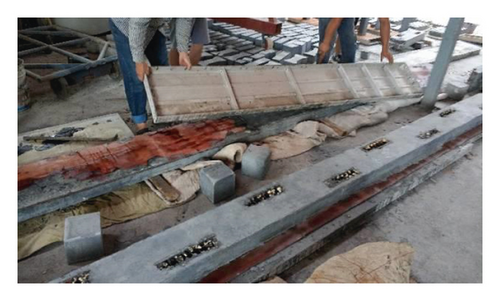
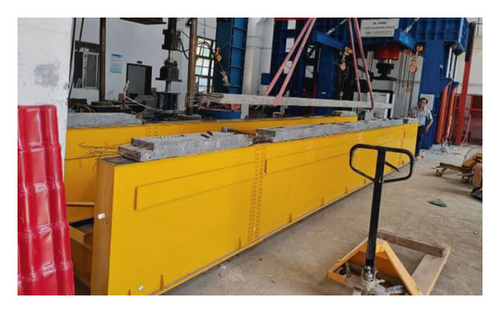
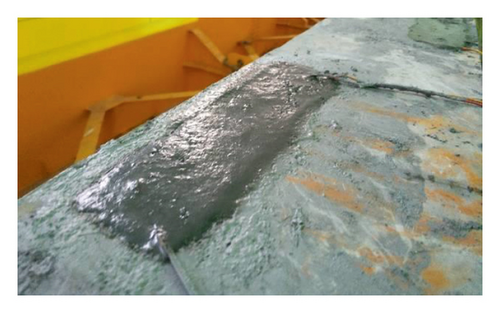
A field test model of the test beam above was made in the laboratory. The lower steel beam and the upper concrete slab of the test composite beam were precast respectively. The notches of the concrete slab were reserved and corresponded to the position of the CDS prewelded on the top surface of the steel beam. After all concrete slabs had been maintained and stored for three months, the slabs were hoisted to the steel beam and its notches were poured to realize the steel-concrete combination. The process of prefabrication and assembly of the test beam was shown in Figure 6.
3.4. Dynamic Test Scheme
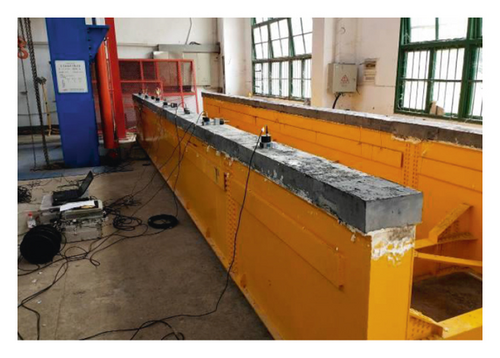
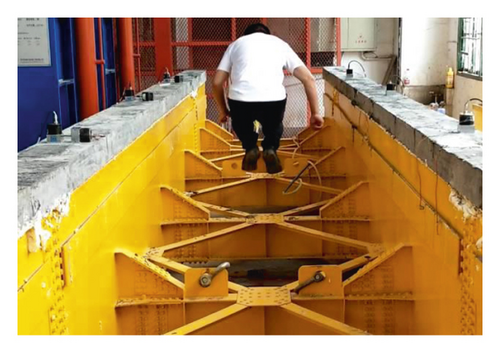
The test beam was placed on the flat ground of the laboratory. The bottom of each beam end was supported on the ground by a temporary roller support and a pin support, which could release the freedom of vertical bending of beam end to simulate the simply supported boundary condition. The sensors used in the test were vibration pickups (Figure 7(a)), and the sampling frequency was 1000 Hz. Because the test beam was very heavy and its loading position, space, and technology were limited, the beam was excited by person-jumping on the beam in this dynamic test (Figure 7(b)). When the vibration was excited to a certain extent, the person jumped off the beam, and then the free attenuation time-history curve of multiple points on the beam could be obtained. Then, the frequency and damping ratio of the test beam were obtained by free vibration method, which was mainly based on fast Fourier transform method [23, 24] and logarithmic decrement method [25, 26].
3.5. Static Test Scheme
As shown in Figure 8, the concentrated load was loaded on the upper edge of the mid-span section of the composite beam, and the load was increased step by step per 100 kN. The loading equipment was an electrohydraulic servo actuator, which adopted a control mode based on the value of the force, and the maximum load of 1000 kN could be loaded. In order to reduce the error caused by the friction between the testing machine and the beam, a roller support was used at the loading point.
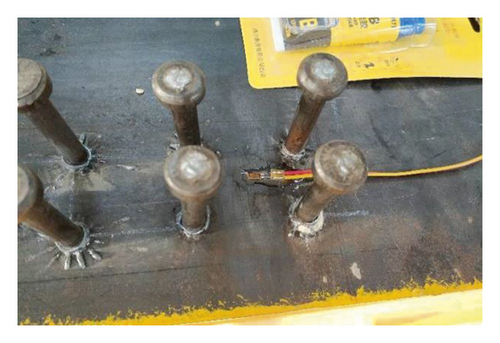
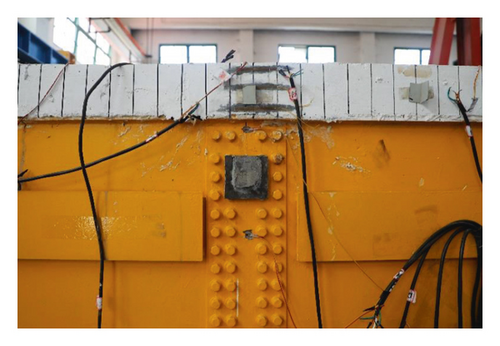
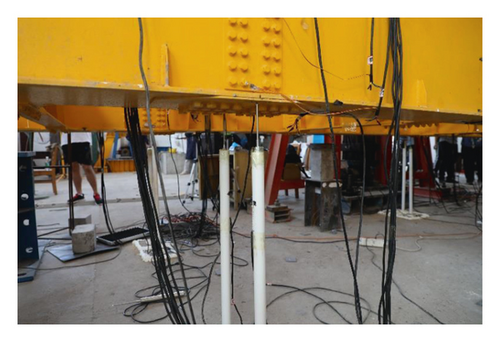
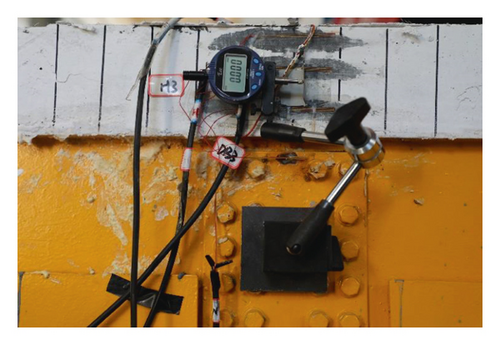
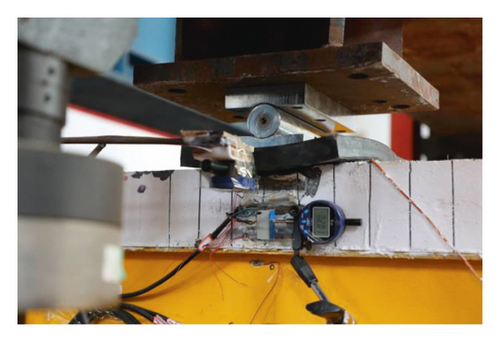
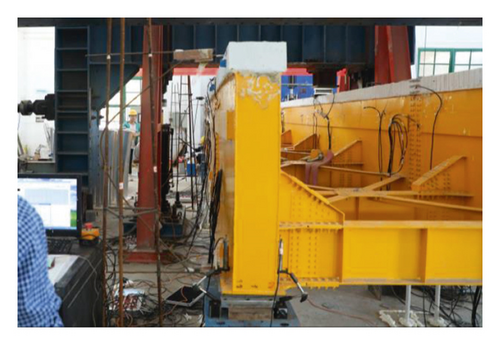
A number of sensors were set up between the concrete slab and the steel beam to measure their interface slip values at the middle of the span, the support, and the edge of reserved notch. Strain gauges were set at different heights of several sections of the test beam to obtain the strain data along the section height, which could be used to study the deformation coordination characteristic of steel beam and concrete slab on the same section. The contact displacement meters and micrometers were set at the bottom of the beam to test the vertical displacement of the bottom of the beam. The reading of the micrometers was used as the check of the measured values of the displacement meters. Along the length direction of the test beam, a total of 20 measuring points were arranged at the end, the quarter, and the middle of the span. The displacement meters had two ranges: 50 mm and 100 mm. The micrometers had two ranges: 12 mm and 25 mm, and their sensitivity values were 0.002 mm.
4. Results and Discussion
4.1. Results and Discussion of Dynamic Characteristics
The measured acceleration time-history curves and frequency spectrums of steel beam before assembly and composite beam after assembly were shown in Figures 9 and 10, respectively. The results showed that the time-history curve presented the “beat phenomenon.” After spectrum analysis based on fast Fourier transform, the first-order vertical bending natural frequencies of steel beam and composite beam were 29.9 Hz and 32.2 Hz, respectively.
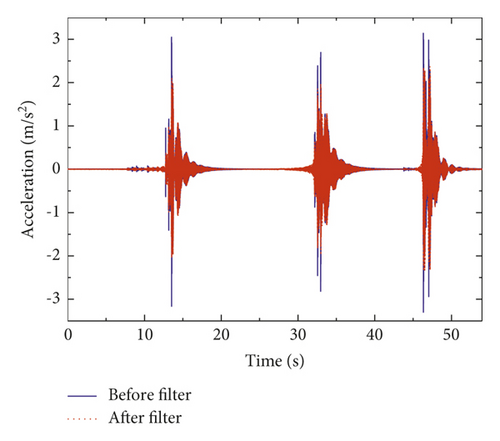
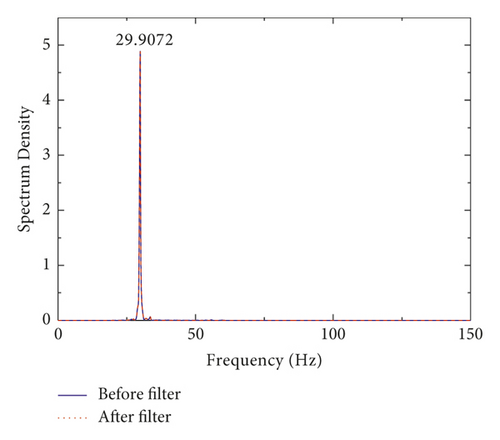
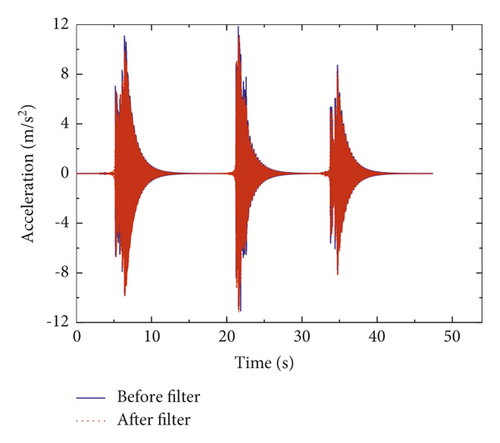
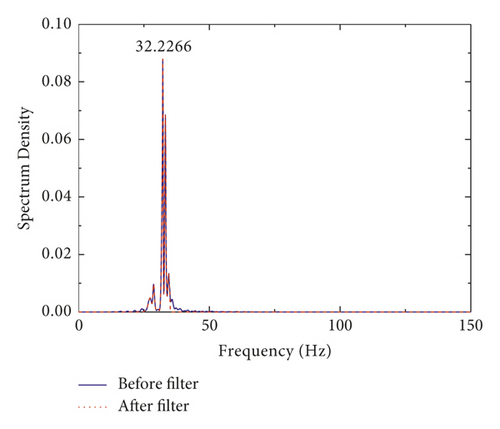
Table 1 showed the natural frequency results of vertical bending of steel beam and composite beam obtained by three different methods. The results showed the following: (1) because the steel beam was a regular steel structure, its measured frequency was very close to the FEM and theoretical frequency. (2) After the combination of concrete slab and steel beam, the overall vertical bending stiffness increased, but the overall mass also increased; the measured frequency of composite beam was 32.2 Hz, which was higher than that of steel beams 29.9 Hz. (3) The measured frequency of composite beam was higher than the FEM value, which was caused by the errors of structural nonlinearity and boundary conditions between the FEM simulation and the actual test; the excitation method of person-jumping could also bring some errors. (4) The measured frequency of composite beam was lower than the theoretical value because the theoretical formulas of composite beam with UDS were derived from the plane-section assumption, which assumed that there is no slip between steel and concrete in composite section; therefore, the nonlinear effect caused by CDS should not be considered, which led to the high theoretical frequency value.
| Measured frequency1 (Hz) | FEM frequency2 (Hz) | Theoretical frequency3 (Hz) | Measured damping ratio (%) | |
|---|---|---|---|---|
| Steel beam | 29.9 | 29.3 | 29.6 | 0.35 |
| Composite beam | 32.2 | 31.5 | 32.6 | 0.39 |
- 1The measured frequency was obtained by analyzing the measured data of the sensors. 2The FEM frequency was obtained by the finite element method. 3The theoretical frequency was obtained by the theoretical formulas of composite beam with UDS in Section 2.1.
At present, because the bond and friction effect of steel-concrete interface in the stud-free area is difficult to be simulated accurately, it is still difficult for FEM and analytical methods to accurately identify the damping ratio of the composite beam with CDS. Through the experimental measurement, the damping ratio of steel beam and composite beam was 0.35% and 0.39%, respectively. It could be seen that after combined with concrete slab, the overall damping of steel beam increased by 11.4%.
4.2. Results and Discussion of Static Characteristics
In the course of the test, there were no obvious cracks in the concrete slab during the loading stage from 0 kN to 600 kN, and the composite beam could maintain a good working condition at this stage. When loading from 650 kN to 700 kN, cracks gradually appeared at the loading point of the concrete slab. When the load reached 800 kN, the partial concrete at the loading point was crushed, and the maximum vertical displacement at the bottom of the beam reached 27.5 mm. Therefore, the failure mode of this structure is the crushing failure of concrete at the upper edge of the mid-span. However, because the test cracking load of 650 kN has reached 2 times of the equivalent actual design load, the safety of this structure is sufficient.
Under the action of lower load (100 and 200 kN), the measured strain of mid-span section of test composite beam and its corresponding relationship with equilibrium position were shown in Figure 11. The results showed the following: (1) the steel beam below the neutral axis was tensioned, and the steel beam and the concrete slab above the neutral axis was compressed; after converting to stress, the maximum tensile stress of steel beam was 73.5 MPa, and the maximum compressive stress of concrete slab was 13.8 MPa; both of steel beam and concrete slab were elastic deformation stage. (2) Below the neutral axis, the strain of steel beam basically showed a linear relationship along the direction of section height. (3) Above the neutral axis, the strain of concrete slab and steel beam were both nonlinear, and the strain of steel beam was 1.55 to 1.75 times that of concrete slab at the steel-concrete interface; as the deformation between steel beam and concrete slab was not coordinated, the plane-section assumption was no longer applicable even under lower load; therefore, there would be some error in calculating stress according to the theoretical formulas of composite beam with UDS in Section 2.1.
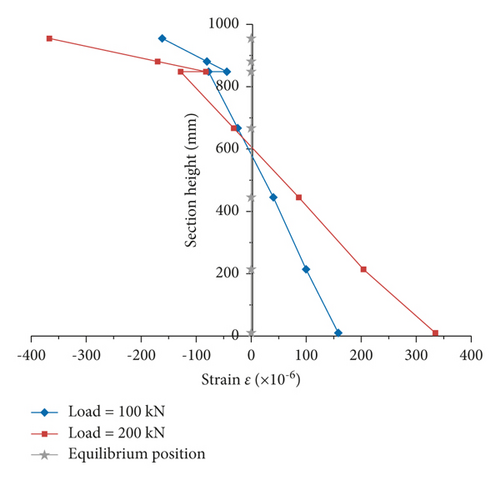
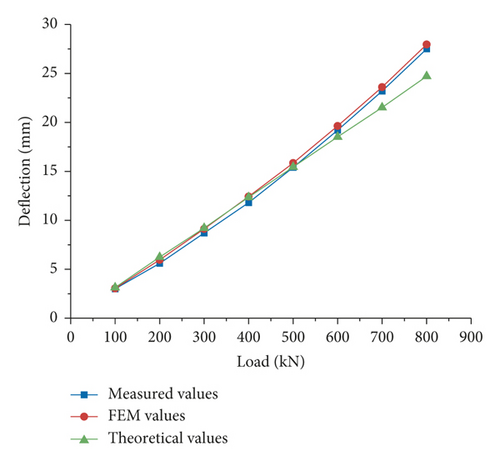
Figure 12 showed the curve of “load-maximum vertical deflection” of composite beam obtained by three different methods. The results showed the following: (1) the load-deflection curves of measured and FEM values were nonlinear, while the curve of theoretical values changed linearly. (2) The measured and FEM values were close to the theoretical values under small loads, but when the load was greater than 500 kN, the measured and FEM values were significantly greater than the theoretical values, which indicated that the nonlinear effect caused by CDS was significant. (3) The maximum errors of the FEM values relative to the measured values and the theoretical values relative to the measured values were 6.4% and 11.7%, respectively, which indicated that the FEM modeling results based on the load-slip curve obtained from the push-out test had high accuracy.
The comparison of equivalent bending stiffness between steel beam and composite beam was shown in Table 2. Because the pure steel beam was a structure with regular shape and single material, its stiffness could be accurately solved by finite element method and theoretical method. Therefore, the steel beam had not been loaded and measured in the actual test. In Table 2, the finite element value and theoretical value of the steel beam were directly used as the exact solution to compare with the experimental value. The results showed the following: (1) the measured values of composite beams were 35.9 to 29.1 kN/mm, which was about 110% to 90% of the theoretical value 32.5 kN/mm. (2) Combined with Figure 12, it could be seen that the equivalent bending stiffness of composite beam showed nonlinear characteristics with load changes, and its stiffness decreased faster with the increase of load. (3) The equivalent bending stiffness of composite beam was significantly larger than that of steel beam, and its theoretical value increased by 52%, which was mainly caused by the increase of section inertia moment after combination with concrete slab. (4) The measured equivalent vertical bending stiffness of the composite beam increased by 36% to 68% comparing to the steel beam, which reflected the comprehensive effect of the error of structural initial gap, the change of section inertia moment, the interface slip, and other factors.
| F/W | Measured value1 | FEM value2 | Theoretical value3 |
|---|---|---|---|
| Steel beam | — | 21.4 | 21.4 |
| Composite beam | 35.9∼29.1 | 33.6∼28.6 | 32.5 |
- 1The measured value was obtained by analyzing the measured data of the sensors. 2The FEM value was obtained by the finite element method. 3The theoretical value was obtained by the theoretical formulas of composite beam with UDS in Section 2.1.
4.3. Application of Theoretical Formulas of Composite Track Beam of Straddle Monorail with CDS
According to the analysis in the above sections, the equivalent bending stiffness of the composite track beam with CDS presents a large nonlinearity, which further leads to some errors of deflection, stress, and frequency between the measured values and the theoretical values obtained by the theoretical formulas of composite beam with UDS in Section 2.1. In order to reduce the influence of the above errors, the application effect of the simplified theoretical formulas of composite track beam with CDS proposed in Section 2.2 is discussed below. Furthermore, the calculation results of different methods are compared more intuitively from the point of view of stress in order to directly guide the calculation and design of this kind of structure.
4.3.1. Determination of Correction Coefficient of Vertical Bending Stiffness
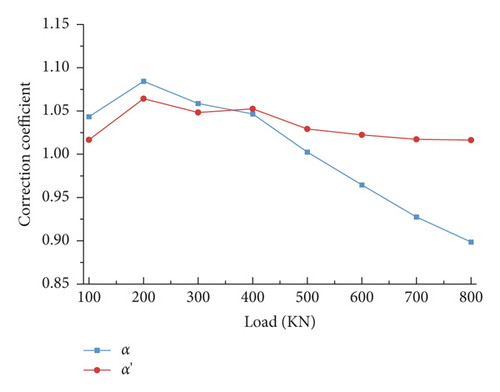
Equation (12) could be used to calculate the correction coefficients of vertical bending stiffness under different load levels, and the results were shown in Figure 13. The results showed the following: (1) the stiffness correction coefficients α and α′ both changed with the load, and their curves of “load-stiffness correction coefficient” were both nonlinear and had a reverse bending point. Taking the 200 kN load as the boundary, both α and α′ increased with the increase of load at lower load levels but decreased with the increase of load at higher load levels. (2) The variation of α′ with the load was small, which showed that the FEM results were close to the measured results, and the bending stiffness of the beam need not be corrected in the detailed shell-solid FEM model. (3) In practical engineering design, it was more convenient to use α combined with the theoretical formulas for calculation because the workload of detailed FEM modeling was too large. For the theoretical formulas of composite beam with CDS in Section 2.2, α could be set to 0.9, and the maximum difference between the theoretical displacement corrected by α = 0.9 and the measured displacement under large load levels of 500 kN and above was 11.6%, which was relatively safe. The application effect when α = 0.9 was verified below in terms of frequency and stress.
4.3.2. Application in Frequency Calculation
After considering the correction coefficient of vertical bending stiffness α = 0.9, the results of vertical natural frequency of steel beam and composite beam were compared as shown in Table 3. The results showed the following: (1) the error of theoretical frequency of composite beam corrected by α relative to the measured frequency was 4.04%, which was lower but safer than that without considering the stiffness correction coefficient. (2) The error of theoretical frequency corrected by α was still larger than the error of detailed shell-solid FEM model (1.24%), but the calculation workload of the former was significantly less than that of the latter.
| Measured frequency1 (Hz) | FEM frequency2 (Hz) | Theoretical frequency3 (Hz) | |
|---|---|---|---|
| Steel beam | 29.9 | 29.3 | 29.6 |
| Composite beam | 32.2 | 31.5 | 30.9 |
- 1The measured frequency was obtained by analyzing the measured data of the sensors. 2The FEM frequency was obtained by the finite element method. 3The theoretical frequency of composite beam was obtained by the theoretical formulas of composite track beam with CDS in Section 2.2 when α = 0.9, but the theoretical frequency of steel beam had not been corrected by α.
4.3.3. Application in Stress Calculation
- (1)
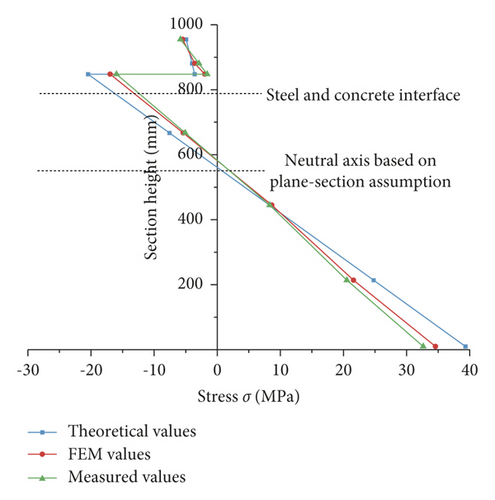
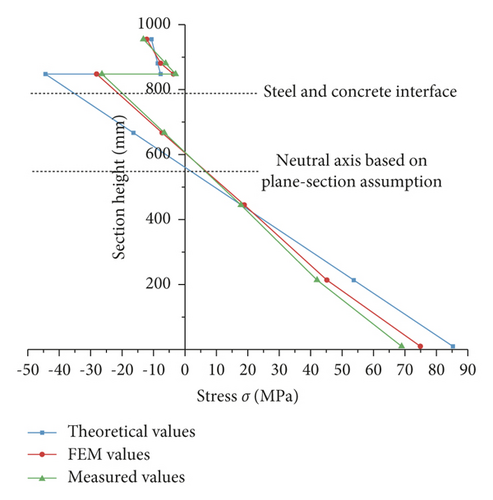
Under different load levels, the corresponding neutral axes of theoretical values, FEM values, and measured values of stress were basically the same, all within the range of 561 to 600 mm. With the increase of load level, the neutral axis was raised. The steel beam and concrete slab above the neutral axis were compressed, and the steel beam below the neutral axis was tensioned.
- (2)
When the load is 100 kN, the theoretical value, FEM value, and measured value of the maximum compressive stress of concrete slab were −4.9 MPa, −5.5 MPa, and −5.8 MPa, respectively, and all of them met the limit value (−26.5 MPa) of relevant code. The errors of the theoretical value relative to the measured value and the FEM value relative to the measured value were 15.5% and 5.2%, respectively. When the load was 200 kN, the theoretical value, FEM value, and measured value of the maximum compressive stress of concrete slab were −10.7 MPa, −12.1 MPa, and −13.2 MPa, respectively. The errors of the theoretical value relative to the measured value and the FEM value relative to the measured value were 18.9% and 8.3%, respectively. It could be seen that as the load increases, the stress errors of concrete slab of the theoretical value relative to the measured value and the FEM value relative to the measured value both increase, which also reflected that the nonlinear behavior of concrete slab under larger load is more significant.
- (3)
When the load is 100 kN, the theoretical value, FEM value, and measured value of the maximum compressive stress of steel beam were 39.3 MPa, 34.6 MPa, and 32.6 MPa, respectively, and all of them met the limit value (275 MPa) of relevant code. The errors of the theoretical value relative to the measured value and the FEM value relative to the measured value were 20.6% and 6.1%, respectively. When the load was 200 kN, the theoretical value, FEM value, and measured value of the maximum compressive stress of steel beam were 85.3 MPa, 74.9 MPa, and 68.9 MPa, respectively. The errors of the theoretical value relative to the measured value and the FEM value relative to the measured value were 23.8% and 8.7%, respectively. It could be seen that as the load increased, the stress errors of steel beam of the theoretical value relative to the measured value and the FEM value relative to the measured value both increased. With the increase of the load, the error change of steel beam was close to that of concrete slab because the nonlinear deformation of concrete slab led to the corresponding nonlinear change of steel beam.
- (4)
Based on the above analysis, the stress errors of theoretical formulas of composite beam with CDS relative to the measured results were 15.5% to 23.8% and were biased towards safety. The stress errors of the detailed shell-solid FEM model were 5.2% to 12.1%. In the design of this kind of structure, both the theoretical formulas and detailed FEM model could be used for early scheme comparison and later size optimization. Compared with the latter, the computation workload of the former was greatly reduced.
5. Conclusions and Recommendations
5.1. Conclusions
In this paper, the static and dynamic characteristics of prefabricated steel-concrete composite track beam with “cluster-distributed studs” (CDS) were studied by relevant theoretical analysis, numerical simulation, and model test. The conclusions are as follows.
5.1.1. Macroscopic Deformation Obtained from the Test
The equivalent vertical bending stiffness of the composite track beam is nonlinear. The greater the load, the faster the stiffness decreases, and the greater the difference with the theory of composite beam with “uniformly distributed studs” (UDS). The nonlinear characteristic of vertical bending stiffness can be used to guide related engineering design. Under a small design load, the equivalent stiffness can be calculated according to the equivalent stiffness theory without slippage and does not need to be reduced. Under a large design load, the stiffness reduction caused by slip effect should be considered.
5.1.2. Microscopic Strain Obtained from the Test
Below the neutral axis, the strain of steel box at the mid-span section of composite track beam basically shows a linear relationship along the direction of section height. Above the neutral axis, the strain of concrete slab and steel beam are both nonlinear, and the strain of concrete slab is 2.8 to 3.2 times higher than that of steel beam; as the deformation between steel beam and concrete slab is not coordinated, the plane-section assumption is no longer applicable even under lower load.
5.1.3. Applicability of Finite Element Method
Compared with the measured results of frequency, deflection, equivalent stiffness, and stress in the combined track beam test, the FEM modeling results based on the load-slip curve obtained from the push-out test are close to them, and the maximum differences are 1.24%, 6.4%, 6.4%, and 12.1%, respectively. The detailed shell-solid FEM method can be used to guide the detailed design of such structures, but it requires a large amount of modeling work.
5.1.4. Applicability of Theoretical Formula
Compared with the measured results of frequency, deflection, equivalent stiffness, and stress in the combined track beam test, the results based on theoretical formulas of composite beam with UDS are much lower and biased towards danger, but the results based on theoretical formulas of composite beam with CDS are slightly higher and biased towards safety. For the convenience of practical engineering design, the correction coefficient of vertical bending stiffness is recommended to be 0.9, and at this time, the maximum differences between the measured values and the above mechanical parameters are 4.04%, 11.6%, 11.6%, and 23.8%, respectively. In the design of this kind of structure, the proposed formula can be used for early scheme comparison and later size optimization. Compared with the detailed shell-solid FEM model, the proposed formula significantly reduces the design workload.
5.2. Recommendations
The straddle monorail can shuttle through the city with a slender and lightweight viaduct structure. On the premise of not affecting urban landscape and environment, it can effectively alleviate urban traffic congestion and promote the diversified development of urban public transport. The assembly construction of track beam of straddle monorail can be realized by steel-concrete composite technology, which has the advantages of fast construction speed, short construction time, high quality of prefabricated beam, small influence of shrinkage and creep, and low environmental influence of noise and dust. Moreover, it can significantly reduce the impact on the production and life of the people around the construction site and can produce significant social and economic benefits. On the basis of this study, it is necessary to carry out further research on structural optimization in the future to reduce construction and operation costs and finally create a new resource-saving and environment-friendly urban rail transit system.
Conflicts of Interest
The authors declare that there are no conflicts of interest regarding the publication of this paper.
Authors’ Contributions
All authors made significant contributions to this work.
Acknowledgments
This research was funded by the Science and Technology Research and Development Program of China State Construction Engineering Corporation Limited (Grant nos. CSCEC-2020-Z-43, CSCEC-2021-Z-26, and CSCEC-2021-Q-54).
Open Research
Data Availability
The data used to support the findings of this study are available from the corresponding author upon request.


