A Novel Based on the Log-Squared Envelope Harmonic Noise Ratio Fault Transient Feature Extraction Method
Abstract
To counter the sensitivity of kurtosis for the random pulse, a novel periodic detection index based on the log-squared envelope harmonic noise ratio (LSEHNR) is constructed, and then, a novel LSEHNRgram feature extraction method is proposed by introducing the maximal overlap discrete wavelet packet transform (MODWPT). Firstly, MODWPT is used to decompose the frequency band of the signal and a series of subsignals are obtained from each stage of decomposition, which are called nodes. Secondly, autocorrelation of the log-squared envelope for each node at each level is computed; calculate the LSEHNR, simultaneously. Then, the LSEHNR values of all nodes are calculated and the node with the maximal of the LSEHNR value is selected for spectrum analysis. Finally, the square envelope spectrum (SES) analysis is performed on the in-band filtered signal to extract the transient characteristics of the rolling bearing fault. The experimental results indicate that the LSEHNRgram method can accurately detect the demodulation frequency band and enhance the fault features under the condition of the low noise-to-signal ratio (SNR). The effectiveness of the method is verified on numerical and experimental datasets by comparison with autogram, infogram, and fast kurtgram methods.
1. Introduction
Rolling element bearings are among the most important components of rotating machinery, and their operation status is related to the operation safety of the equipment [1]. Therefore, determination of rolling bearing failure in advance will help to arrange maintenance in time to avoid equipment and personnel safety accidents. However, in practical application, the vibration signal of rolling bearing is greatly affected by the transmission path and operating environment. The periodic components of the rolling bearing fault are easily submerged by other irrelevant components, such as nonperiodic pulses and modulation harmonics, which greatly increases the difficulty of fault diagnosis. Different from intelligent fault diagnosis methods [2], envelope analysis is also one of the effective fault diagnosis methods and the key idea is to find the optimal resonance band in the spectrum. A fault on a bearing component will generate periodic pulses during operation, which eventually excite the resonance of the bearing. Such frequencies are called bearing characteristic frequencies, and they modulate the resonant frequencies, while the resonant frequencies and resonant bands are usually difficult to know in advance.
Therefore, how to suppress the influence of irrelevant components and accurately extract the frequency band corresponding to the periodic components of the signal is still one of the hotspots in the research of rolling bearing fault diagnosis.
How to select the frequency band most relevant to the fault transient is very important in envelope analysis. When there the rolling bearing surface fails, the transient impact will be generated between the defective surfaces and other contact surfaces, which will stimulate the structural resonance. Since the high-frequency demodulation technology has been introduced by Darlow, there have been a lot of studies exploring demodulation analysis. Dwyer [3] proposed spectral kurtosis (SK) firstly. Subsequently, Antoni [4] measured the time-frequency energy density of the fault signal and used the kurtosis spectrum as the dispersion index to express the pulse information, which later developed into an effective tool for selecting the resonant demodulation frequency band. Furthermore, combining the advantages of the tree filter structure and quasianalytical filter, the fast kurtgram (FK) method is proposed to simplify the computational complexity of SK. In the past few years, FK and its improved algorithms have been widely used in the field of fault diagnosis because of their simple implementation and fast computation speed. Since kurtosis is extremely sensitive to random pulses, the FK method may produce misleading results.
In order to overcome the limitations of the FK method, related scholars have improved (or replaced) the spectral kurtosis index and filter optimization design (optimized decomposition tree filter bank) for the optimized FK method, and have achieved rich results. In the aspects of the filter optimization design, the related research is aimed at designing a more accurate band-pass filter to suppress the limitations of the FIR filter. Liu et al. [5] applied empirical wavelet transform to construct the filter to ensure the same signal length after filtering. The improved redundant second-generation wavelet packet transform proposed by Chen et al., can adaptively match the features of vibration signals to achieve fine separation of fault features and avoid frequency aliasing [6]. Furthermore, MODWPT [7], dynamic Bayesian wavelet transform [8], and tunable Q factor wavelet transform [9] are also applied to the division frequency band. On the selection of the target frequency band, some alternative indexes are proposed to enhance or replace the SK index to optimize the performance of FK. Generally, these indicators can be divided into three categories. The most important works of first category concern about the magnitude of the fault impulse, including kurtosis-based indicators, Gini index [10] and smoothness index [11], L2/L1 norm [12] etc. The second category focuses on fault periodicity; the representatives of this category are correlated kurtosis [13], improved harmonic product spectrum [14], harmonic-to-noise ratio (HNR) [15], etc. The last category emphasis characterizes both impulsive and cyclostationary signatures. A well-known example of this category is the joint negentropy of squared envelope (SE) and SE spectrum (SES), which presents the fault information in three different infograms, SE infogram, SES infogram, and average infogram [16]. In the meantime, as an alternative to the SES-based methods, the cyclic spectral correlation (CSC) and the cyclic spectral coherence (CSCoh) [17] have been proposed, in the last two decades. In addition, other scholars combine theoretical fault characteristic frequencies to construct cyclic stability indicators for specific bands, such as the ratio of cyclic content (RCC), weighted cyclic harmonic-to-noise ratio (WCHNR) [18], and irrelevant second-order cyclostationary (ICS2) [19].
The research on the abovementioned contents has developed a reliable result, but some indicators of signals represent some limitations, and to some extent, the proposed method also affects the overall performance of that method. For example, correlation kurtosis, RCC, and WCHNR are only suitable for the identification of specific frequency components with known prior knowledge and their flexibility and practicability are limited [20]. The entropy index is susceptible to harmonic interference [21] and also insensitive to the periodicity of fault signal, L2/L1 norm, and Gini index which are sensitive to outliers [22], which can easily lead to misleading results in the case of strong interference. The indicators based on both kurtosis and SES-based indicators are very sensitive to the impulse and cyclic stability of the signal [23].
- (1)
The autocorrelation function is applied to eliminate the noise in the fault signal, and the logarithmic envelope is utilized to eliminate the mutual interference of multiple components, enhancing the detectability of the fault
- (2)
A new signal periodic detection indicator based on the LSEHNR is constructed. The index also has strong robustness under strong noise or random amplitude interference
- (3)
An innovative LSEHNRgram spectrum analysis scheme combining MODWPT spectrum segmentation and the LSEHNR indicator is proposed, which provides a novel solution for the transient feature extraction of rolling bearing faults
The remaining of the paper is organized as follows: Section 2 introduces the relevant theoretical basis, and the proposed index and implementation principles of LSEHNRgram are elaborated. In Section 3, the proposed method is compared with the autogram, infogram, and fast kurtgram methods in analog signals and experimental platform data. Section 4 discusses related expansion research and draws relevant conclusions.
2. Theoretical Background
2.1. Autocorrelation
Autocorrelation is one of the basic statistical properties in random vibration analysis. It determines whether the signal is periodic by describing the similarity between the signal and its time shift variable [24].
2.1.1. Definition of Autocorrelation

Since the periodic signal x(t) and white noise w(n) are independent, the correlation of random Rww(τ) white noise is zero and Rxw(τ) and Rwx(τ) are almost zero; therefore, the autocorrelation of y(t) can be simplified to Ryy(τ) ≈ Rxx(τ). It can be seen from equation (3) that the periodic signal with noise can eliminate the noise in the original signal through the autocorrelation operation, and it also proves that autocorrelation can enhance the periodic component in the signal, as shown in Figure 2.

2.2. LSEHNR
- (1)
Calculate the squared envelope of the original signal. First, the envelope signal of the original fault signal x(t) is obtained by the Hilbert transform as follows:
(4)
- (2)
Calculate the autocorrelation of LE(t).
- (3)
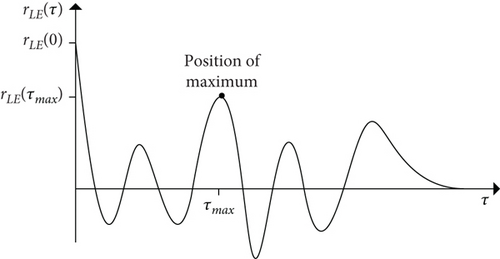
Find the position of the maximum value of autocorrelation in the lag domain:
In equation (8), τmax is the lag when autocorrelation achieves a local maximum, rLE (τmax) is the energy of the harmonics, and rLE (0) is the total energy of the envelope signal, as shown in Figure 3.
2.3. Implementation of the LSEHNRgram Method
- (Step 1)
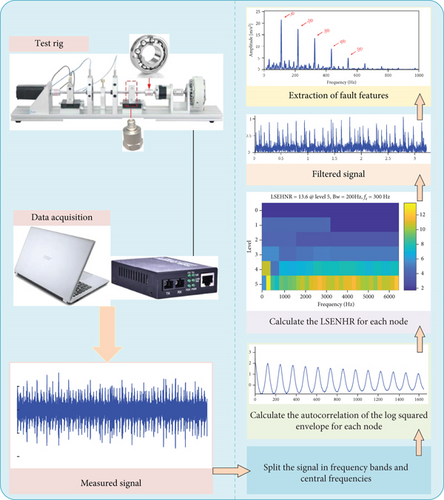
According to the binary tree structure, MODWPT is used to divide the frequency band of the original signal and a series of bands are obtained.
- (Step 2)
The autocorrelation and LSEHNR of the log-squared envelope of each node signal decomposed by MODWPT are calculated according to equations (3) and (8), respectively
- (Step 3)
The LSEHNR values of each node signal can be integrated to draw LSEHNRgram and to provide an intuitive visual interface for optimal band selection
- (Step 4)
The center frequency fc and bandwidth Bw corresponding to the node signal with the maximum LSEHNR are regarded as the optimal filtering parameters. Then, the filter is constructed by using these parameters to extract the periodic components of the vibration signal of the rolling bearing fault
- (Step 5)
The Fourier transform is applied to calculate the square envelope spectrum of the filtered signal, and then, the transient characteristics of the rolling bearing fault are extracted
2.4. Features of the LSEHNR
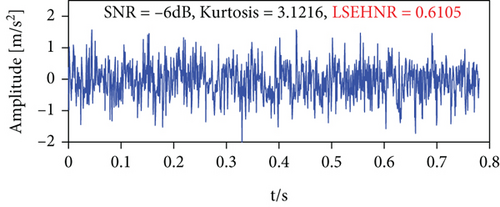
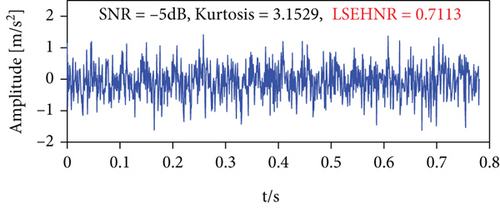
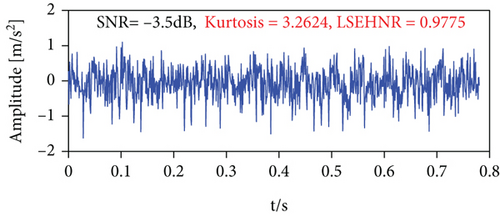
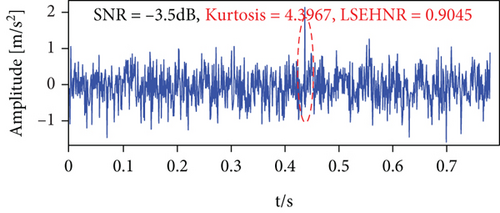
In this subsection, the sensitivity of kurtosis and the LSEHNR to noise and aperiodic random pulse is compared by the simulation signal. The simulation signal consists of the periodic pulse sequence e = (−4∗e∧ (−1000∗t))∗sin(800∗π∗t), periodic harmonic p = 0.1∗sin(60∗π∗t − π/3), Gaussian white noise, and random pulse; the signal (d) is formed by adding a large amplitude random pulse to signal (c) at t = 0.43 s. In Figures 5(a) and 5(b), it is known that the LSEHNR is more sensitive than the cliff for periodic pulse features. According to Figures 5(c) and 5(d), it can be concluded that the LSEHNR is robust to random pulse disturbances in the signal. In conclusion, the experimental results show that the LSEHNR constructed in this paper is more sensitive to periodic pulse characteristics and more robust to random pulses and can suppress the effects of nonperiodic random pulse interference.
3. Simulation and Experimental Analysis
3.1. Case Study I: Simulation Analysis
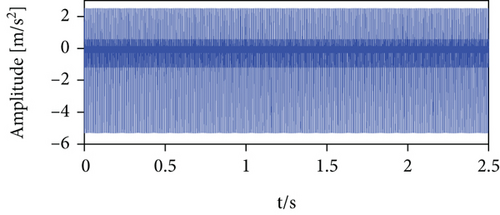
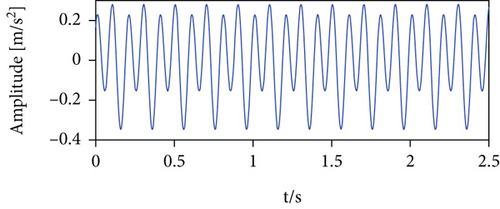
So as to verify the effectiveness of this method, a typical rolling bearing model is used to simulate the fault signal, which can be expressed as x(t) = e(t) + r(t) + p(t) + n(t) and shown in Figure 6. Among them, e(t) represents the repetitive pulse caused by the local fault, which can be modeled as an exponential decay for . r(t) is the random pulse generated by simulating external shock; it can be expressed as . Where Ak and Bs represent the amplitudes of the pulse sequence, Tk is the period of the impacts and Ts ~ U(0, 32768) is the occurrence time. K and S are the number of random pulses. εk and εs are the damping coefficient. fk and fs are the resonance frequency. p(t) represents the periodic component from the rotation axis and other disturbances, which can be simulated as . Where M is the number of periodic harmonics, Cm, fc, and θm are the amplitude, frequency, and phase of the components, respectively. n(t) is the background noise.
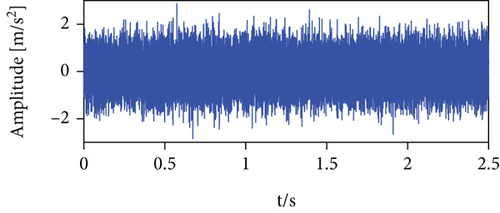
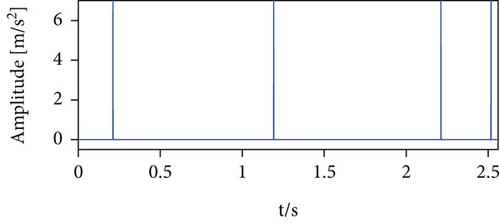
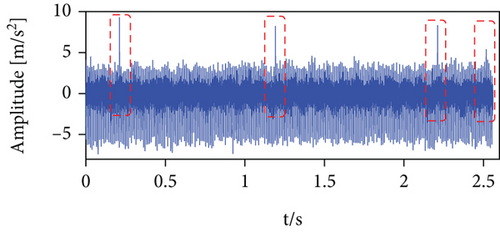
In this paper, the sampling frequency fs, length of the fault signal N, and fault frequency fo are designated as 12.8 kHz, 32768, and 105 Hz. The background noise is Gaussian white noise with the SNR being −5 dB. The parameters as tabulated in Table 1.
| Param | Value | Param | Value | Param | Value | Param | Value | Param | Value | Param | Value |
|---|---|---|---|---|---|---|---|---|---|---|---|
| K | 105 | Fk | 12800 | S | 4 | Φs | 0 | C1 | 0.1 | θ2 | π/3 |
| Ak | 8 | εk | 1000 | Bs | 0.6 | εs | 800 | f1 | 10 | θ1 | −π/6 |
| Tk | 1/105 | Φk | 0 | Fs | 1500 | M | 2 | f2 | 20 | C2 | 0.6 |
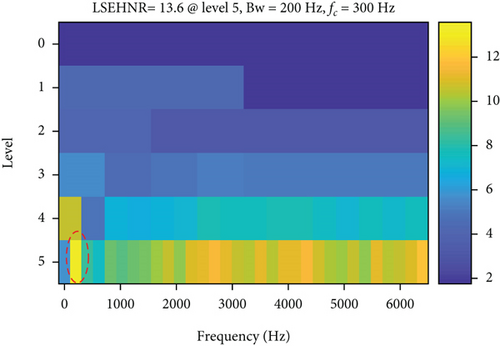
The simulation signal is analyzed by the proposed method in this subsection. Figure 7 shows the LSEHNRgram and the envelope analysis results for the selected frequency band. As can be seen in Figure 7(a), the optimal frequency band parameter [fc, Bw] is [300 Hz, 200 Hz], which is selected according to the maximum value of the LSEHNR. Figure 7(b) depicts the squared envelope spectrum of the signal in the optimal frequency band. Figure 7(b) is clearly visible for the failure characteristics of fo and its 2–3 multiplicity frequencies of the filter signal, as measured to demonstrate the feasibility of the proposed method.
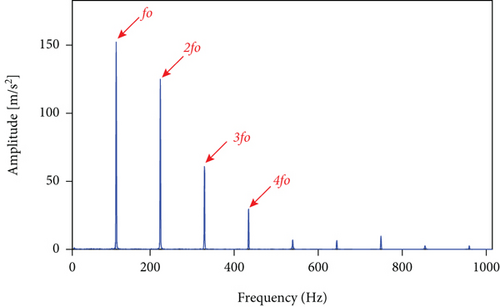
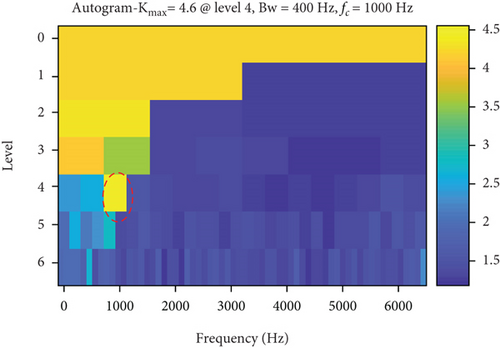
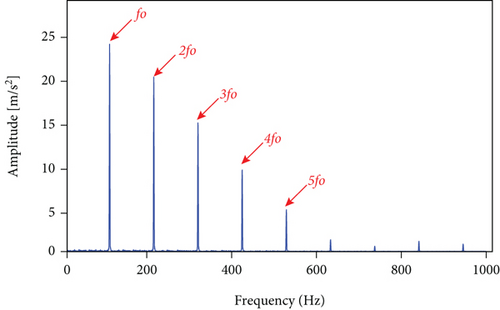
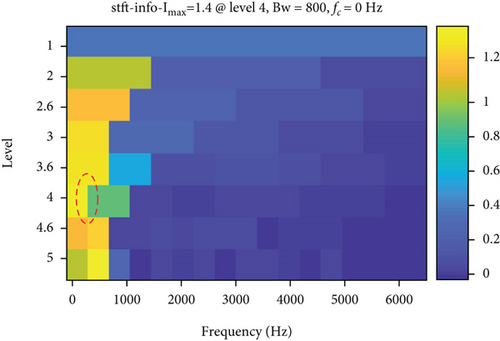
Meanwhile, in order to further demonstrate the effectiveness of this method, the experimental results of this method are compared with autogram, infogram, and fast kurtgram and presented in Figure 8. The comparative experimental results show that the LSEHNRgram method can achieve equal or slightly better effect than other methods and provides a new solution for the transient feature extraction of rolling bearing faults. For this reason, the next section will focus on the application effect of the LSEHNRgram method on actual rolling bearing fault feature extraction and further verify the effectiveness and practicability of the presented method.
3.2. Experiment Analysis
In this subsection, the effectiveness and practicability of the proposed method are verified by the accelerated life experiment data of Xi’an Jiaotong University XJTU-SY rolling bearing [26] and the simulated fault experimental data of Kunming University of Science and Technology KUST-SY.
3.2.1. Case Study II: Accelerated Degradation Experiments of Rolling Element Bearings
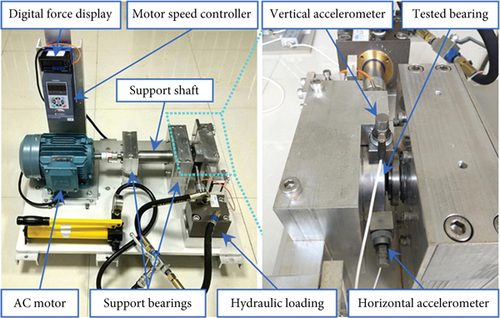
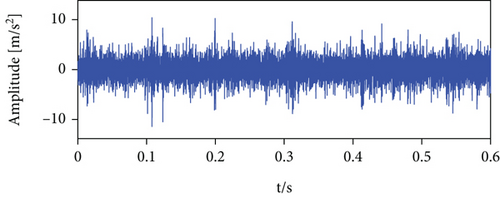
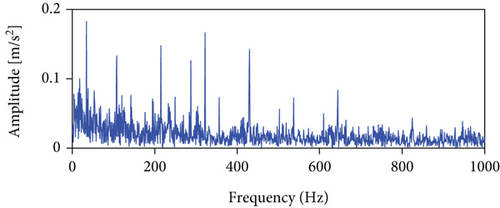
The first case analyzes the data of Xi’an Jiaotong University XJTU-SY rolling bearing. Figure 9 exhibits the structure of the bearing test rig, the test bearing is LDK UER204 rolling bearing, and its related parameters are shown in Table 2. This article selects the data under working condition (1) of the dataset (applied radial force 12 KN, and the rotation speed is 2100 (r/min) for analysis. In the experiment, the sampling frequency is set to fs = 25.6 kHz, the sampling interval is 1 min, the sampling duration is 1.28 s each time, the number of sampling data points N = 32768, and the outer ring fault frequency fo = 107.9 Hz can be calculated according to the parameters in Table 2.
| Param | Value | Param | Value |
|---|---|---|---|
| Insider diameter (mm) | 29.30 | Ball diameter (mm) | 7.92 |
| Outsider diameter (mm) | 39.80 | Number of balls | 8 |
| Pitch diameter (mm) | 34.55 | Contact angle (°) | 0 |
| Basic dynamic load rating (N) | 12820 | Basic static load rating (N) | 6.65 |
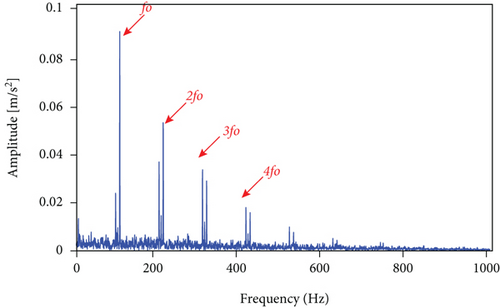
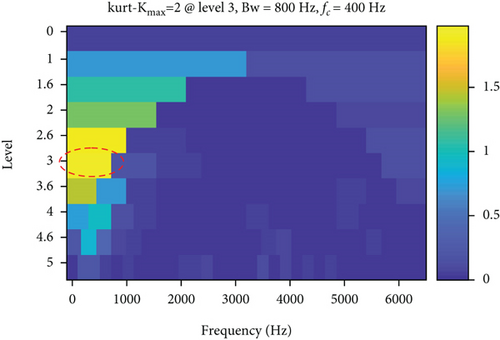
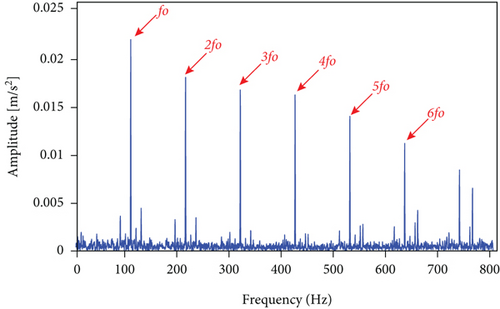
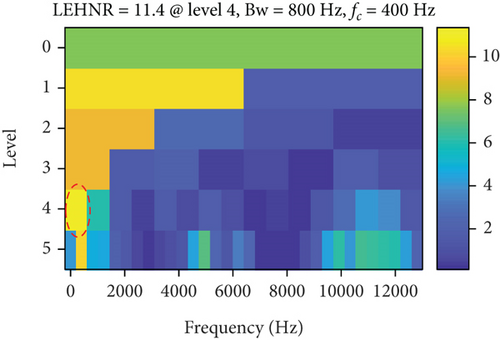
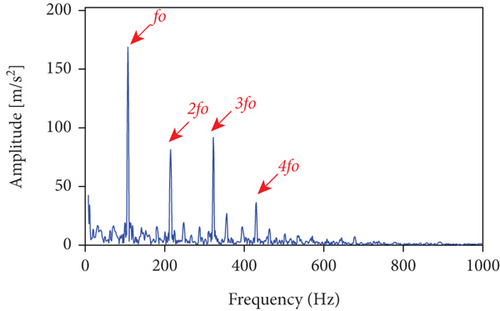
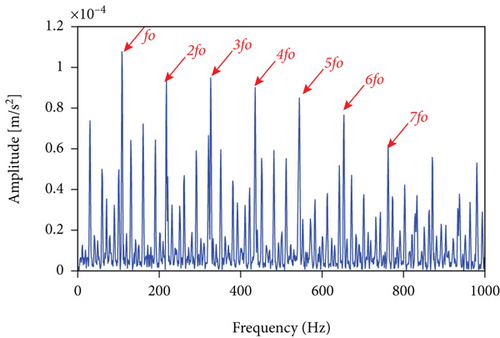
The measured signal in Figure 10 is processed using the methods mentioned herein, and the LSEHNRgram is displayed in Figure 11(a). The maximum value of the LSEHNR is detected in the fourth layer of the decomposition, and the [fc, Bw] of the best demodulation frequency band selected is [400 Hz, 800 Hz]. The envelope spectrum analysis of the narrowband signal is carried out, and the result is presented in Figure 11(b). As shown, the filter signal’s fault characteristic frequency fo and its 2–4 multiplication frequencies are very clear and it can be accurately judged that the rolling bearing has an outer ring failure.
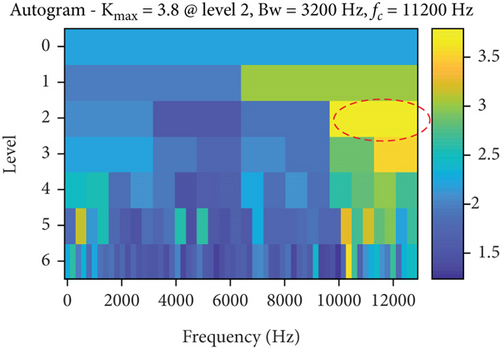
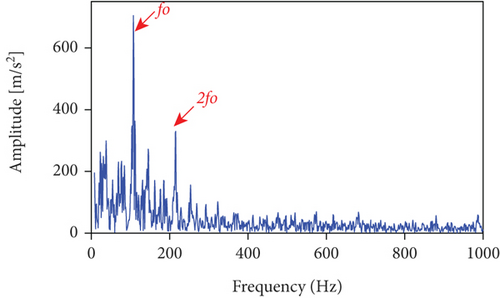
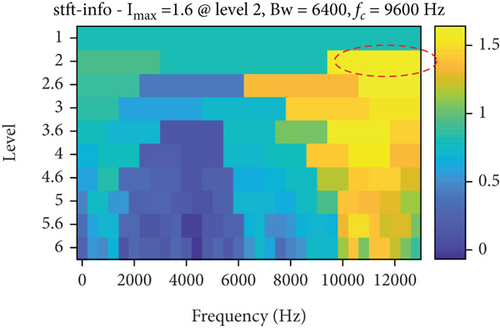
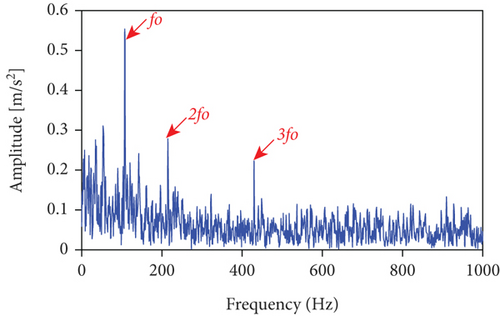
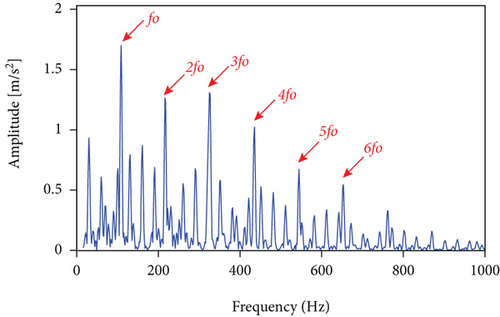
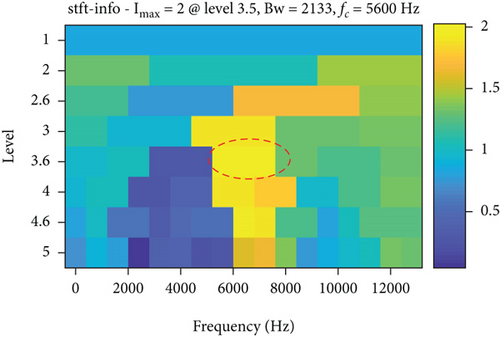
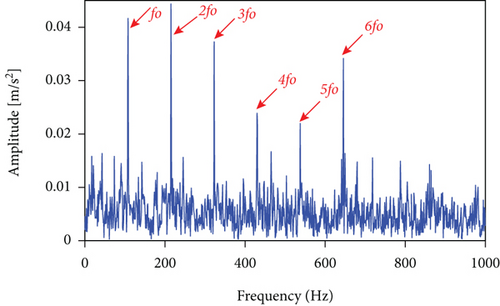
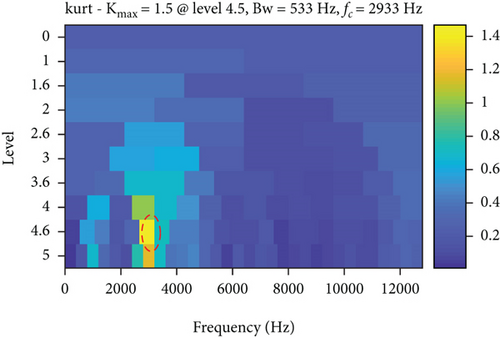
The analysis results of the measured signals by the autogram, infogram, and fast kurtgram methods are shown in Figure 12. Compared with the simulation signal analysis results, it is found that the effect of the three methods on the measured signal is worse than the simulated signal, on account that the measured signal is affected by the noise and signal transmission path. Compared with LSEHNRgram, the optimal demodulation band of autogram, infogram, and fast kurtgram has more interference components; just 1–2 multiplication frequencies can be observed, which is not conducive to the identification of the fault. Therefore, it can be concluded that the LSEHNRgram method enhances the fault characteristics and weakens the influence of interference components, which improves the identification and reliability of fault diagnosis.
3.2.2. Case III: Fault Data of the Bearing Outer Ring of Kunming University of Science and Technology
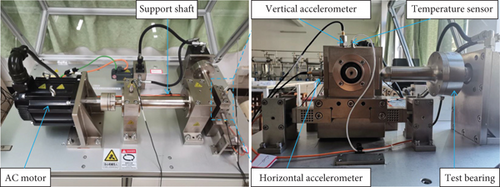
The experimental data analyzed in this part come from the KUST-SY rolling bearing simulation failure test bench, as shown in Figure 13. The experimental bearing model is 6250-2RSH, and the specific parameters are shown in Table 3. In the experiment, the wire-cut technology is used to manufacture faults on bearings and the faulty bearing whose outer ring cutting depth of the rolling bearing is 0.4 mm is selected for the experiment. In this experiment, the load is 10 kN, the actual speed is 1797 r/min, the sampling frequency fs is 25600 Hz, and the sampling time is 10 s. According to the parameters in Table 3, the fault characteristic frequency of the bearing outer ring can be obtained as fo is 107.22 Hz.
| Param | Value | Param | Value |
|---|---|---|---|
| Insider diameter (mm) | 25 | Ball diameter (mm) | 8 |
| Outsider diameter (mm) | 52 | Number of balls | 9 |
| Bearing diameter (mm) | 39 | Contact angle (°) | 0 |
| Basic dynamic load rating (N) | 14800 | Basic static load rating (N) | 7800 |
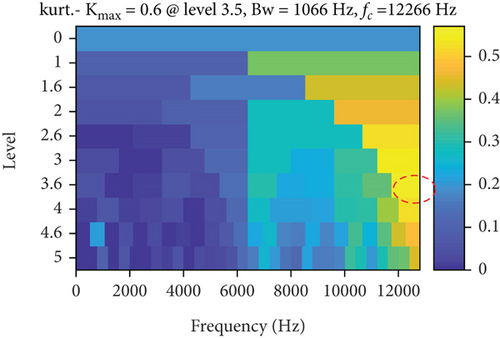
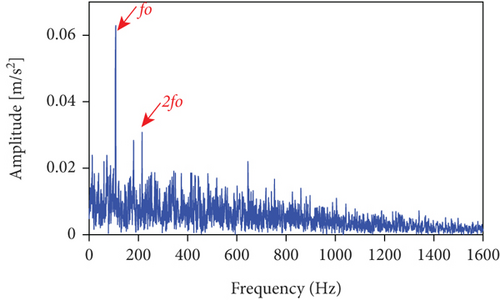
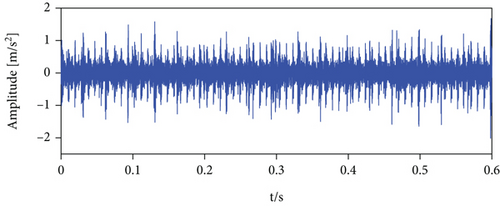
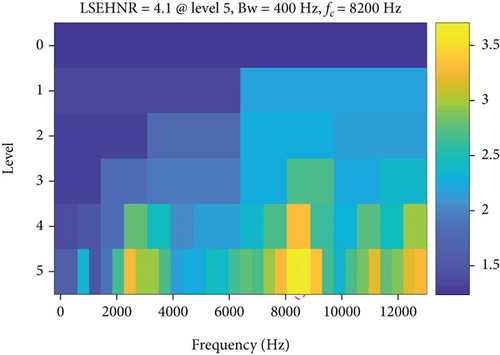
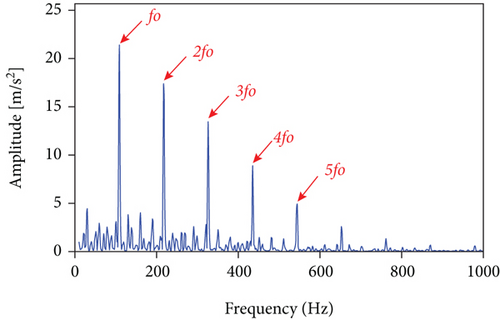
The measured signal in Figure 14 is processed by the LSEHNRgram method. The band with the highest LSEHNR is obtained at level 5 with a center frequency of fc = 8200 Hz and a bandwidth of Bw = 400 Hz. As shown in Figure 15(b), there is little interference from unrelated parts and the characteristic frequency is clearly displayed, so that the bearing outer ring fault can be accurately determined.
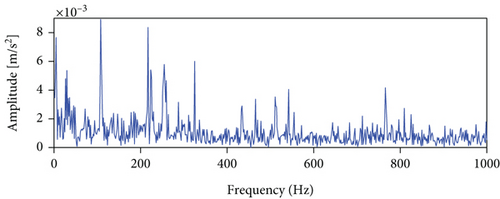
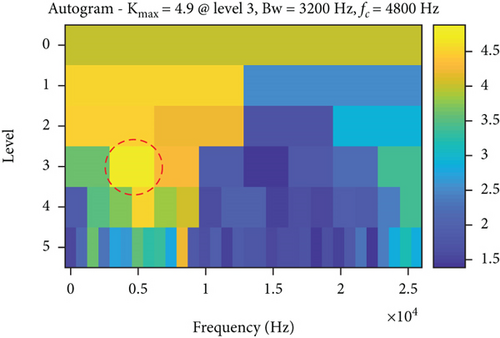
Meanwhile, using autogram, infogram, and fast kurtgram methods to analyze the same signal, the results are shown in Figure 16. Comparing Figures 15 and 16, we can get a conclusion consistent with Section 3.2.1, which further illustrates the effectiveness and feasibility of the proposed LSEHNRgram method.
4. Discussion and Conclusion
4.1. Discussion
- (1)
The performance of autogram in the measured signal is slightly worse than that in the simulation signal. Through in-depth analysis, the cause of the abovementioned problems may be affected by the following factor. The components of the measured signal are more complex than the simulated signal, which contains more Gaussian and non-Gaussian background noise. As a result, too much noise interferes with the Kurtosis calculation process and weakens the effectiveness of autogram in selecting fault feature information
- (2)
It is necessary to further discuss the identification effect of the presented method on the faults of the inner ring, rolling element, and cage. The vibration signals of the inner ring, rolling elements, and cage are affected by factors such as transmission paths and signal coupling, resulting in more complex signal characteristics. However, the LSEHNR proposed in this paper has the advantages of suppressing noise interference and enhancing fault characteristics. In this case, it is of great significance to further explore the scalability of the process
- (3)
The proposed LSEHNRgram method has achieved good results in single fault identification, but it is necessary to further explore its identification effect on multiple faults. This is mainly because once the bearing breaks down, it will rapidly develop into a multifault situation. Combining the coupling characteristics of multifault signals and the advantages of the LSEHNRgram method, it is of great theoretical value to study the performance of the proposed method in multifault diagnosis
4.2. Conclusion
- (1)
A new based LSEHNR signal periodic detection indicator is constructed to characterize the periodic pulse characteristics of rolling bearing faults. It has better characterization performance than the kurtosis index
- (2)
Combining the MODWPT spectrum segmentation method, the LSEHNR gram envelope spectrum feature extraction method is proposed, which provides a new solution for the transient feature extraction of rolling bearing faults
- (3)
The superior characterization performance of fault transient characteristics of the LSEHNRgram method is demonstrated by comparing with autogram, infogram, and fast kurtgram on three different datasets
Additional Points
Featured Application. (1) A novel periodic detection indicator based on the LSEHNR is proposed for identifying information-rich frequency bands. (2) The LSEHNR takes advantage of the periodicity of cyclostationarity of bearing defect signals. (3) The proposed method improves the antinoise performance in fault diagnosis. (4) The performance of the new method is validated against existing tools on multiple datasets.
Conflicts of Interest
The authors declare that they have no known competing financial interests or personal relationships that could have appeared to influence the work reported in this paper.
Acknowledgments
This research was supported by the National Natural Science Foundation of China (Grant no. 62173168 and 62163020) and Yunnan Fundamental Research Projects, China (no. 2019FD042).
Open Research
Data Availability
The data used to support this research are available from the corresponding author upon request.


