Design of Intelligent Rehabilitation Evaluation Scale for Stroke Patients Based on Genetic Algorithm and Extreme Learning Machine
Abstract
The rehabilitation of stroke patients is a long-term process. To realize the automation and quantification of upper limb rehabilitation assessment of stroke patients, an automatic prediction model of rehabilitation evaluation scale was established by extreme learning machine (ELM) according to Fugl-Meyer motor function assessment (FMA). Four movements in the shoulder and elbow joints of FMA were selected. Two acceleration sensors fixed on the forearm and upper arm of the hemiplegic side were used to collect the motion data of 35 patients. After preprocessing and feature extraction, the feature selection was carried out based on genetic algorithm and ELM, and the single-action model and comprehensive prediction model were established, respectively. The results show that the model can accurately and automatically predict the shoulder and elbow score of FMA, and the root mean square error of prediction is 2.16. This method breaks through the limitations of subjectivity, time-consuming and dependence on rehabilitation doctors in the traditional evaluation. It can be easily used in the assessment of long-term rehabilitation.
1. Introduction
With the improvement of living standards and the aging of population, the incidence rate of stroke is on the rise and tends to be younger. About 70% to 85% of the first stroke patients have hemiplegia [1]. According to statistics, 2 million 500 thousand stroke patients have added annually in China, 1 million 200 thousand to 1 million 500 thousand of them died from stroke-related diseases, and 7 million survived after stroke, of which 75% left with disability in varying degrees, 40% were severely disabled [2]. This high incidence rate, high mortality rate, and high disability rate bring heavy mental pressure and substantial financial burden to society and families.
Compared with the lower limbs, the upper limb movement is more refined, and the recovery is slow. Therefore, the rehabilitation of upper limb motor function after stroke has always been a significant problem. About one in five stroke patients can not achieve the complete recovery of upper limb function [3]. With the development of telemedicine technology, rehabilitation robot technology, and virtual reality technology, home-based rehabilitation has attracted more and more attention [4–8]. The literature reports that home-based rehabilitation can achieve the same effect as inpatient rehabilitation [9]. However, effectively monitoring and evaluating the progress and functional status of patients’ home-based rehabilitation to help rehabilitation doctors further formulate individualized rehabilitation treatment plans has always been the bottleneck of the development of home-based rehabilitation.
At present, the Fugl-Meyer scale is the most widely used method to evaluate the motor function of stroke hemiplegia in the clinic. It requires patients to perform a series of movements. It depends on the evaluator’s unarmed operation and observation to check the limb reflex state, flexion and extension cooperative movement, and selective separation movement in different recovery stages, which belongs to subjective evaluation. Many application studies show that the scale is sensitive and reliable, but many items are. The assessment is time-consuming and requires the participation of therapists or rehabilitation doctors, which limits its application in home rehabilitation to a certain extent [10–12]. Therefore, the ideal evaluation method in home rehabilitation treatment is simple, objective, and quantitative automatic evaluation. The wireless body sensor network composed of multiple sensor nodes can realize the automation and quantification of motor function evaluation. Many studies abroad have used it for home monitoring of the elderly and patients with chronic diseases. Through the study of 169 stroke patients, Uswatte et al. [13, 14] found that the acceleration sensor can capture the clinical information reflecting the degree of upper limb motor dysfunction. Patel et al. [15] used acceleration sensors to automatically estimate the score of Wolf motor function test (WMFT-FAS). However, there are few reports on the combination of motion sensor and clinical evaluation scale in China.
To further automate and quantify the assessment of home based rehabilitation, we propose a method for achieving an automated assessment of the rugl Meyer scale using accelerometry sensors in the hope of more objectively and quantitatively reflecting the patient’s upper extremity motor function status. The automatic algorithm can evaluate patients more quickly and accurately, and it is convenient to collect relevant data in order to change the treatment plan and make the treatment measures more active. Four movements were selected from the shoulder and elbow joints of the upper extremity Fugl-Meyer assessment (UE-FMA). The patient’s movement data were collected with two acceleration sensors fixed to the forearm and upper arm of the patient’s hemiplegic side. The automatic prediction model of the score of the shoulder and elbow joints of UE-FMA was established based on genetic algorithm and extreme learning machine.
2. Correlation Algorithm
2.1. Extreme Learning Machine
The extreme learning machine (ELM) is a single hidden layer feedforward neural network learning algorithm proposed by Huang et al. [16]. Its hidden layer node parameters (internal weight and bias) are randomly selected, and the external weight of the network obtains its least-squares solution by minimizing the square loss function. The determination process of network parameters does not need any iterative steps, which dramatically improves the operation speed (Figure 1). ELM algorithm is simple and easy, overcomes the disadvantages of slow training speed, and is easy to fall into local optimization of traditional neural network based on gradient descent method. Its network structure and working principle are as follows:
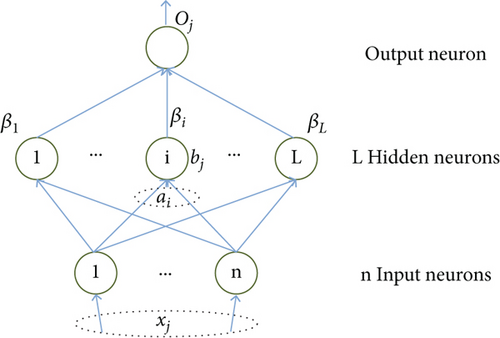
Where: ai, bi are node parameters; βi represents the external weight connecting the ith hidden layer node and the network output, and g is the activation function.
H is called hidden layer output matrix.
2.2. Genetic Algorithm
- (1)
Code: The solution data of solution space is expressed as genotype string structure data of genetic space. Different combinations of string data represent other solutions to the problem. The typical coding methods are binary coding, gray coding, and floating-point coding
- (2)
Population initialization: Determine the population size N, crossover probability Pc, mutation probability Pm, and termination evolution criterion, randomly generate N individuals as the initial population X(0), set the current evolution algebra k =0 and the maximum evolution algebra T
- (3)
Calculate the fitness value: Fitness value represents the advantages and disadvantages of individuals or solutions. Different fitness functions are defined for various problems and the fitness value of of each individual in the k generation population is calculated according to the fitness function
- (4)
Genetic manipulation: The selection operator, crossover operator and mutation operator act on the current population in turn to realize evolution
Inspection termination conditions: If the genetic algebra satisfies the termination condition, the calculation is terminated, and the best individual in the current population is output as the final satisfactory solution; Otherwise, k = k +1, go to step (3)
3. Materials and Methods
3.1. Experimental Design and Data Acquisition
A total of 35 stroke inpatients from the Department of Neurosurgery, Yancheng First Peoples’ Hospital participated in the study. The ethics committee approved the experiment of our hospital. Table 1 shows the basic data of the patients.
| Information | Value |
|---|---|
| Sex, M/F | 19/16 |
| Age (year) | 68.6 ± 13.1 |
| Hemorrhage/infarction | 21/14 |
| Hemiplegic site, L/R | 11/24 |
| Time of onset (month) | 9.1 ± 6.7 |
| UE-FMA | 15.8 ± 9.2 |
The admission criteria are: 1) the clinical diagnosis meets the diagnostic criteria of stroke formulated by the fourth national cerebrovascular conference of Chinese Medical Association in 1995, and is confirmed by cranial CT or MRI; 2) The onset time is no more than two years, and the upper limbs on the hemiplegic side have the ability of autonomous movement.
The exclusion criteria were: 1) those with cognitive impairment and unable to cooperate; 2) Accompanied by upper limb or trunk pain and affecting active movement.
Firstly, a rehabilitation physician with many years of clinical experience used UE-FMA to evaluate the subjects. UE-FMA includes 33 items, with a score of 0 ~ 2 for each item, 0 for incomplete, 1 for partial completion, and 2 for smooth completion, including 15 items for shoulder and elbow joints, with a total of 30 points. The rehabilitation physician gives a score of 0, 1 or 2 by observing the completion of each task, and the sum of each score is the total score. Four movements of shoulder and elbow joints were selected: 1) Forward flexion of shoulder joint; 2) Abduction of shoulder joint; 3) Elbow flexion, forearm pronation and supination; 4) Hand touching the lumbar spine is used as a collection action (Figure 2). The selection of actions is based on the clinical experience of rehabilitation doctors and the standard examination method of bmrmstiwn six level evaluation method. The simplified Fugl-Meyer scale (S-FMA) developed by Hsieh et al. [17] is basically consistent with the actions selected in this study. The reliability and validity of S-FMA have been verified. This reflects the effectiveness of action selection in this study to a certain extent.
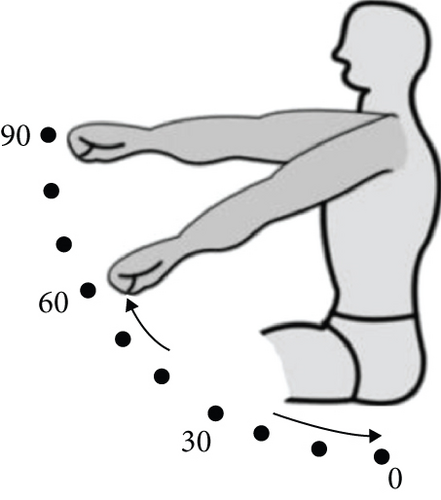
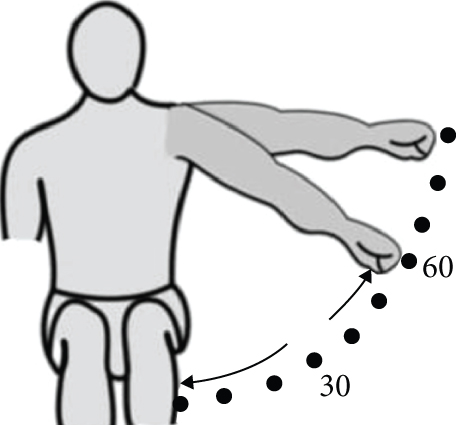
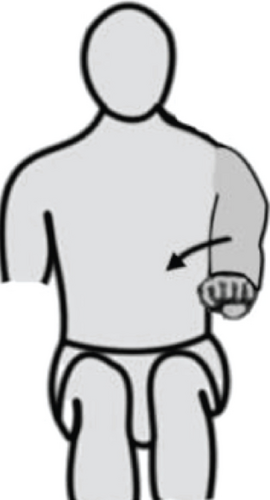
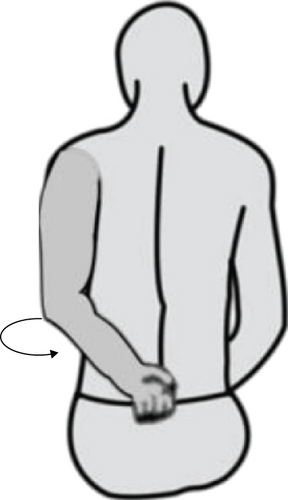
The wireless body sensor network system composed of two triaxial acceleration sensor nodes and one receiving node is used for data acquisition. The sensitivity of the acceleration sensor is ±6 g and the sampling rate is 40 Hz. During the acquisition process, two sensor nodes were fixed on the forearm and upper arm of the patient with hemiplegia,; The c-axis is parallel to the arm, as shown in Figure 1. For the four selected actions, the patient will do it for 1 ~ 2 times under the guidance of the rehabilitation physician, and then start formal collection. Each action will be repeated 3 ~ 5 times according to the patient’s physical condition. The patient’s action data collected by the acceleration sensor will be wirelessly transmitted to the PC client through ZigBee to complete the visualization and classified storage of the data.
3.2. Fugl-Meyer Shoulder and Elbow Score Prediction Model
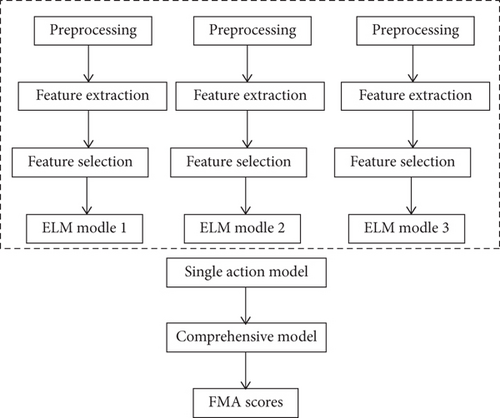
After preprocessing, feature extraction, and feature selection, the original data is input into the ELM model. Firstly, the prediction model of a single action is established, and then the regression relationship between the prediction result of a single action and the score of the doctor is established to obtain the comprehensive prediction model. Figure 3 shows the overall process of the algorithm.
3.3. Feature Extraction
The original collected signal is filtered by 9-point median filter to remove the interference caused by clothing friction, sensor looseness and wireless channel noise. Then, according to the experimental and theoretical analysis and previous experience, some statistical features (such as amplitude, mean value, root mean square, approximate entropy, etc.) and physical features (such as energy features, speed and angle) are extracted from the filtered signal. These features reflect the completion of the patient’s upper limb movement to a certain extent, including the amplitude, speed, smoothness and coordination of the movement. All the extracted features are shown in Table 2.
| Description | Number |
|---|---|
| Acceleration amplitude AMP | 2×3 |
| Root mean square value of acceleration RMS | 2×3 |
| Root mean square value of reciprocal acceleration JERK | 2×3 |
| MEAN acceleration MEAN | 2×3 |
| Acceleration approximate entropy ApEn | 2×3 |
| Energy characteristic ENE | 2 |
| Maximum speed Vmax | 2 |
| Speed average Vmean | 2 |
| Standard deviation of speed Vstd | 2 |
| Velocity approximate entropy VapEn | 2 |
| Angle max anglemax | 2 |
Where n is the sequence length. X, Y and Z represent the quantity of fractional acceleration on the three axes.
3.4. Feature Selection
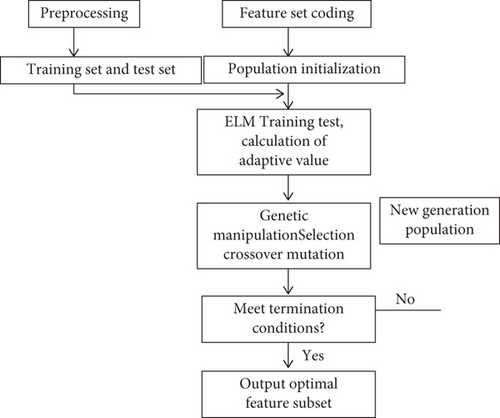
Where represents the result of 10 fold cross validation of prediction error of ELM model established for the feature subset corresponding to individual . After the fitness function is determined, the evolution process is carried out according to the fitness value of each individual in the population. After repeated iterations of “selection, crossover and variation”, individuals with large fitness value are continuously found until the termination condition is met, as shown in Figure 4. In genetic algorithm, the strategy of retaining the optimal fitness individual is adopted, that is, the individual with the highest fitness value is directly incorporated into the next generation population without “selection, crossover and mutation” operation.
4. Results and Discussion
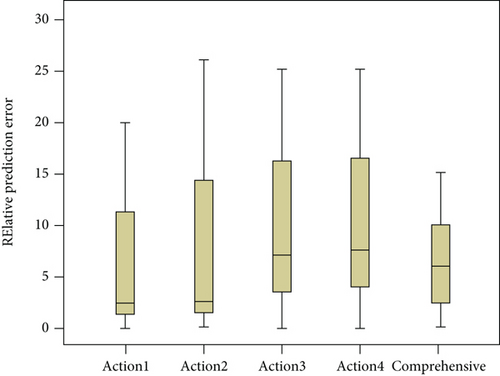
The optimal feature set selected for each action is the independent variable, and the corresponding score is the dependent variable. After normalization, it is input into the ELM model. The sigmoidal function is selected as the activation function, and the number of hidden layer nodes is set to 10. First, use a single action to predict Fugl-Meyer’s shoulder and elbow joints score, and then consider that Fugl-Meyer scale is a standard scale that has been clinically verified for many years, and there is not much correlation between its actions. Using the data of one action to predict the total score is bound to bring large errors, and the weighted average of the predicted results of the four movements alone can predict the shoulder and elbow score of UE-FMA more accurately. Therefore, for each patient, a regression relationship is established between the single action prediction results and the doctor’s score to obtain the final comprehensive prediction model, and the comprehensive prediction results are compared with the single action prediction results. Figure 5 shows the prediction results of single action model and comprehensive model for 35 patients using leave one subject out cross validation (i.e. taking one patient as the test set and the rest as the training set in turn). It can be seen that the error of comprehensive prediction is relatively small and concentrated compared with single action prediction. Table 3 lists the root mean square error (RMSE) and standard deviation (STD) of the prediction errors of 35 patients. The RMSE values predicted by the four singl actions were nearly 10% of the total score (30 points). With the comprehensive prediction model, the predicted RMSE value can be reduced to 2.6 points, accounting for 7.2% of the total score, which is less than the prediction error of any single action. The standard deviation of the comprehensive prediction error is also the smallest, indicating that the comprehensive prediction model is more stable, which is consistent with Figure 5.
| Prediction model | RMSE | RMSE/total | STD |
|---|---|---|---|
| Action 1 individual prediction | 2.64 | 8.8 | 2.64 |
| Action 2 individual prediction | 2.83 | 9.4 | 3.32 |
| Action 3 individual prediction | 4.72 | 15.7 | 5.13 |
| Action 4 individual prediction | 3.89 | 13.0 | 4.24 |
| Composive prediction | 2.16 | 7.2 | 2.15 |
Hsueh et al. [18] determined that the minimum detectable change (MDC) of Fugl-Meyer upper limb motor function rating scale was 7.2 points, accounting for 10.9% of the total score. MDC is the minimum threshold to identify whether the change exceeds the random test error, and the random error is often caused by different evaluators’ different understanding of the evaluation standard or different evaluation time and space. MDC reflects the allowable range of evaluation error of clinical application scale to a certain extent. The prediction error of the comprehensive prediction model proposed in this paper for the shoulder and elbow score of UE-FMA is 2.16 points, accounting for 7.2% of the total score. Within this range, it shows that the result is clinically acceptable.
Patel team [15, 19] has done a lot of research on the use of motion sensors in clinical evaluation, but they mainly focus on the Wolf motor function test (WMFT); They uses six acceleration nodes to collect data, selects a single WMFT action, and establishes a multiple linear regression model to predict the shoulder and elbow score of Fugl-Meyer scale. The minimum prediction error is 2.35 points. The same acquisition device was used to select 8 WMFT actions to automatically predict the score of Fugl-Meyer scale. However, WMFT often requires high motor coordination ability, and needs specific tools to complete the test. It is rarely used in clinical practice in China, and it is difficult for patients to complete home rehabilitation. Our study directly selects actions from Fugl-Meyer scale, uses fewer sensor nodes to predict the shoulder and elbow score of Fugl-Meyer scale, and obtains more accurate prediction results. Compared with WMFT, the actions selected from Fugl-Meyer scale can be completed directly by patients without any additional experimental conditions, which is easier to realize in home rehabilitation evaluation.
In home rehabilitation or community rehabilitation, patients can accurately record the actual situation of upper limb motor function during training by wearing acceleration sensors, and feed back to remote rehabilitation doctors to help doctors formulate individualized and professional rehabilitation treatment plans, so as to maximize the recovery of upper limb motor function. It can also be used to evaluate the efficacy of different rehabilitation treatment techniques. However, there is still a lack of evaluation of wrist and hand function. In future work, sensors that can reflect the wrist and hand function state (such as bending sensor) will be used to collect wrist and hand movement data, and a model will be established to predict the score of Fugl-Meyer wrist and hand part, so as to more comprehensively and carefully reflect the whole upper limb movement function of the patient. In the future, other deep learning models will be used [20, 21].
5. Conclusions
This study combines the motion sensor with the clinical evaluation scale, and uses four actions to accurately and automatically predict the shoulder and elbow joints score of UE-FMA, breaking through the limitations of subjectivity and time-consuming in the traditional evaluation and the dependence on rehabilitation doctors or therapists. It was initially shown that the acceleration sensor can be used to automatically predict shoulder and elbow scores on the Fugl-Meyer upper extremity motor function rating scale, enabling automation, objectification, and quantitation of rehabilitation assessments.
Conflicts of Interest
The authors declare no conflict of interest.
Funding
This study has not received financial support.
Open Research
Data Availability
The data used to support the findings of this study are available from the corresponding author upon request.


