Research on the Design Safety Factor of the Supporting Falsework Considering the Installation Gaps
Abstract
In order to fully consider the influence of the top installation gaps on the axial forces of the vertical poles during the erection of the supporting falsework, a finite element model of the 25 vertical poles considering the top gap element was established based on a large number of field measured data of the top installation gaps. The size of installation gap in this model considered two kinds of distribution: uniform distribution and random distribution. The uniform distribution value of the gap was 1.4mm and the value interval of the random distribution was [0, 0.7] and [0, 1.4]. The numerical simulation results showed that the axial forces of the vertical poles were uniformly distributed without considering the top installation gaps of the vertical poles. When considering the top gaps of the vertical poles, the calculation results of the two distribution types showed that the axial forces were non-uniform distribution and the maximum axial force of the pole increased by 2.3 times. Besides, according to the measured test data of the axial forces of a certain engineering project, the distribution law of the vertical pole’s axial forces in the actual project was also analyzed and the results showed that the maximum value of the axial force was about twice the minimum value. Since it is impossible to ensure that the elevations of the top of the vertical poles are exactly the same during the actual erection of the falsework, the top installation gaps are inevitable. When designing the bearing capacity of the falsework, the influence of the top installation gaps on the axial forces of the vertical poles should be fully considered. The recommended safety factor range of the bearing capacity of vertical pole is 1.7-2.1.
1. Introduction
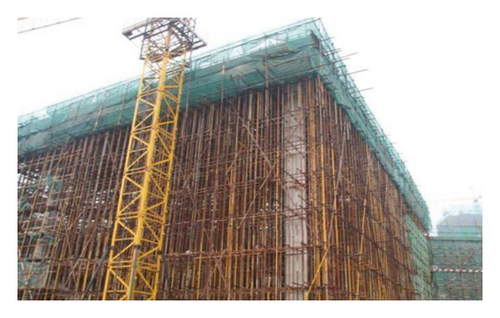
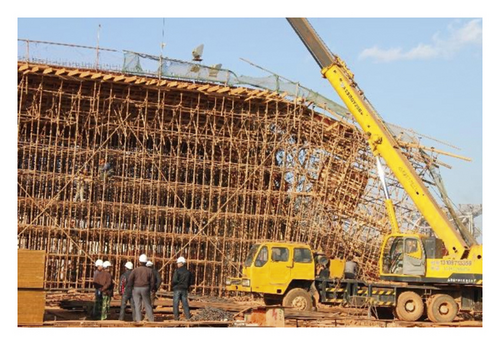
Shoring falsework is an indispensable temporary support system for horizontal members (beams and slabs) in the concrete pouring process on site and the clear definition of falsework was given by P.F. Pallett in his book advance concrete technology [1]. When designing this kind of shoring falsework system, the safety of the temporary structure system and its economy must be considered. Over considering the safety of falsework will lead to very small erection spacing of vertical poles, large erection workload and high construction measure expense, as shown in Figure 1. However, too much pursuit of the economy of the frame can easily lead to the reduction of the safety margin of the frame and whole collapse of the frame will appears under some unexpected loads, as shown in Figure 2.
In order to fully consider safety and economy in the scheme design of shoring falsework system, the best practice currently in designing the system is to use the load capacity recommended by the manufacturers based on load tests under standardized conditions. Chen [2] and Wu [3] performed loading tests on single-bay system falseworks in structural testing lab and obtained the load capacity under various test conditions. Comparing and analyzing their test results, it is found that even if the erection dimensions of the tested frames are exactly consistent, the test results of the actual measured bearing capacity will have a deviation of 25%. The reasons for the deviation had also been fully discussed in the literature [2, 3], including the deviation of the cross-section, the deviation of the elastic modulus of materials and the loading methods. Although Peng et al [4] pointed out that the elastic modulus and cross-section parameters of the frame members should be measured before the frame bearing capacity tests, it is unreasonable to conduct a large number of tests in order to accurately obtain its ultimate bearing capacity before the design of each shoring falsework system. According to Dewobroto et al. [5], the experimental loading tests on shoring falseworks are relatively costly and very risky and he recommended to adopt the direct analysis method (DAM) that considers second-order elasticity to analyze the bearing capacity of the support and to obtain the load-displacement curve during the loading process. Peng et al. [6] combined the actual measurement and numerical simulation model modification of multiple whole frame tests and proposed that the second-order inelastic analysis method that considers the semi-rigid joints of the shoring falsework horizontal rod and pole connection node can be adopted to determine the ultimate load capacity of the support.
It is a feasible method to use computer-aided numerical analysis to determine the bearing capacity of the shoring falsework. The corresponding numerical simulation model can be established according to the frame structure in the actual erection plan and the random variables such as geometric imperfections and joint stiffness proposed by Chandrangsu et al. [7] can also be considered in this model. However, Zhang et al. [8] pointed out that the geometric imperfections and joint stiffness in the numerical model are difficult to be determined accurately. Monte Carlo simulation method should be introduced to conduct statistical analysis on the influence law of random variables to further determine the reliability of shoring falsework.
However, it is impossible to carry out a large number of actual measurement tests or numerical simulation analysis of random variables before the formulation of the support work frame scheme of the actual project. Therefore, member-based allowable stress design (ASD) method has been applied to the design of steel falseworks such as the BS 5975 [9] and GB 51210 [10]. At the same time, the safety factor for the design of falsework has been proposed, that is, the design value of the bearing capacity of the support work frame is equal to the ultimate load capacity of a single pole divided by the safety factor. Sexsmith et al. [11] pointed out that the characteristics of shoring falsework as a temporary structure should be fully considered during the falsework design and the value of safety factor should be reasonably determined. The safety factor values given by different national codes are different. The safety factor of the British Standard is 2.0and the Chinese code GB51210-2016 requires that the comprehensive safety factor to be no less than 2.2 in the design of the shoring falsework frame. The Australian code requires that the comprehensive safety factor to be no less than 2 [12] and the minimum safety factor of falsework accessories given in the US code is 2-3 [13].
Most researchers believe that the value of the safety factor mainly considers the influence of variations of geometric and mechanical parameters, joint stiffness, initial geometric imperfections, yield stress and load eccentricity on the calculated value of the axial force of a single pole. This paper focuses on the installation gaps on the top of the vertical poles, which certainly exist in the actual erection process of the shoring falseworks, and studies its influence on the axial forces of the vertical poles to determine the safety factor of the shoring falsework design more accurately and reasonably.
2. Analysis of the Gaps at the Top of the Vertical Poles
The force of the vertical pole was still an ideal design model. However, in actual construction, the force of the poles can hardly reach the ideal design models due to the construction deviation. Especially, the gaps in the erection process cannot be avoided, resulting in unequal forces of the vertical poles.
The composition and load transfer of the falsework should be analyzed firstly. The load on the upper part of the falsework is transmitted to the adjustable U-shape joint through the plyform, the secondary flute and bearer stringer. Then, the U-shaped adjustable support transfers the load to the vertical pole and the vertical pole transfers the load to the foundation through the batten or I-beam. Figure 3 shows the load transfer path of the falsework support.
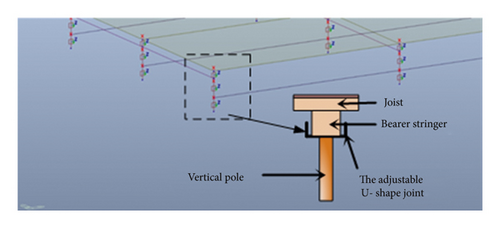
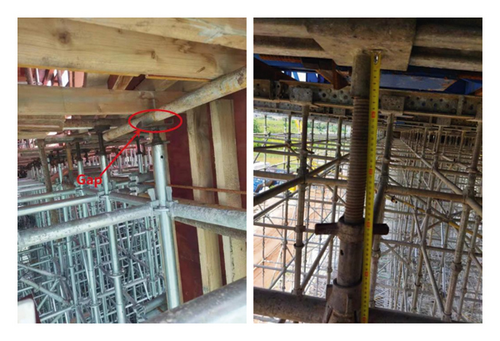
According to the composition of the falsework and the load transfer path, there is a gap between the vertical pole and bearer stringer during the erection process, which cannot be avoided. Figure 4 shows the gap between the adjustable support on the top of the vertical pole and bearer stringer. The gaps between the 25 vertical poles and bearer stringer were measured on site and the measurement results showed that the size of gaps was different. As shown in Table 1, the maximum and minimum gaps are 1.4 mm and 0 mm and the average gap is 0.6 mm. The gaps at the top of the vertical poles are inevitable but they have been ignored, which can cause the unequal distribution of the axial forces of the vertical poles. The actual axial forces of the vertical poles are deviated from the ideal force model, which cannot be accurately calculated during the design process.
| Pole number | Pole 1 | Pole 2 | Pole 3 | Pole 4 | Pole 5 |
|---|---|---|---|---|---|
| Gap (mm) | 0.98 | 0.7 | 1.4 | 0.14 | 0.14 |
| Pole number | Pole 6 | Pole 7 | Pole 8 | Pole 9 | Pole 10 |
| Gap (mm) | 1.26 | 0 | 0.84 | 1.26 | 0.14 |
| Pole number | Pole 11 | Pole 12 | Pole 13 | Pole 14 | Pole 15 |
| Gap (mm) | 0.84 | 0.28 | 0.98 | 0.14 | 0.14 |
| Pole number | Pole16 | Pole 17 | Pole 18 | Pole19 | Pole 20 |
| Gap (mm) | 0.42 | 0.56 | 0.98 | 0.28 | 0.56 |
| Pole number | Pole 21 | Pole 22 | Pole23 | Pole 24 | Pole25 |
| Gap (mm) | 0.7 | 0.56 | 0.14 | 1.4 | 0.14 |
3. The Numerical Analysis of the Influence of Installation Gap
3.1. The Finite Element Model
- (1)
Establishing vertical poles, horizontal poles, main flutes and secondary flutes. The vertical and horizontal span of the vertical poles was 900mm × 900mm, while the step distance was 1500mmand the length of the cantilever at the top was 450mm. The template support was analyzed according to a 5-row × 5-column model.
- (2)
Setting cross-section characteristics. The vertical and horizontal poles adopted Ø60.3mm × 3.2mm and Ø48.3mm × 2.5mm steel pipe, respectively and the steel material was Q235 steel.The Q235 grade I10 I-beam steel was used as bearer stringer. The joist adopted 50mm × 100mm wooden beams.
- (3)
Setting constraints. The bottoms of the poles were set as hinge constraints. Semi-rigid nodes were used between the horizontal poles and vertical poles and the stiffness of the nodes was 86kN·m/rad referred to the Chinese code “Technical Specification for the Safety of Socket Type Disc Scaffolding in Construction” JGJ231-2010. The calculation and analysis model of the falsework is shown in Figure 5.
- (4)
Setting the gaps at the top of the vertical poles. In the calculation model, the gap element were used to simulate the gaps between the top of the vertical poles and the I-beams.
- (5)
Applying the loads. The influence of the gaps at the top of the vertical poles on the axial forces of the vertical poles was mainly studied in this paper. In the calculation and analysis, since the load transfer was mainly from bearer stringers to the support poles, the upper load of the falsework support was applied to the I-beam in the form of linear load. The linear load at bearer stringers was 20kN/m for calculation and the self-weight coefficient is 1.
- (6)
Setting up nonlinear analysis. The failure form of the falsework is mainly instability failure. In the calculation and analysis, large deformation and large deflection of the model need to be considered, so the nonlinear analysis is required. This model only considered geometric nonlinearity. The calculation method was Newton-Raphson and the number of loading steps was 10. The number of iterations in the sub step was 30. The convergence condition adopted displacement control and the control value was 0.01mm.
- (7)
Performing equal gaps and random gaps analysis on the calculation model.
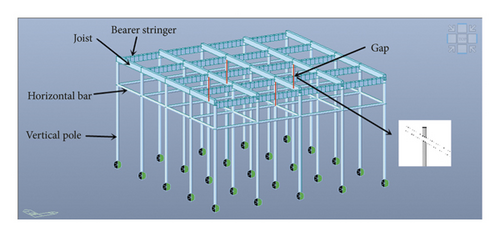
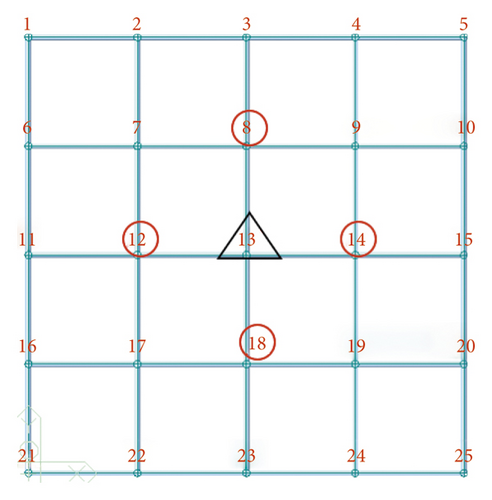
To facilitate analysis, the vertical poles were numbered and the numbering diagram is shown in Figure 6.
3.2. Equal Gaps Analysis
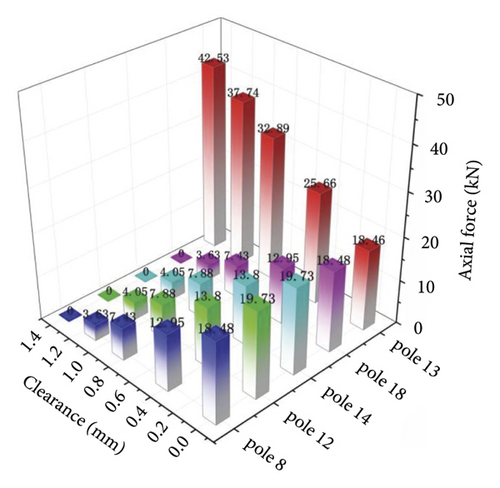
This study took the effect of the measured maximum gaps of the vertical poles 8, 12, 14 and 18 on the axial forces of the pole 13 as an example to study the most adverse effect of the top installation gaps on the axial forces of the vertical poles. According to the measured data Table 1, the maximum gap at the top of the vertical poles was 1.4mm. At the same time, in order to find the influence of the size of the gaps on the axial forces of the vertical poles, the variation law of the axial forces of the vertical poles 8,12,14 and18 were studied respectively when the installation gap was 0 mm,0.42 mm, 0.84 mm, 1.12 mm and 1.4 mm.
- (1)
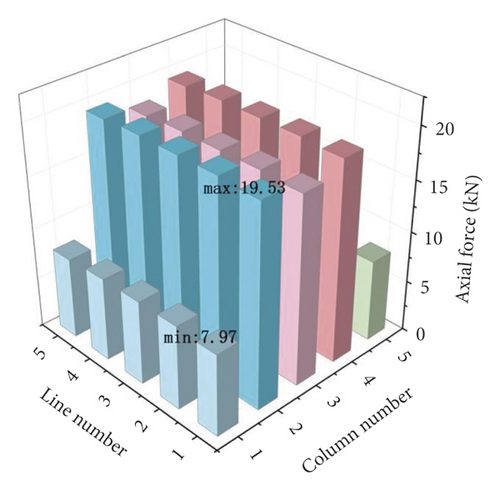
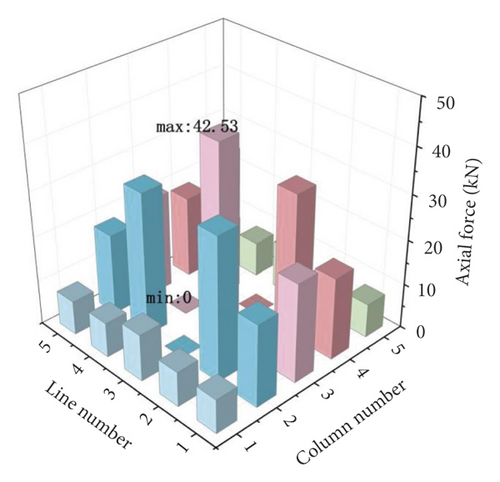
Figure 7 shows the axial forces distribution of the vertical poles when there are no installation gaps at the top. It can be found that the axial forces of the surrounding vertical poles was small due to the small loads. The axial forces of the vertical poles in the middle part were relatively equal. Figure 8 shows the axial force distribution of the poles 8, 12, 14 and 18 when the installation gaps were 1.4 mm. The maximum and minimum axial forces of the 25 poles were 42.53 kN and 0 kN, respectively.
- (2)
Figure 9 shows the change of the maximum axial forces in the falseworks when there were gaps between the four vertical poles and their main flutes. With the increase of the top installation gaps, the axial forces of poles 8, 12, 14 and 18 gradually decreased from 18.48kN, 19.73kN, 19.73kN and 18.48kN to 0, respectively. The axial force of pole 13 gradually increased from 18.46kN to 42.53kN, which was 2.3 times that without gap.
3.3. Random Gap Analysis
The influence law of the top installation gaps on the axial forces of the vertical poles can be clearly seen through the equal gap. However, according to the field measurement data, it can be found that the gaps at the top of the vertical poles are uncertain, so this section uses a random function to generate random gaps to study the influence range.
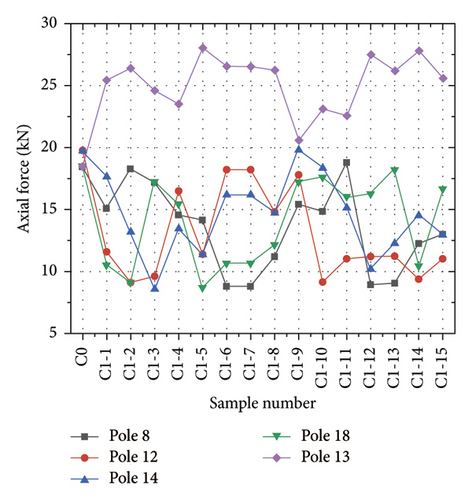
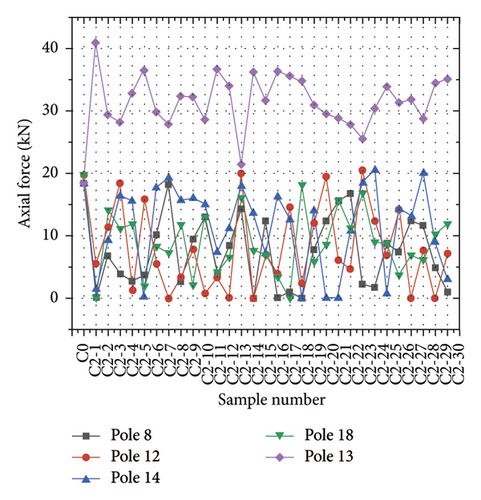
According to the calculation in the previous section, when the gap is greater than 1.4mm, the corresponding vertical pole will not be stressed, so the interval [0-1.4] was used as the gap analysis interval. At the same time, in order to compare the influence of different gap intervals on the axial force of the vertical poles, 0.7, the middle value of interval [0-1.4], was set as the dividing point. Therefore, the top installation gap interval was set as [0-0.7], in which a random function was used to generate 15 groups of samples and the sample numbers were C1-1to C1-15. Since the interval range of [0-1.4] was twice larger than [0-0.7], the number of random samples was increased to 30 groups and the sample numbers were C2-1∼C2-30. The sample number of the vertical pole without gap was C0.
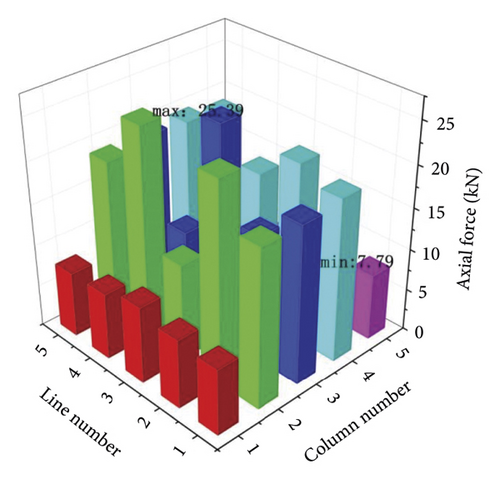
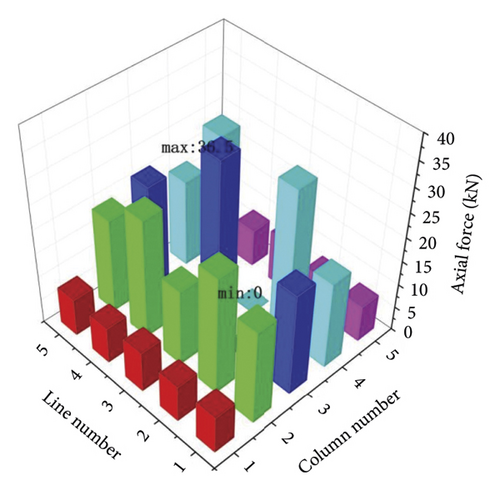
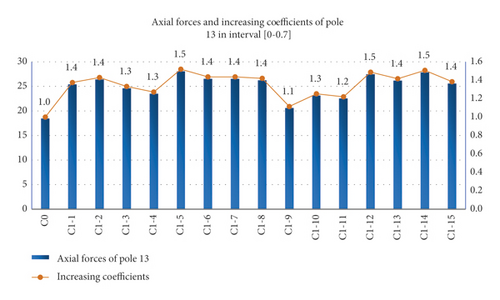
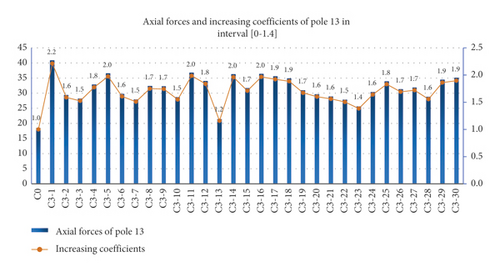
Through the geometric nonlinear finite element model, the axial forces of the vertical poles in the interval [0-0.7] and interval [0-1.4] were obtained, as shown in Figure 10 and Figure 11. When there were gaps between the pole 8, 12, 14, and 18, the axial forces decreased and the axial force of the pole 13 increased. It can be found from Figure 10 that the minimum and maximum axial force of the pole 13 in the interval [0-0.7] were 20.58kN and 28.05kNand the average was 25.36kN. It can be found from Figure 11 that the minimum axial force of the pole 13 in the interval [0-1.4] was 21.41kN, while the maximum was 40.88kN, resulting in the average was 31.78kN. The sample C1-1 in the gap interval [0-0.7] and the sample C3-5 in [0-1.4] can be used to analyze the distribution law of the random gaps to the axial forces of the vertical poles. The axial force distribution of the 25 vertical poles in the sample C1-1 is shown in Figure 12. It can be found that the maximum value of the axial force was 25.39kN and the minimum value was 7.79kN. Figure 13 shows the axial force distribution of the 25 vertical poles in the sample C2-5. It can be found from Figure 13 that the maximum axial force of the pole was 36.5kN and the minimum axial force was 0kN.
In order to quantify the effect of gaps on the axial forces of the vertical poles, the concept of increasing coefficient is introduced, that is, the ratio of the maximum axial force of the pole with gap to the axial force of the pole without gap. The axial forces of the pole 13 with random gaps in the interval [0-0.7] and [0-1.4] were analyzed to calculate the increasing coefficient, as shown in Figure 14 and Figure 15. It can be found from Figure 14 that the minimum value of the axial force increasing coefficient of the pole 13 in the interval [0-0.7] is 1.1, while the maximum value is 1.5and the average value is 1.4. It can be found from Figure 15 that the minimum value of the axial force increasing coefficient of the pole 13 in the interval [0-1.4] is 1.2and the maximum value is 2.2,resulting in the average value is 1.7.
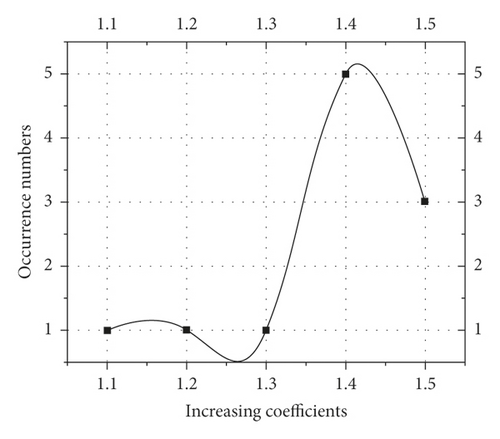
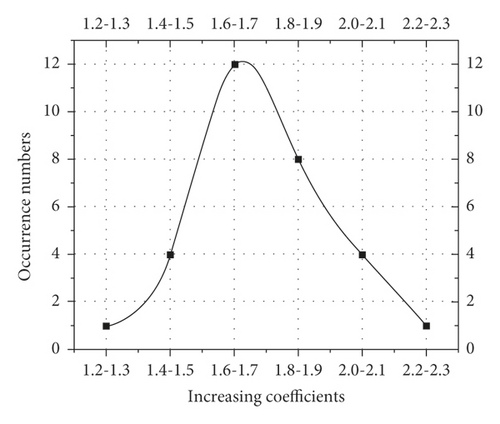
The occurrence numbers of the increasing coefficients of pole 13 ’s axial forces in interval [0-0.7] were counted by the interval of 0.1, while in interval [0-1.4] they were counted by the interval of 0.2. A spline curve was used to fit the statistical results and the fitted curves are shown in Figure 16 and Figure 17. It can be found that the occurrence numbers of the increasing coefficients of pole 13 ’s axial forces in different gap intervals were normally distributed. Table 2 shows the average value, standard deviation and coefficient of variation. It can be seen that the maximum coefficient of variation of the increasing coefficient for pole 13’s axial forces is 12.35%, indicating that the degree of variation of this data is small [14].
| gap interval | Average value μ | Standard deviation σ | Coefficient of Variation Cυ |
|---|---|---|---|
| [0-0.7] | 1.4 | 0.1 | 7.86% |
| [0-1.4] | 1.7 | 0.2 | 12.35% |
Under the normal distribution curve, the iterative method was used to obtain an area of 95.449974% in the horizontal axis interval (μ-2σ, μ+2σ), that is, the probability of X falling outside (μ-2σ, μ+2σ) was less than 5%. Generally, the event with probability less than 5% is called “small probability event”, which can be considered as almost impossible in a single test. Therefore, when the support frame is designed with a single pole bearing capacity, safety factor μ+2σ has a 95% guarantee rate and the safety factor of average value μ has a 50% guarantee rate. According to the measured data, the gap interval [0-1.4] is more in line with the actual situation, so the average value μ and μ+2σ of the interval [0-1.4] are used as the design safety factors for the bearing capacity of a single pole. According to Table 2, μ+2σ of the gap interval [0-1.4] was 2.1.
4. Field Test
In order to verify the reliability of the analysis results of the established model, an axial forces test of vertical poles was carried out on the support frame system with a concrete slab thickness of 2.5m. A special sensor for axial force test was installed on the top of the vertical pole in the pouring area to test the change of the axial forces during the pouring process. The axial force test sensor of the vertical poles is shown in Figure 18.
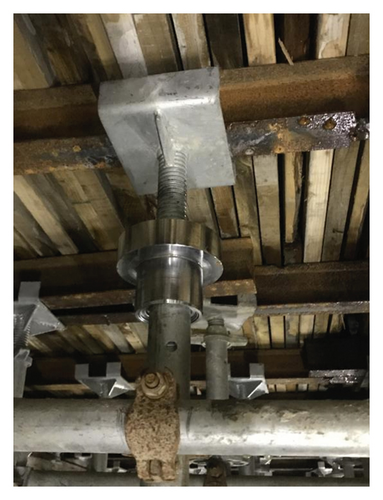
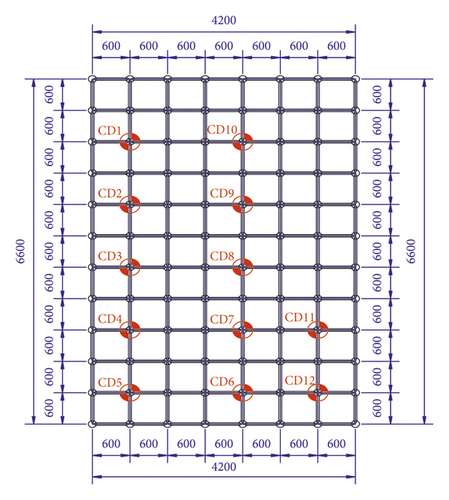
It was found that there were gaps at the top of the vertical poles. Part of the vertical poles were selected for axial force test and a total of 12 axial force measuring points were arranged. Figure 19 shows the measuring point of the vertical pole.
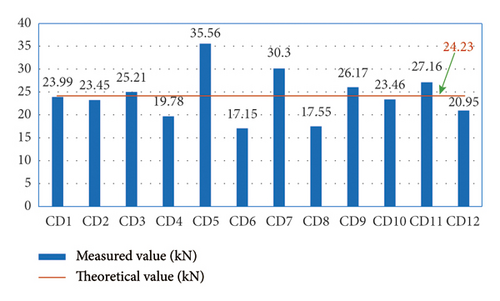
After the concrete casting was completed, the axial force values of the vertical poles at the corresponding measuring points were obtained, as shown in Figure 20. According to the theoretical model, the axial force values of the single vertical poles were the same and the calculated average value was 24.23kN. From the measured axial force in Figure 20, it can be found that the maximum axial force of a single vertical pole was 35.56kN and the minimum was 17.15kN. Among the 12 poles, there are 5 poles whose axial forces were greater than the calculated average value. The maximum axial force of a single vertical pole was 2.1 times of the minimum value, which was 1.5 times of the calculated average value. The actual measurement results reflected that the gaps of vertical poles have a great impact on the axial force of the vertical poles, which verifies the reliability of the research content in this paper.
5. Summary
- (1)
During the research process, a large number of field measurements of the installation gaps at the top of the vertical poles were carried out and the distribution law and value intervals of the measured gaps were analyzed.
- (2)
Based on the field measured data, a finite element model of the supporting falsework with 25 poles considering the top gap element was established. The size of the gap in the model considered two types of distribution, equal and random distribution, respectively. In the equal distribution, the value of the gap was taken as 1.4mm. The gap intervals were taken as [0,0.7] and [0,1.4] in the random distribution. The influence of the top gaps on the axial forces of a single pole was analyzed by numerical simulation. The results showed that the axial forces of the vertical poles will be equally distributed without installation gaps, which is called the average value. If the gaps are equally distributed, the axial forces of vertical poles increased with the increase of the top gaps. When the gap of adjacent poles reaches 1.4mm, the axial force of the vertical poles without gaps will be 2.3 times the average. When the random distribution interval of the top gap of adjacent vertical poles is [0-0.7], the maximum axial force of the vertical pole without gap at the top is 1.5 times the average value. The maximum axial force of the pole without gap at the top is 2.2 times the average value when the random interval is [0-1.4].
- (3)
Combined with the actual measurement test of the axial forces of the vertical poles of a certain engineering project, the axial forces of partial vertical poles in the shoring falsework were measured on site and the measured values were compared with the calculated average values. The results showed that the measured maximum axial force value of the vertical poles is 2.1 times the minimum value, which is 1.5 times the calculated average value.
- (4)
The installation gaps at the top of the poles certainly exist because of the erection and installation procedure of the shoring falsework. Therefore, when the single pole stability bearing capacity design method is used to determine the bearing capacity of the entire frame, the value of the comprehensive safety factor should further consider the influence of top installation gaps. The suggested value range of the safety factor is 1.7-2.1.
Conflicts of Interest
The authors declare that they have no known competing financial interests or personal relationships that could have appeared to influence the work reported in this paper.
Authors’ Contributions
Yongquan Wang: Methodology, Formal analysis, Writing-original draft. Tianfu Li: Validation, Visualization, Investigation. Kaifa Dong: Supervision, Funding acquisition. Zhengxing Guo: Investigation, Conceptualization, Resources, Project administration. Jing Fu: Investigation.
Acknowledgments
This work was supported by School Level Scientific Research Fund Project of Nanjing Institute of Engineering (YKJ201928), and the Science and Technology Planning Project of the Ministry of Housing and Urban Rural Development (2019-K-165), and the Basic Science (NATURAL SCIENCE) Research Project of Colleges and Universities in Jiangsu Province (21KJD560007).
Open Research
Data Availability
The data used to support the findings of this study are included within the article.


