Feature Fusion for Weld Defect Classification with Small Dataset
Abstract
Detecting defects from weld radiography images is an important topic in the field of nondestructive testing. Many intelligent detection systems are constructed based on computer. Feature extraction is critical for constructing such system to recognize and classify the weld defects. Deep neural networks have powerful ability to learn representative features that are more sensitive to classification. However, a large number of samples are usually required. In this paper, a stacked autoencoder network is used to pretrain a deep neural network with a small dataset. We can learn the hierarchical feature from the network. In addition, two kinds of traditional manual features are extracted from the same set. These features are combined into new fusion feature vectors for classifying different weld defects. Two evaluation methods are used to test the classification performance of these features through several experiments. The results show that deep feature based on stacked autoencoder network performs better than the other features. The classification performance of fusion features is better than single feature.
1. Introduction
As a basic technology, welding is widely used in many areas, such as aerospace manufacturing, bridge engineering, and mechanical manufacturing. Due to the complexity of the welding process, the instability of the welding parameters, or the influence of the welding stress and deformation in the structure, welding defects are inevitable, such as the lack of penetration, porosity, slag inclusion, and crack. The appearance of welding defects directly affects the quality of welding products, which causes the failure of welding structure and even safety accidents. Therefore, it is necessary to detect and classify the welding defects.
Detection of welding defects is an important task of nondestructive testing of welding materials. Among them, X-ray testing is the most common preferred technique for examining the quality of welded joints. For this, experienced workers need to inspect the defects from the radiography film generated in X-ray testing. This process is not only time-consuming but also subjective [1]. Many scholars have been committed to building an objective and intelligent detection systems for weld defects. Such system based on digital radiography images often involves feature extraction and pattern recognition.
Feature extraction from weld images is the core of intelligent detection systems. According to the investigation, D’ Angelo and Rampone [2] pointed out that the key to the system for recognizing the structure defects is to extract the features that can express the defects more uniquely. The pattern recognition is conducted for classifying different types of defects. In the initial testing, the geometrical and the texture features are commonly used for classifying the weld defects [3–7]. The geometrical features which describe the shape and orientation of defects are usually defined by experts. Boaretto and Centeno [5] extracted several geometrical features (area, eccentricity, solidity, ratio, etc.) from the discontinuities detected in weld bead region. Then, a multilayer perceptron (MLP) was used to classify discontinuities as defect or no-defect through these features and achieved an accuracy of 88.6%. In addition, they also tried to classify the different defects, but the attempt was not successful because of the unbalanced data. In these works, the geometric features extracted by different scholars are not the same. Kumar et al. [7] used texture features based on the gray level cooccurrence matrix (GLCM) as input features of back propagation (BP) neural network, achieving a classification accuracy of 86.1%. Furthermore, they simultaneously extracted both texture and geometric features, eventually achieving an accuracy of 87.34% [8]. Wang and Guo [9] extracted three numeral features from potential region and used support vector machines (SVM) to distinguish real defects from potential defects. The physical meaning of each feature is different. In addition, the Mel-frequency cepstral coefficients and polynomial coefficients were used as the classification features in weld detection [10, 11]. These features can be collectively known as manual features. However, the manual extraction of features has significant drawback: it is task intensive [12]. The extracted features are inconsistent, and it is difficult to find the general features for varying task.
Recently, deep learning has been a significant breakthrough in image analysis and interpretation. The popular deep learning techniques including deep belief network (DBN), recurrent neural network (RNN), and convolutional neural network (CNN) have attracted increasing attention and become the popular tools for fault diagnosis and defect detection [13–15]. These networks can automatically extract the features without any hand operation for detecting the weld images. The classification performance of deep features through deep neural network is better [16]. However, the deep CNN got poor classification performance when the training dataset is small [17]. This is just because of the characteristic of deep learning: the good performance of deep networks benefits from the training by lots of data. However, it is not easy to collect big dataset of weld defects because the resolution of radiography image for weld seam is usually high. Stacked autoencoder (SAE) [18] is proposed as an alternative to restricted Boltzmann machine (RBM) [19, 20] in pretraining [21, 22]. SAE is used to pretrain a deep neural network with a small dataset. In our work, we use SAE for pretraining and fine-turning strategies to train a deep neural network (DNN).
In this paper, we applied information fusion technology to combine different features for weld defect classification. The workflow of classification is given in the following parts. Firstly, feature extraction is discussed in Section 2. HOG features and texture features are introduced. In addition, a SAE network is constructed to learn multilevel features. Moreover, we investigate pretraining and fine-turning strategies to get better features. Secondly, in Section 3, the above features are combined with each other. Thirdly, an experiment about weld defect classification is shown in Section 4. In this part, we investigated the classification performance of different kinds of features and fusion features. The experiment results are discussed, and suggestions are given for future research in Section 5.
2. Feature Extraction
Different defects in radiography image exhibit various visual properties in shapes, sizes, textures, and positions. In order to recognize various defects, the important features of the specific type of defects should be artificially selected. The characteristics based on intensity contrast are very useful to classify weld defects because of different gray value distributions of different defect types. In this section, two traditional manual features based on gray level distribution are introduced. In addition, a feature learning technology based on DNN is elaborated.
2.1. HOG Feature Vector
Histograms of oriented gradient (HOG) descriptors based on a statistical evaluation of a series of normalized local gradient direction histograms of the image window are first proposed by Dalal and Triggs for human detection [23]. They capture the gradient or edge direction characterizing the appearance and shape of the local objects. They are robust to small changes in image contour locations and directions and significant change in image illumination. The features of descriptors are extracted as discriminative and separable as possible. In this paper, the HOG features are used for presenting the local weld defect in radiography images. The flowchart of algorithm is shown in Figure 1.

2.2. Texture Feature Vector Based on GLCM
where D is the inverse difference moment reflecting the homogeneity of the image texture and measuring the local amount of variations of the texture.
2.3. Feature Based on Learning through SAE
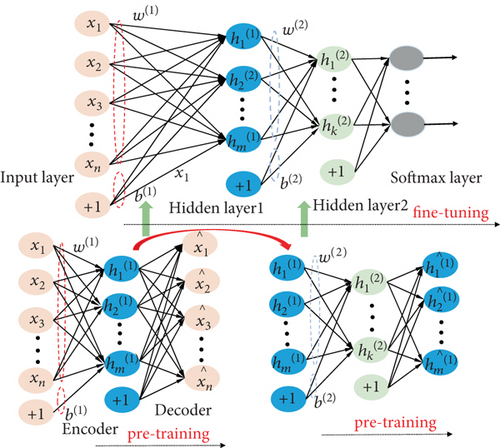
As is shown in Figure 2, we construct a deep neural network (100-50-5) by stacking two AEs and a softmax layer for supervised learning. The network initializes the parameters by training each AE layer by layer. Once the pretraining of AE is finished, the decoder is discarded. The activation of previous AE in hidden layer is the input of the next AE. For best parameter, the fine-tuning step is implemented by supervised learning through training set.
3. Feature Fusion
It is critical to select appropriate features to classification of weld defects. Silva et al. [27] pointed out that the mass of features used for classification is more important. The weld defects are usually distributed in the local space of the radiography images with linear, circular, and other irregular shapes. The HOG feature is sensitive to gradient and direction; thus, it focuses on describing the structure and contour of objects. The HOG description has strong ability on identifying local regions. The Haralick feature based on GLCM describes the texture of the image by counting the frequency of pixel pairs with a particular relationship. The two kinds of features with specific physical significance are useful for classifying the defects. However, it is not sufficient to describe the image comprehensively by using each single feature. In addition, the DNN can learn hierarchical features automatically; however, physical significance of these features is undefined. For a more comprehensive description of the objects, we tried to fuse these features.
The workflow of weld classification in this paper is shown in Figure 3. Firstly, the weld defects are segmented. Secondly, the samples with defects are formed. Thirdly, two manual features are extracted. Meanwhile, the SAE networks are trained and fine-tuned for learning feature. Finally, the fusion features are imported into the SVM for classification. Our work mainly focused on the steps which are encircled by the green rectangular box (feature extraction and fusion).
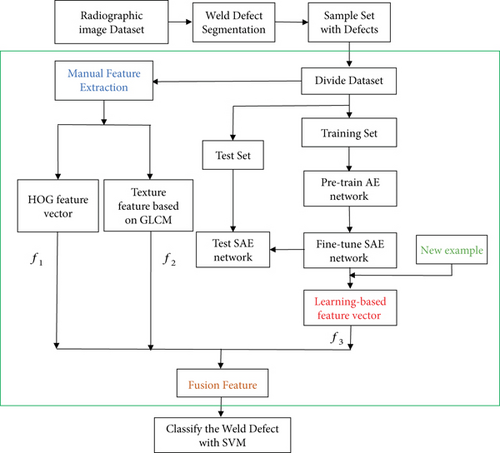
As is shown in Figure 3, there are two ideas of fusion: one is the fusion of two different manual features, and the other one is the fusion of manual features and learning-based features. Characteristic-level fusion is adopted, which involves various feature extractions of images and then integrates the different feature vectors. In the extraction for HOG feature vector f1, the cell size is 4 × 4. Thus, the dimension of the vector is 1 × 5184. For the texture feature based on GLCM f2, the mean and standard deviation of 14 features are calculated in 3 different distances. Thus, the dimension of the vector is 1 × 84. We obtain the vector (1 × 5) in the softmax layer for learning-based feature based on SAE f3. The parameters used in network are: λ = 4e − 3 and β = 3. The fusion feature is noted asffusion = [fi, fj], i ≠ j.
4. Experimental Results and Discussion
In this section, several experiments are implemented based on MATLAB for investigating the classification performance of different features. Datasets, evaluation methods, and results of experiments are introduced.
4.1. Experimental Database
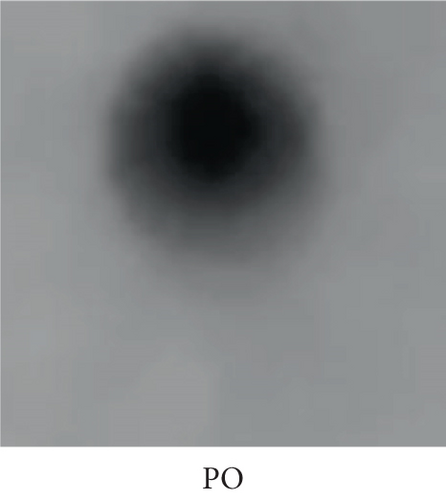
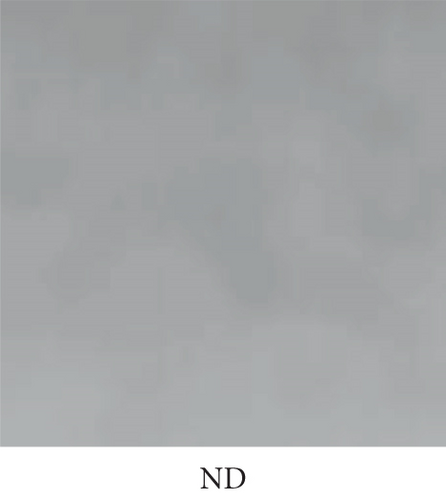
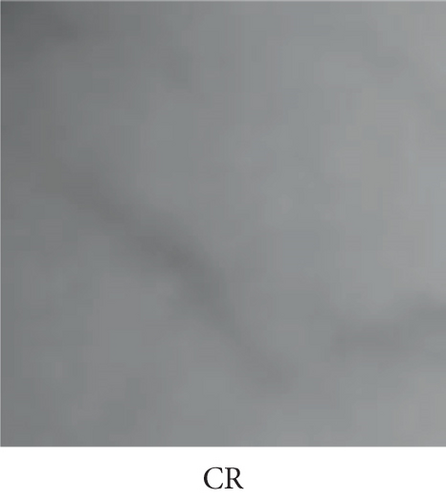
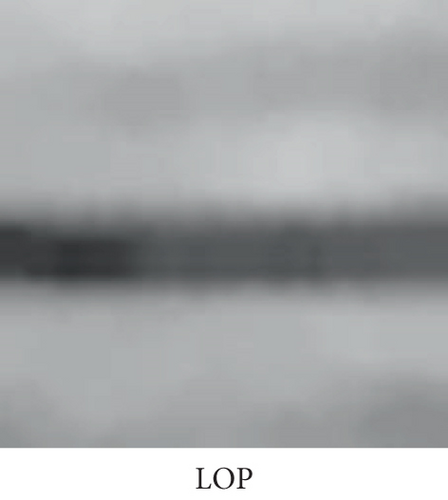
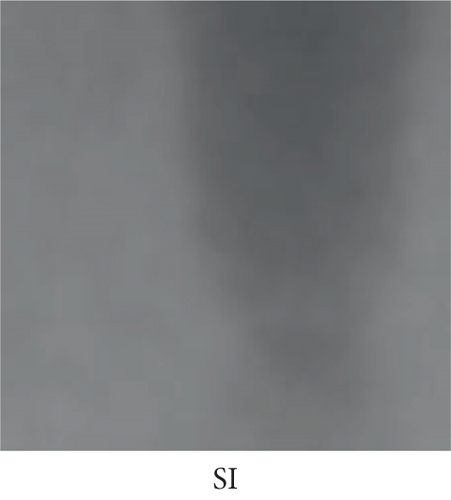
The database for subsequent learning is from the “welds” group in a public database called GDXray [28]. An example of radiography images is shown in Figure 4(a). Morphological analysis is used in this paper for segmented weld defects. The processed result is shown in Figure 4(b). Based on the results, we cropped the patches with defects to form a Dataset _RUS [16]. In our previous work, we used CNN for defect classification on this dataset; however, the result is not good. Dataset _RUS includes 6,160 cropped image patches with different weld defects, including lack of penetration (LOP), porosity (PO), slag inclusion (SI), and crack (CR). The patches without defect are noted as ND. Some samples with different defects are shown in Figure 5. The dataset is divided into the training set and testing set on a scale of 7 : 3 for later experiments. The sample numbers of each defect patches are shown in Table 1.


| Defect types | Number in training set | Number in test set |
|---|---|---|
| CR | 868 | 372 |
| IP | 839 | 360 |
| ND | 868 | 372 |
| PO | 868 | 372 |
| SI | 869 | 372 |
| Total | 4312 | 1848 |
4.2. Results of Visualization
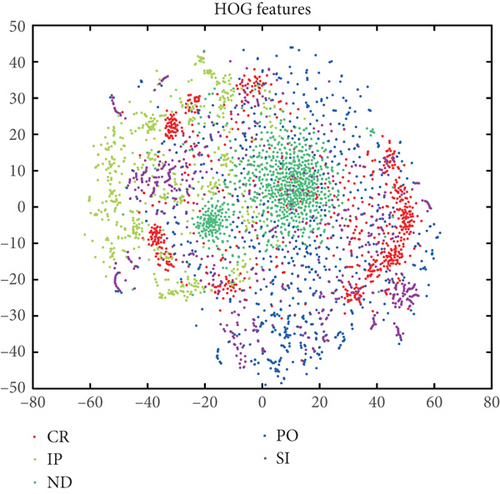
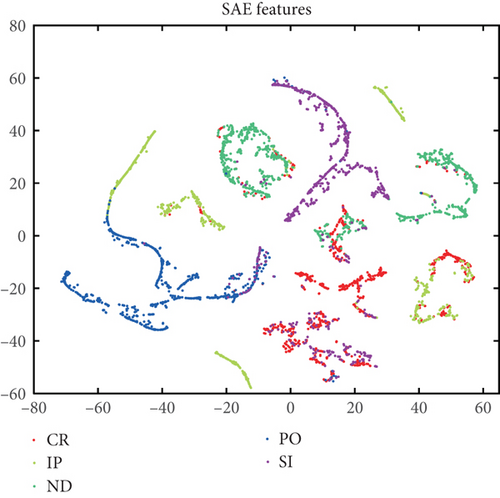
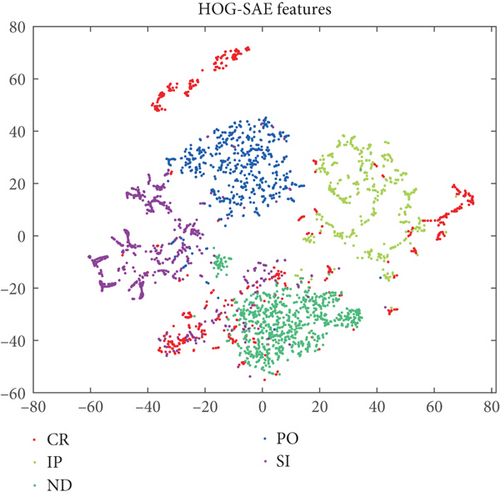
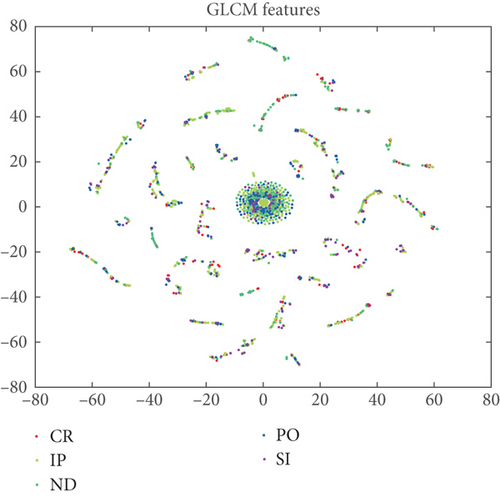
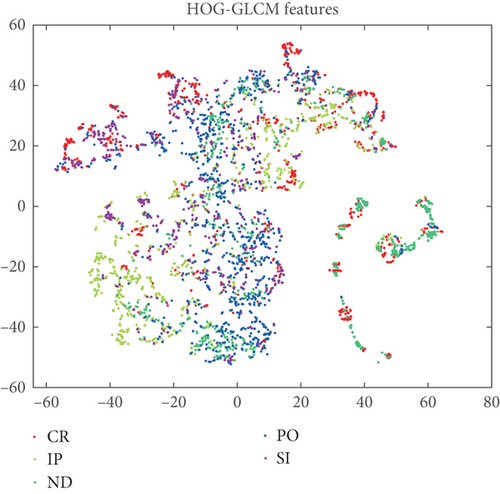
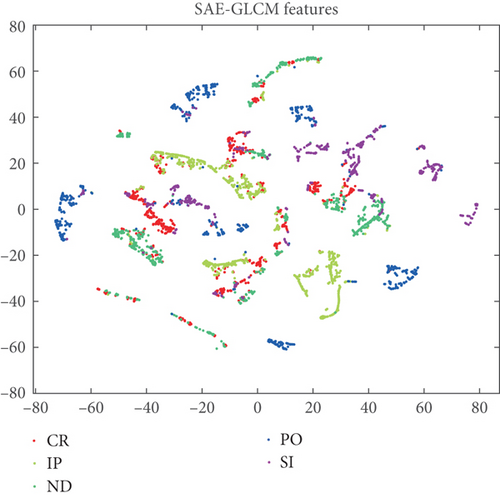
We extract the HOG feature vector, texture feature vector based on GLCM, and learning-based feature from 4312 patches (training set). In order to show the performance of the abovementioned features and fusion features more intuitively, the t-SNE method is used for visualizing the features through 2D maps. The t-SNE distribution maps of features are shown below.
The t-SNE method shows the high-dimensional data in low-dimensional maps. Thus, the dimension of data should be considered in fusion. The dimension of HOG feature is too high, and PCA algorithm is adopted beforehand to reduce the dimension to 5. Then, it is fused with a SAE feature, namely HOG-SAE feature. Figures 6 and 7 show the distribution of single HOG feature and SAE feature. Figure 8 shows the distribution map of the fusion feature. In terms of the color distribution, the separability of fusion feature is better.
For texture features, we select 5 listed in Section 2 showing the t-SNE distribution map in Figure 9. The distribution of texture feature is rambling. From the visual effects, the conclusion is that the deep features perform better than manual features for classification (this is consistent with our previous result). Then, the feature vector is fused with HOG feature and SAE feature, namely HOG-GLCM feature and SAE-GLCM feature. The t-SNE distribution maps are shown in Figures 10 and 11. Compared to the single GLCM feature, the performance of fusion feature improved. However, it is not noticeable when comparing with HOG feature or SAE feature from the visual effect. To evaluate the performance of each feature more objectively, a quantitative evaluation method is needed.
4.3. Results of SVM Classification
Support vector machine (SVM) is developed based on the statistical learning theory, which is suitable for use in solving high-dimensional classification problems with small samples. Thus, it is popular in the classification and diagnosis of weld defects in recent years [29, 30]. In this paper, SVM is used to build the relation model concerning features and weld defects. To reduce the training time, the kernel function of the SVM adopted is linear. The classification performance of the features is evaluated through accuracy rates and their mean of various types. The classification rates are shown in Table 2.
| Feature types | CR | LOP | ND | PO | SI | Mean |
|---|---|---|---|---|---|---|
| GLCM feature | 75.2% | 63.2% | 74.3% | 75.2% | 61.7% | 73.2% |
| HOG feature | 69.1% | 84.7% | 86.6% | 74.7% | 69.1% | 76.8% |
| SAE feature | 79.8% | 91.1% | 94.6% | 78.8% | 74.2% | 83.7% |
| HOG-GLCM feature | 80.9% | 95.6% | 79.3% | 87.6% | 96.0% | 87.8% |
| HOG-SAE | 83.3% | 93.9% | 89.5% | 84.9% | 86.8% | 87.7% |
| SAE-GLCM | 92.7% | 88.3% | 91.9% | 92.5% | 98.9% | 92.9% |
The classification ability of deep features is stronger than the manual features. However, the DCNN networks perform poorly when the sample set is small [17]. In this paper, the accuracies of different single features in the table demonstrate that the learning feature based on SAE network performs better than the manual features. This is consistent with the above analysis.
The classification performance of fusion feature with two different features is better than that of single features. Among them, the fusion feature of texture feature based on GLCM and learning feature based on SAE (SAE-GLCM feature) perform best. The average accuracy achieves 92.9%.
The table shows the separability of three single features clearly. Based on this, we try to apply different weights on each feature during fusion, namely ffusion = [k1fi, k2fj], i ≠ j, k1 + k2 = 1. Several experiments are set to test the classification performance of three fusion feature vectors with different weights. The results are shown in Tables 3–5.
| k1 | CR | LOP | ND | PO | SI | Mean |
|---|---|---|---|---|---|---|
| 0.6 | 80.6% | 95.3% | 92.7% | 89.8% | 93.0% | 90.3% |
| 0.7 | 89.0% | 94.7% | 92.5% | 89.0% | 91.9% | 91.4% |
| 0.8 | 87.1% | 93.6% | 92.5% | 88.4% | 91.4% | 90.6% |
| 0.9 | 84.7% | 92.5% | 90.6% | 87.9% | 89.5% | 89.0% |
| k1 | CR | LOP | ND | PO | SI | Mean |
|---|---|---|---|---|---|---|
| 0.6 | 83.6% | 95.0% | 93.8% | 85.8% | 83.9% | 88.4% |
| 0.7 | 84.7% | 93.6% | 93.3% | 85.8% | 80.4% | 87.5% |
| 0.8 | 83.9% | 92.5% | 93.0% | 84.4% | 75.8% | 85.9% |
| 0.9 | 82.3% | 91.7% | 93.0% | 84.1% | 73.1% | 84.8% |
| k1 | CR | LOP | ND | PO | SI | Mean |
|---|---|---|---|---|---|---|
| 0.6 | 94.4% | 94.2% | 97.0% | 93.5% | 98.1% | 95.5% |
| 0.7 | 94.9% | 95.0% | 97.0% | 93.3% | 97.6% | 95.6% |
| 0.8 | 93.3% | 94.7% | 97.3% | 93.3% | 96.0% | 94.9% |
| 0.9 | 92.5% | 94.4% | 95.7% | 92.2% | 94.9% | 93.9% |
From the tables, it is obvious that the classification accuracies of fusion features with weights improved, especially the fusion of SAE feature and GLCM feature (SAE-GLCM feature). The best accuracy achieves 95.6%.
5. Conclusion and Future Work
Considering that deep convolutional neural networks are not suitable for the classification of small sample sets, a SAE network is used to learn feature from the patches of radiography images for classifying the weld defects in this paper. Meanwhile, two kinds of different manual features are extracted. In order to express the objectives more comprehensively, we fuse the features for combining different information. The t-SNE distribution of these features and their fusion feature is shown in figures for intuitive display. We use SVM to classify the weld defects for evaluating the performance of the different features objectively. The results demonstrate that the fusion features perform better than the single features on the classification ability. The fusion of texture feature based on GLCM and learning feature based on SAE network has the best performance. The classification power of the feature vectors becomes stronger when the fusion is weighted. However, the performance promotion of fusion of HOG feature and SAE feature is limited. This may result from the large difference in the dimensionality of the two features.
In the future, we will consider optimizing the weight adopted in fusion. The fusion model will be used to the entire X-ray image for detection of defects.
Conflicts of Interest
The authors declare no conflicts of interest.
Acknowledgments
This project was funded by the National Natural Science Foundation of China (No. 51805006) and Anhui Agriculture University (rc412005 and k2041005).
Open Research
Data Availability
The data that support the findings of this study are available from the corresponding author upon reasonable request.


