Estimation of Groundwater Quality in Arid Region or Semiarid Region by Using Statistical Methods and Geographical Information System Technique
Abstract
This study takes place in year of 2021 during the premonsoon and postmonsoon seasons and twenty water samples were collected. Chemical factors like chloride, fluoride, sulphate, nitrate, and phosphate were measured in water samples. There is a significant difference in anion dominance between pre- and postmonsoonal (PRM and POM) water samples. The following anions are and . In both seasons, particular way of cations is Na+ > Ca2+ > Mg2+ > K+. SAR, Kelly’s ratio, residual sodium carbonate, potential salinity, permeability index, and sodium percentage were used to evaluate the irrigation water quality. To investigate the geochemical regulation and hydrogeochemistry of groundwater, two approaches were used: according to the findings, groundwater in various parts of the investigation was determined to be unfit for human consumption.
1. Introduction
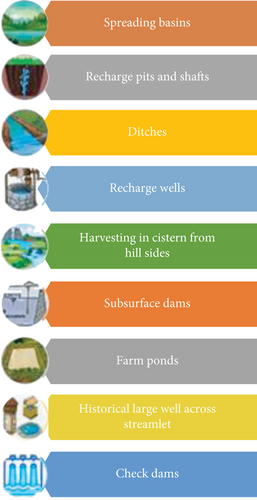
Most rural and urban residents depend on groundwater as their prime supply of drinking water when the monsoons fail and surface water is sparse [1]. The use of agricultural fertilizer, which adds to groundwater contamination, increases as the population expands. Because of the sluggish movement of the aquifer’s cycle, groundwater aquifer poisoning can last for decades. Groundwater’s suitability for drinking and irrigation is influenced by soluble salts and many other factors [2–4]. There are many factors that influence the amount of soluble salts in a rock, such as the mineral content, the type of soil, the climate, and the drainage properties of the soil. Quality irrigation water is extremely important to agriculture [5]. Poor irrigation water has a negative impact on plant development and productivity, as well as the soil’s condition [6–8]. When irrigation water quality is examined, groundwater resources are better to be managed for recharging and properly utilization as shown in Figure 1 [9].
The physical, chemical, and biological properties of groundwater must be assessed before it may be used for drinking, irrigation, or industrial reasons [10–12]. A semiarid climate with annual rainfall ranging from 724 to 913 mm characterizes the study area furthermore [13, 14]. Rainwater harvesting for both domestic and agricultural use is insufficient. Borewell water is the primary source of supplies for the community’s needs, including drinking, irrigation, and industrial applications [15, 16]. It was looked into if groundwater could be used for drinking, irrigation, or industrial uses. Numerous studies investigating the quality of the groundwater and the presence of important ions have been conducted [17–20].
2. Methodology
Around the industrial area, twenty areas were chosen to be sampled. During both seasons, water samples are gathered in 2 litres polypropylene beakers at premonsoon (PRM) and postmonsoon (POM) sites. The sampling sites are placed six kilometers apart, i.e., one station is six kilometers from the next. The samples were examined in accordance with APHA’s normal procedures.
2.1. Index of Water Quality (WQI)
- (i)
Metrics are given weights (w) based on how important they are to one’s health
- (ii)
The second step is used equation (1) to determine the relative reputation of each constraint
- (i)
The (qi) scale of quality evaluation is calculated in the following equation
- (i)
Suffix index (SI) is computed for the ith parameter and is in the following equation
2.2. Water Quality in Irrigation
3. Results and Discussion
Table 1 lists the highest, smallest, and average concentrations of several water quality parameters for PRM and POM conditions. There are many classifications for electrical conductivity in addition to total dissolved solids, chloride, fluoride, and also overall hardness.
| Range | Class | The number of samples | Station number on a sliding scale | % | |||
|---|---|---|---|---|---|---|---|
| PRM | POM | PRM | POM | PRM | POM | ||
| EC Wilcox | |||||||
| <250 | Outstanding | 0 | 0 | 0 | 0 | 0 | 0 |
| 250-750 | Good | 1 | 1 | 19 | 18 | 5 | 5 |
| 750-2000 | Allowable | 10 | 13 | 13, 9, 15, 7, 18, 14, 2, 17, 1, 3 | 9, 11, 15, 0, 17, 19, 7, 1, 3, 14, 16, 6 | 45 | 50 |
| 182000-5000 | Unsure | 8 | 6 | 8, 6, 5, 16, 10, 2, 12, 13, 12, 4 | 8, 5, 10, 12, 2, 4, 13 | 40 | 30 |
| >5000 | Unfitting | 0 | 0 | 0 | 0 | 0 | 0 |
| TDS (mg/L) classification Davis and Dewiest | |||||||
| <500 | Suitable for consumption | 1 | 2 | 11, 19 | 18, 11, 9 | 8 | 13 |
| 500-1000 | Allowable to consume alcohol | 8 | 9 | 15, 9, 18, 7, 14, 0, 17, 1, 3 | 15, 1, 17, 7, 19, 3, 1, 14, 16, 6 | 40 | 45 |
| 1000-3000 | Irrigation-friendly | 8 | 6 | 8, 6, 5, 16, 10, 2, 12, 13, 4 | 8, 5, 10, 12, 13, 2, 4 | 40 | 30 |
| >3000 | Drinking water and irrigation are both unsafe | 0 | 0 | 0 | 0 | 0 | 0 |
| Stuyfz and classification of chlorides | |||||||
| <5 | Actual oligohaline | 0 | 0 | 0 | 0 | 0 | 0 |
| 5–30 | Oligohaline | 1 | 0 | 18 | 0 | 4 | 0 |
| 30–150 | Fresh | 4 | 4 | 11, 1, 7, 14, 9 | 7, 9, 18, 7, 17 | 20 | 20 |
| 150–300 | Fresh-brackish | 4 | 6 | 18, 17, 12, 17, 8 | 19, 0, 15, 14, 12, 3, 16 | 20 | 30 |
| 300–103 | Brackish | 8 | 7 | 3, 0, 2, 6, 7, 14, 4, 13, 10 | 8, 6, 11, 5, 3, 4, 13, 10 | 40 | 35 |
| 103-104 | Brackish-salt | 0 | 0 | 0 | 0 | 0 | 0 |
| 104–2 × 10⁴ | Salt | 0 | 0 | 0 | 0 | 0 | 0 |
| >2 × 10⁴ | Hyperhaline | 0 | 0 | 0 | 0 | 0 | 0 |
| Total hardness classification | |||||||
| 0–75 | Soft | 5 | 5 | 4, 3, 7, 19, 1, 11 | 4, 7, 19, 18, 1, 17 | 25 | 25 |
| 75–150 | Abstemiously tough | 7 | 10 | 8, 17, 14, 10, 5, 18, 0 | 9, 0, 8, 14, 16, 11, 15, 2, 3, 5, 6 | 30 | 50 |
| 150–300 | Tough | 5 | 2 | 5, 12, 3, 16, 13, 6 | 12, 13, 10 | 25 | 10 |
| >300 | Very tough | 1 | 0 | 10 | 0 | 5 | 0 |
| Chaturvedi fluoride classification | |||||||
| <0.5 | Caries in the teeth | 5 | 6 | 18, 5, 15, 3, 0, 6 | 10, 5, 18, 19, 9, 11, 17 | 25 | 20 |
| 0.5–1 | Maximum permissible limit | 1 | 10 | 10, 19 | 3, 6, 0, 8, 7, 14, 16, 15, 13, 4, 12 | 5 | 50 |
| 1–3 | Fluorosis of the teeth | 5 | 1 | 17, 16, 7, 9, 14, 8 | 2, 1 | 25 | 5 |
| 3–4 | Bones that are stiff | 3 | 0 | 1, 11, 12, 13 | 0 | 15 | 0 |
| >4 | Knee deformities are a common occurrence. | 1 | 0 | 2,4 | 0 | 5 | 0 |
| >10 | Skeletal fluorosis | 0 | 0 | 0 | 0 | 0 | 0 |
3.1. Drinking Water Quality Parameters
Premonsoon pH values range from 7.0 to 8.5, whereas postmonsoon pH values range starts 6.97 to 7.72. Premonsoon EC values range starts 360 to 3910μS/cm, and POM EC values range starts 650 to 3910μS/cm, respectively. PRM TDS concentrations range starts 218 to 1685 mg/L, while POM concentrations range starts 347 to 1760 mg/L. Prior to the monsoon, fluoride concentrations range from 0 mg/L to 8.78 mg/L. Each of the 20 samples was analyzed and found to be under the permitted limit, with 40% of them falling inside the limit [22, 23]. Fluoride levels in the environment are high due to weathering of rocks, as well as the use of fertilizers, pyrotechnics, and match manufacturing. Nearly 90% of samples show a significant decrease in fluoride concentration following the postmonsoon rains [24–26]. Fluoride levels in postmonsoon water are low because precipitation dilutes groundwater. Premonsoon levels of nitrate in most Southeast Asian towns and cities are less than 1 mg/L. Postmonsoon season saw a considerable decrease of mosquito populations in the northern areas. The regional distribution of fluoride exceeding the BIS allowed limit is depicted in the premonsoon plot. Dental fluorosis affects 30% of PRM and 10% of POM seasons, according to [27, 28]. There is a correlation between low level calcium and high-level bicarbonate alkalinity in groundwater, according to [29]. One of the most fluoride (8.78 mg/L) and the second-highest amount (4.96 mg/L). The PRM ranges from 214 mg/L to 2112 mg/L in alkalinity, while the POM extends from 230 mg/L to 1600 mg/L; in both cases, 92% of samples exceed 380 mg/L. In comparison to the PRM season, water samples taken after the monsoon show a decreased concentration of bicarbonate. The PRM and POM values for sulphate vary from 4 to 1278 mg/L, respectively. Only 38% and 8% of PRM and POM water samples, respectively, exceeded the BIS acceptable sulphate limit (200 mg/L). The aerobic nitrification process, which transforms fertilizer ammonium sulphate into nitrate, gives it a high monetary worth. There are a wide range of values between 1 and 30 mg/L during the postmonsoon period [30]. After the postmonsoon, nitrate concentrations are low because rainwater dilutes it. A higher concentration of phosphate is found in the POM period than in the premonsoon period. Run-off detergents and sewage discharge are a couple of possible causes. Groundwater samples from PRM and POM periods show a range of 8 to 72 mg/L of calcium [31]. A total of all samples follows both WHO (121 mg/L) and the BIS (204 mg/L) standards. Magnesium across the spectrum from 2 to 35 mg/L before and after the monsoon, respectively. Premonsoon samples have a magnesium concentration of 10% higher than the BIS-acceptable level of 30 mg/L. The salt contents in the water varied between 8 and 94 mg/L during PRM and 7 to 78 mg/L after monsoon. In the last two seasons, there have been no infractions of the 200 mg/L restriction. Potassium concentrations range from 5 mg/L to 48 mg/L prior to the monsoon, while POM levels range from 3 mg/L to 32 mg/L.
3.2. Analysis of Correlation
Water quality metrics can be linked using correlation analysis. The relationship is perfect linear if correlation coefficient is closer 1.Among +0.8 and +1.0, there is an extremely significant correlation between the two variables. There is a moderate link between the “r” values of +0.5 to 0.8 and -0.5 to -0.8. If “r” is between -0.5 and +0.5, then, there is little connection between the two variables. Water quality metrics were correlated using correlation coefficients. R > 8 was considered in the linear regression equation.
3.3. Index of Water Quality (WQI)
The Water Quality Index is a statistic for assessing a body of water’s health. Tables 2, 3, and 4 show the WQI water categorization used in this investigation. WQI values in the range of 112–212 were discovered in 40% of PRM samples and 10% of POM samples, indicating that they were unfit for drinking. During the PRM season, 11% of the samples exhibit water quality concerns, making them unfit for consumption [32]. Rainwater mixing lowers the WQI values of all samples during the monsoon season, causing them to be lower than PRM.
| pH | EC | TDS | Cl- | TH | Ca2+ | Mg2+ | HCO3- | SO42- | F- | NO3- | PO4 | Na | K | |
|---|---|---|---|---|---|---|---|---|---|---|---|---|---|---|
| pH | 1 | |||||||||||||
| EC | -0.014 | 1 | ||||||||||||
| TDS | 0.014 | 1. 016 | 1 | |||||||||||
| Cl- | 0.078 | 0.583 | 10.578 | 1 | ||||||||||
| TH | 0.452 | 0.049 | 0.083 | 0.458 | 1 | |||||||||
| Ca2+ | 0.368 | -0.007 | 0.124 | 0.059 | 0.821 | 1 | ||||||||
| Mg2+ | 0.321 | 0.092 | 0.124 | 0.283 | 0.783 | 0.358 | 1 | |||||||
| HCO3- | 0.052 | 0.0412 | 0.386 | 0.093 | -0.029 | -0.021 | -0.051 | 1 | ||||||
| SO42- | -0.030 | 0.364 | 0.345 | -0.042 | -0.048 | -0.052 | -0.016 | 0.019 | 1 | |||||
| F- | 0.296 | 0.223 | 0.183 | -0.049 | 0.114 | 0.257 | -0.019 | 0.458 | 0.082 | 1 | ||||
| NO3- | -0.054 | 0.183 | 0.189 | 0.172 | -0.546 | -0.041 | -0.048 | 0.148 | -0.039 | -0.049 | 1 | |||
| PO4 | 0.049 | -0.026 | -0.029 | -0.04 | -0.058 | -0.042 | -0.052 | 0.052 | -0.061 | 0.162 | -0.040 | 1 | ||
| Na | 0.009 | 0.243 | 0.243 | 0.008 | 0.003 | 0.049 | 0.018 | 0.048 | 0.269 | 0.178 | 0.008 | 0.002 | 1 | |
| K | 0.098 | 0.021 | 0.019 | 0 | 0.031 | 0 | 0.104 | 0 | 0.058 | 0.039 | 0.007 | 0.029 | 0.016 | 1 |
| pH | 1 | |||||||||||||
|---|---|---|---|---|---|---|---|---|---|---|---|---|---|---|
| EC | 0.019 | 1 | ||||||||||||
| TDS | 0.025 | 0.982 | 1 | |||||||||||
| Cl- | 0.009 | 0.660 | 0.568 | 1 | ||||||||||
| TH | 0.188 | 0.261 | 0.212 | 0.430 | 1 | |||||||||
| Ca2+ | 0.242 | 0.152 | 0.118 | 0.290 | 0.430 | 1 | ||||||||
| Mg2+ | 0.216 | 0.159 | 0.132 | 0.282 | 0.862 | 0.241 | 1 | |||||||
| HCO3- | 0.058 | 0.552 | 0.548 | 0.284 | 0.036 | 0 | 0.008 | 1 | ||||||
| SO42- | 0 | 0.288 | 0.368 | 0.042 | 0.032 | 0.006 | 0.024 | 0.124 | 1 | |||||
| F- | 0.318 | 0.249 | 0.302 | 0.018 | 0 | 0.048 | 0.007 | 0.332 | 0.140 | 1 | ||||
| NO3- | 0.001 | 0.031 | 0.041 | 0.024 | 0 | 0 | 0.016 | 0.002 | 0.146 | 0.006 | 1 | |||
| PO4 | 0.002 | 0.130 | 0.118 | 0.36 | 0.251 | 0.192 | 0.0182 | 0.026 | 0.002 | 0.004 | 0.006 | 1 | ||
| Na | 0.058 | 0.334 | 0.314 | 0.091 | 0.128 | 0.023 | 0.072 | 0.105 | 0.232 | 0.243 | 0.026 | 0.003 | 1 | |
| K | 0.002 | 0 | 0.002 | 0 | 0.031 | 0 | 0.023 | 0.003 | 0.039 | 0.015 | 0.004 | 0.003 | 0.014 | 1 |
| A chemical metric | Weight (wi) | Weighted average (Wi) | WHO (2004) S |
|---|---|---|---|
| pH | 4 | 0.072 | 9.6 |
| TDS (mg/L) | 6 | 0.118 | 1100 |
| Cl- (mg/L) | 6 | 0.118 | 225 |
| TH (mg/L) | 3 | 0.046 | 500 |
| Ca2+ (mg/L) | 4 | 0.072 | 80 |
| Mg2+ (mg/L) | 4 | 0.072 | 35 |
| HCO3- (mg/L) | 4 | 0.072 | 360 |
| Na (mg/L) | 6 | 0.012 | 210 |
| K (mg/L) | 3 | 0.046 | 25 |
| SO4 (mg/L) | 6 | 0.012 | 210 |
| F (mg/L) | 6 | 0.012 | 1 |
| NO3- | 4 | 0.03 | 60 |
| Σwi = 56 | ΣWi = 0.682 |
3.4. Wilcox Plot
In the Wilcox plot, the data findings are plotted using the EC and SAR data. Before and after the monsoon, the majority of samples fell into the C3S1 zone. More than half of the PRM and POM samples contained the C3S1 zone, indicating high salinity and little sodium threat. A wide range of soil types can be irrigated using this type of water sample [33]. There was an extremely high salinity and low sodium hazard zone in samples from 30% of PRM samples and 25% of POM samples (C4S1). Plants with a high salt tolerance should be irrigated with C4S1 water. In both seasons, 5% of the samples are classified as belonging to the C2S1 zone. The remaining premonsoon samples were collected in the zones C4S2 and C3S2 (5%). In fine-grained soils with limited drainage, hydrating plants with C4S2 and C3S2 water are impossible.
3.5. Chadha Diagram
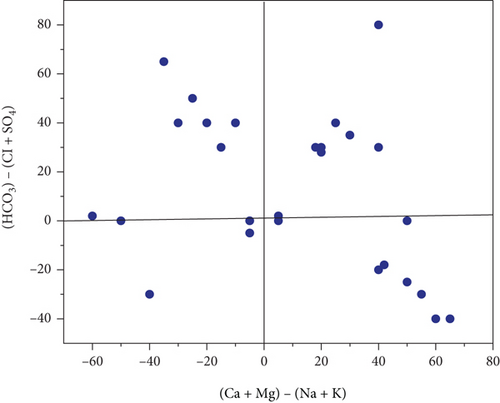
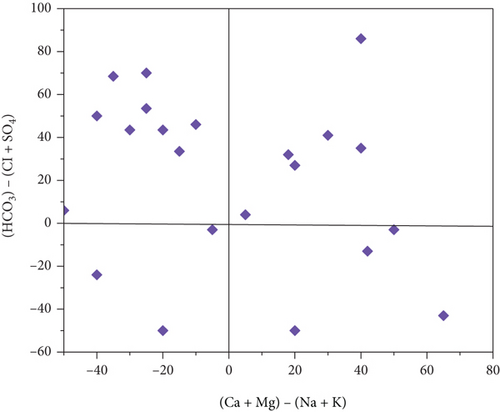
The hydrogeochemistry and water kinds are depicted in Chadha’s diagram. It was listed the proportion of water found in each of the fields described by [34]. Recharging waters make up 20% of the water samples collected in field 5 Ca2+-Mg 2+-HCO3-. There is a 50% rise in the POM period. The concentration of moderate acidic anions (as opposed to strong acidic anions) is higher in the POM period than in the PRM period. They have a short-term hardness due to the presence of dissolved CO3-in the form of bicarbonate in these types of water. Approximately 35% of the samples collected prior to the monsoon are in the sixth field and include water of the type, Ca-2+, Mg-2+, Cl-. The dominant Cl-type or Cl-dominant, Ca-2+, Mg-2+ type of water was found. When it comes to the postmonsoon season, however, this field receives only 25% of the total rain. In this sector, sodium is dissolved in water and then adsorbs onto mineral surfaces, which may explain why, Na+ + K+ is in excess to Ca2+ + Mg2+. Pre- and postmonsoon samples from field seven include 14 and 9% of the Na-+ and Cl-water type, respectively. 30% of water samples are field 8 in premonsoon conditions, with mild acidic anions greatly outnumbering strong acidic anions. It does, however, drop to 20% in the postmonsoon season. Figure 2 shows the diagram of Chadha is one of the most well-known in the field: (a) premonsoon and (b) monsoon.
3.6. Scatter Plot
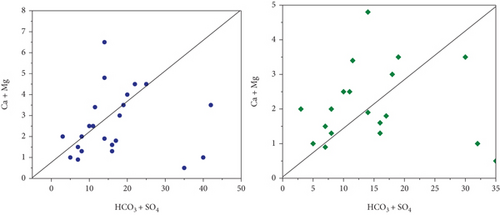
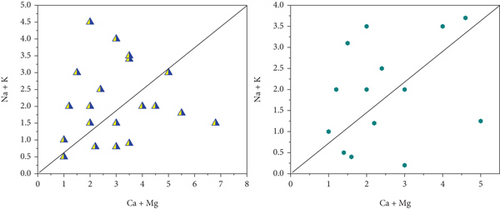
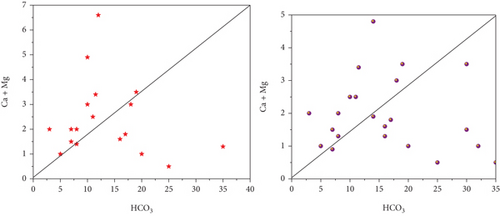
Na+ and Cl− were plotted against each other to create the scatter plot you see here. The graph illustrates which process predominate in the research area: mineral weathering, ion exchange, or halite dissolution [35]. In pre- and postmonsoon, 45 and 40% of sample concentrations are lower than the equiline, respectively. The fact that the molar ratio is greater than one indicates that Na+ has been liberated during the weathering of silicate (feldspar). Carbonate acid reacts with feldspar minerals, causing them to break down in water when silicate weathering occurs. There is halite dissolution if the ratio is equal to one. Carbonate weathering is responsible for 66% of PRM and 55% of POM samples falling a reading over the line that indicates high calcium and magnesium in the scatter diagram, (HCO3- + SO42-) vs. (Ca2++Mg2+). The reverse ion exchange mechanism in the shale bed exchanges water’s, Na+ for Ca2+ and Mg2+. Ionexchange dominates silicate weathering in PRM (35%) and postmonsoon (45%) samples, which are both below a line. 48% of the samples fall below and above the scatter plot’s line. Figure 3 shows the scatter diagram (a) HCO3 + SO4vs.Ca + Mg, (b) Ca + Mg vs.Na + K, and (c) HCO3 vs.Ca + Mg.
3.7. Irrigation Water Quality
As a result, all samples from the PRM and POM periods are suitable for irrigation in this study since the SAR value is less than 10 [36]. The higher-than-10 SAR values indicate that when water shrinks and expands, soil permeability in clayey soil diminishes. The groundwater can be divided into three categories according to Kelly’s ratio. Some of them are appropriate (less than 1) while others (between 1 and 2) are just marginally suitable for irrigation. A total of 10% and 5% of PRM and POM water samples, respectively, were discovered to be unfit for irrigation, using Kelley’s ratio. This classification was devised by [37] based on the residual sodium carbonate (RSC). Water samples are deemed dangerous during the PRM and POM periods. During the PRM, only 6% of water samples in the western section of the research region were of questionable quality. The majority of the remaining samples are those that cannot be irrigated. Because of their high salt concentration, 15% of the POM samples were mediocre, and the rest 85% are not suited for irrigation.
Tables 5 and 6 show the calculated potential salinity (PS). Water samples taken before the monsoon season had a salinity range of 0.5 to 24.2 meql-1, with a mean value of 9.6 meql-1. At postmonsoon period is an average 9.3 meql-1 ranging from 2.0 to 20.7. Water samples are categorized into three kinds based on their potential saltiness. Only 30% and 25% of PRM and POM water samples are of outstanding to good quality, respectively, during these seasons. There were 28% good to damaging samples, and the rest were unsuitable for irrigation in both seasons. Water samples have PI levels ranging from 60 to 260 meql-1 before the monsoon and PI values ranging from 74 to 240 meql-1 at monsoon. PI was used to classify the irrigation water by [38]. The vast majority of specimens in table are opted for monsoon irrigation with only 5% being unsuitable. In both seasons, the samples are completely impermeable. The SP value varies from 15 to 78 meql-1 before the monsoon and from 10 to 69 meql-1 after the monsoon. In one-quarter of the cases, water samples obtained before and after the monsoon are unfit for irrigation. Magnesium ratios in water samples ranged from 30 to 82 meql-1 during the pre- and post-POM phases. PRM and POM water samples with magnesium ratios less than 50% and 25%, respectively, fall into the “safe” group. As a result of pollution, none of the irrigation water samples left are valid at this time. Between 0.2 and 2.9 is the typical premonsoon calcium-to-magnesium ratio. Samples with Ca : Mg ratios of less than 1 comprise 60% of the samples, whereas those with ratios larger than 1 comprise 40%. A postmonsoon range of 0.3 to 3.1 is seen, with an average value of 0.78. Samples that include a Ca : Mg ratio of less than one makes up 70% while samples with a ratio larger than one make up 30%. Most samples (60% and 70%, respectively) have a ratio less than 1 in both seasons, the findings show. It has been shown that soil structure and agricultural productivity are negatively impacted by an increase in SAR. Useful for industrial uses, the corrosion ratio (CR) measures the corrosiveness of water. Before the rainy season, 85% of the water samples had a CR value less than 1, while after it, 95% of the samples had a CR value lower than 1. Table 7 provides irrigation water suitability guidelines. According to it, EC, K, and HCO3 exceed the parameter levels in all seasons, whereas sulphate surpasses the guideline value in PRM season. Water samples collected before and during the monsoon season are ideal for irrigation.
| Water type characteristics | Sample percentage | ||
|---|---|---|---|
| PRM | POM | ||
| Piper diagram subdivision | |||
| 1 | Alkalies (Na + k) outnumber alkaline earth (Ca + Mg). | 55 | 70 |
| 2 | Alkalies are more abundant than alkaline earths. | 35 | 20 |
| 3 | Weak acids (CO3 + HCO3) outnumber strong acids (SO4 + Cl). | 50 | 60 |
| 4 | Strong acids are more powerful than weak acids. | 40 | 30 |
| 5 | Type of magnesium bicarbonate | 20 | 45 |
| 6 | Type of calcium chloride | 5 | 0 |
| 7 | Type of sodium chloride | 10 | 10 |
| 8 | Type sodium-bicarbonate | 0 | 0 |
| 9 | Types are mixed | 55 | 35 |
| Parameter | Range | The water’s quality | Total number of samples | (%) | ||
|---|---|---|---|---|---|---|
| PRM | POM | PRM | POM | |||
| Ratio of sodium adsorption (in meql-1) | <10 | Excellent | 15 | 15 | 95 | 95 |
| 10-20 | Good | 0 | 0 | 0 | 0 | |
| 20-28 | Doubtful | 0 | 0 | 0 | 0 | |
| >28 | Unsuitable | 0 | 0 | 0 | 0 | |
| Kelly’s ratio (KR) is a mathematical formula (in meql-1) | <1 | Suitable | 12 | 16 | 62 | 82 |
| 1-3 | Marginal | 4 | 2 | 22 | 14 | |
| >3 | Unsuitable | 3 | 2 | 11 | 6 | |
| RSC stands for residual sodium carbonate (in meql-1) | <1.25 | Safe | 0 | 0 | 0 | 0 |
| 1.25-2.25 | Marginal | 2 | 4 | 6 | 16 | |
| >2.25 | Unsuitable | 20 | 18 | 96 | 85 | |
| PS stands for potential salinity (in meql-1) | <6 | Excellent to good | 7 | 6 | 32 | 25 |
| 6-12 | Good to injurious | 7 | 7 | 32 | 32 | |
| >12 | Injurious to unsatisfactory | 9 | 10 | 42 | 46 | |
| The permeability index (PI) is a measure of how permeable a material is (in meql-1) | >80 | Excellent | 20 | 20 | 95 | 90 |
| 30-80 | Good | 2 | 2 | 6 | 6 | |
| <30 | Unsuitable | 0 | 0 | 0 | 0 | |
| Sodium percentage (SP) is a measure of how much sodium is present in a given amount (in meql-1) | <25 | Excellent | 3 | 4 | 12 | 15 |
| 25-45 | Good | 8 | 8 | 35 | 30 | |
| 45-65 | Permissible | 7 | 8 | 32 | 35 | |
| 65-85 | Doubtful | 6 | 4 | 25 | 16 | |
| >85 | Unsuitable | 0 | 0 | 0 | 0 | |
| The magnesium ratio (MR) is a measure of how much magnesium is present in a given amount of (in meql-1) | <30 | Suitable | 7 | 6 | 45 | 20 |
| >30 | Unsuitable | 13 | 16 | 65 | 80 | |
| Corrosive ratio (CR) | >1.5 | Eroding | 4 | 2 | 15 | 6 |
| <1.5 | Harmless | 18 | 20 | 85 | 100 | |
| Index of water quality (WQI) | <45 | Excellent | 2 | 5 | 6 | 25 |
| 45-95 | Good | 10 | 14 | 45 | 70 | |
| 95-190 | Poor | 9 | 4 | 45 | 20 | |
| 190-290 | Very poor | 3 | 0 | 12 | 0 | |
| >290 | Undesirable for drinking | 0 | 0 | 0 | 0 | |
| Water constraint | Normal irrigation water ranking | Range during | |
|---|---|---|---|
| PRM | POM | ||
| Sodium absorption ratio (SAR) | 0-10 | 0.4-5.0 | 0.3-4.0 |
| Magnesium (Mg2+) | 0-6 | 0.17-2.90 | 0.40-2.50 |
| Bicarbonate (CO32-) | 0-12 | 3.5-35.0 | 3.7-27.2 |
| Calcium (Ca2+) | 0-25 | 0.6-3.60 | 0.50-2.50 |
| Sodium (Na+) | 0-45 | 0.35-4.10 | 0.35-3.75 |
| Sulphate (SO42-) | 0-25 | 0.2-27.4 | 0.2-16.5 |
| Electrical conductivity (EC) | <2100 | 370-3920 | 655-3600 |
| Chloride (cl-) | 0-35 | 0.5-20.0 | 1.8-19.0 |
| Acid/base (pH) | 6.2-8.7 | 7.2-8.4 | 7-7.75 |
| Potassium (K+) | 0-0.050 | 0.15-1.20 | 0.05-0.95 |
4. Conclusion
- (i)
As the monsoon season approaches, the order of anion dominance in water samples changes from to . In both seasons, and cations are dominant in the following order: Na+ > Ca2+ > Mg2+ > K+. TDS, chloride, sulphate, and phosphate are all terms for total hardness. In both seasons, the majority of water samples had calcium, magnesium, sodium, and potassium levels that were within acceptable limits
- (ii)
Samples polluted by alkalinity make up 80% of the total. Fluoride and nitrate are found in premonsoon and postmonsoon water samples, respectively, however, they are not found in postmonsoon water samples. According the Water Quality Index, 50% of pre- and postmonsoon water tests are safe for consumption
- (iii)
The water samples’ SAR, KR, PS, PI, and Na % readings suggest that they can be used for irrigation, according to the researchers
Conflicts of Interest
The authors declare that there is no conflicts of interest regarding the publication of this article.
Acknowledgments
The authors appreciate the supports from Ambo University, Ethiopia, for providing help during the research and preparation of the manuscript. The authors would like to acknowledge the Researchers Supporting Project Number (RSP2022R455), King Saud University, Riyadh, Saudi Arabia.
Open Research
Data Availability
The data used to support the findings of this study are included within the article. Further data or information is available from the corresponding author upon request.


