Differential Susceptibility of the Gut Microbiota to DSS Treatment Interferes in the Conserved Microbiome Association in Mouse Models of Colitis and Is Related to the Initial Gut Microbiota Difference
Abstract
Dysbiosis is a well-known factor in the pathogenesis of inflammatory bowel disease (IBD). However, the discovery of a conserved microbiome association in colitis is largely unknown. The study’s goal was to look into a core microbiome linked to DSS-induced colitis in mice, which could aid in the development of microbiome-based diagnostics and therapeutics. The dextran sulfate sodium- (DSS-) induced acute colitis model was established in mice in a controlled experimental setting, and the gut microbial community analysis from fecal samples was carried out on the Illumina MiSeq platform using the 16S rRNA gene. The findings revealed that the gut microbiota’s overall structure had changed dramatically in mice with DSS-induced colitis. However, this change was not consistent across all groups, as evidenced by the linear discriminant analysis (LDA) score, which revealed that all DSS-treated groups D, M, TA, TC, and TH had different associated microbes as highly abundant taxa during the colitis period. Moreover, groups D and TA had more severe colitis pathology than the other groups. Finally, we discovered significant structural and compositional differences in the initial gut microbiota among DSS-treated groups, which could explain why each group’s associated microbiota pattern differed during colitis. In conclusion, the results showed that the gut microbiota alteration that occurred in DSS colitis is not confined to a specific core microbiome but varies concerning the group or individual animals’ initial gut microbiota structure and composition.
1. Introduction
The gut microbiota acts as a metabolic organ that influences host physiology, ranging from the gut’s local mucosa to distant systemic sites [1, 2], with functions in metabolism [3] and immunity regulation [4], and is essential to host health and disease [5]. Alteration of the gut microbiota, called dysbiosis, is believed to play a role in a variety of disease pathologies [6], ranging from chronic intestinal inflammation to chronic metabolic and systemic disorders [7, 8]. One such disorder is IBD, a chronic gastrointestinal tract (GIT) inflammatory disease that has recently become a global health challenge [9], in which the resident gut microbial communities are thought to play a critical role in its etiopathogenesis [10]. A recently published clinical study containing 132 IBD patients provided the most comprehensive understanding of the microbial and host activities in IBD pathology, demonstrating that the dysregulation in the gut microbiome taxonomic and functional profile and host immune factors is central to this disease [11]. Similarly, several previous clinical and preclinical studies have reported that IBD patients and mouse models of colitis always are accompanied by an alteration in the intestinal microbiota, showing significant differences in the gut microbiome in terms of density, diversity, and a rapidly dynamic shift towards an unhealthy state [12–16]. Although alteration in the gut microbiota has been proposed as a causal factor in IBD pathophysiology, however, a specific microbe/microbiome and IBD association is not yet established [17]. Furthermore, the key evidence that determines the gut microbiota involvement in IBD development comes from antibiotic use in IBD patients and animal colitis models [18, 19], colitis development in wild-type mice with microbiota transfer from colitis-bearing mice [20], and colitis development in germ-free mice with inoculation of a specific commensal microbial species [21]. All these data indicate a central role of the gut microbiota in IBD pathogenesis in human subjects and the disease model system [22]. Although an obvious role of the gut microbiota in IBD pathogenesis has been demonstrated by the link between gut microbiota dysfunction in IBD patients and colitis models [23], unfortunately, the association of a specific core gut microbiome and a constant dysbiotic pattern that is suspected to be involved in the onset of IBD pathogenesis remains unclear. For example, in human IBD, a decrease in Firmicutes and Bacteroides diversity and an increase in Enterobacteriaceae have been identified as the most common dysbiosis patterns in various studies [24–28]. However, Joossens et al. reported the association and an increase in Ruminococcus gnavus and a decrease in Bifidobacterium adolescentis, Dialister invisus, Faecalibacterium prausnitzii, and an unknown member of Clostridium cluster XIVa [29]. Similarly, other studies have reported a reduction in Firmicutes (especially Clostridium groups), Bacteriodes, Lactobacillus, and Eubacterium [30, 31] and an increase in Proteobacteria [32]. An increase of Bacteroidetes [33] and Actinobacteria [32] and a decrease in Lachnospiracea [32] and Roseburia hominis [34] have also been reported as associated taxa in IBD patients. Seksik et al. found that Proteobacteria, Bacteroidetes, and Clostridia remained unchanged in Crohn’s disease (CD) patients [35]. Yilmaz et al. reported a disturbance in the distinct networks of the Lachnospiraceae and Ruminococcaceae families in IBD disease development rather than the microbial taxon itself, indicating the microbe-microbe interaction role in colitis development [36]. Other studies on human IBD subjects reported the involvement of pathogenic strains such as Enterobacteriaceae (E. coli) [35], Helicobacter species (H. pylori) [37], Mycobacterial species (MAP) [38], Escherichia coli, and Campylobacter [39], Staphylococcaceae, Strepotococcaceae, Pseudomonas maltophilia, Klebsiella, Salmonella [40], Pseudomonas [41], and Clostridium diffcile [42]. All these pathogenic microbial taxa were found in high abundance in the IBD clinical cases as causal or contributing factors to IBD pathogenesis.
To decipher the underlying mechanisms of human diseases and explore the microbe-host relationship and the mechanism of novel therapeutic agents or evaluate the efficacy of a candidate drug, mouse models have been widely used [43]. However, mouse models often remain questionable because of reproducibility problems and poor translation to fully mimic human conditions [44]. Owing to reproducibility issues, several preclinical research studies using animal models have been controversial and have not been validated [45, 46]. Among the chemically induced mouse models, the most commonly used mouse model in IBD research is the dextran sulfate sodium- (DSS-) induced colitis model, which is easy to induce, rapid, simple, and controllable [47–49]. Despite the fact that the DSS model is well-known and widely accepted, it has yielded conflicting results in various studies. For example, Bauer et al. used NLRP3−/− mice that have shown low-grade intestinal inflammation and lower levels of proinflammatory cytokines after DSS treatment [50]. In contrast, Zaki et al. used the same NLRP3-deficient mouse model and reported a severe colitis induction that exhibited higher morbidity and mortality [51]. In addition, these controversial findings have been paralleled by outcomes in mouse models deficient in caspase-1, IL-18, and adiponectin (APN) [52–54]. Similarly, contradictory results in dysbiosis patterns and microbial taxa or communities associated with colitis pathology have also been reported in mouse models of colitis. For example, the most common dysbiosis pattern of the DSS-induced mouse colitis model is generally characterized by a decrease in the Lactobacillus group and an increase in Enterobacteriaceae, Akkermansia, and Desulfovibrio [14–16]. This dysbiotic pattern is not consistent in all colitis mouse model studies and was found to be variable as reported in human IBD subjects. For example, Håkansson et al. and Mizoguchi have shown Bacteroides distasonis, Clostridium ramosum, Akkermansia muciniphila, and Enterobacteriaceae as a dominant microbial community associated with DSS colitis [14, 48]. In contrast, Jing et al. have shown a high abundant level of Desulfovibrio spp., Alistipes spp., and Helicobacter spp., but a lower abundance of Bifidobacterium spp., Lactobacillus spp., and Akkermansia spp. [55]. Other studies reported an increase in Akkermansia and Desulfovibrio and a decrease in Lactobacillus [14]. Similarly, an increase in Verrucomicrobia and a decrease in Tenericutes [16], an increase in Bacillaceae, and a decrease in Bacteroidetes and Prevotela have also been reported as signature microbial taxa associated with DSS colitis [56]. Although the spectrum of published results has widely recognized dysbiosis, the pattern and features of dysbiosis are inconsistent and varied in terms of the microbial taxa associated with their composition and abundance level among the surveyed studies of IBD patients and colitis models. Previous studies have attributed this variability in outcomes to a variety of irreproducibility factors, such as diet, sex, age, genotype, and animal husbandry condition as well as variation in the specimen type, sample location, degree of disease/colitis in subjects, differences in batch and bred/strains of mice, different lab environments and subtle changes in experimental protocols, and materials and methods of analysis. All these factors may explain the inconsistency of results in preclinical research with animal models [57–63]. To promote the reproducibility of preclinical research using animal models, examining the factors contributing to the irreproducibility of experiments is necessary under controlled conditions. As we know, the gut microbiota has a profound effect on host physiology, which may be one of the factors contributing to irreproducibility in animal models [2]. Thus, we thought that variations in the initial gut microbiota in mice from different labs may have contributed to the contradictory results observed in the DSS-induced colitis experiments. To address this question and justify the answer, we hypothesized that the models’ studies conducted under the same SOPs and laboratory conditions ideally should have a similar dysbiosis pattern, the same associated microbial taxa, and their abundance level in all model groups receiving the DSS. Therefore, in the present study, we treated the same strain of mice C57BL/6, under the same DSS treatment and lab conditions, aiming to investigate whether a core microbiome association and dysbiosis pattern remain the same with DSS-induced colitis across all these models or not. We performed six independent trials (named N, D, M, TA, TC, and TH). As a result, our study showed variation in dysbiosis pattern, associated taxa, and the abundance level of the microbial community in different DSS trial groups, indicating an internal factor of the gut microbiota that influences the gut microbiota response to DSS treatment. We concluded that variations in the initial gut microbiota are a key factor in the contradictory results observed in DSS-induced colitis experiments under the same experimental condition, where the initial gut microbiota structural composition or their community consortia may affect their susceptibility to DSS treatment.
2. Materials and Methods
2.1. Animal
Animal studies were performed in compliance with the protocols approved by the Ethics Committee of Animal Experiments at the Lanzhou University and ARRIVE guidelines, confirming that all methods were carried out following relevant guidelines and regulations. C57BL/6 mice of the same sex and age (female, 18 ± 2 g, 7 weeks old at the beginning of the trial) were purchased from Hunan SJA Laboratory Animal Co. (Changsha, China) and were housed under specific pathogen-free conditions, with autoclave bedding and sterile food and water ad libitum, and exposed to 12 : 12-hour light: dark cycles at a temperature of 22 ± 2°C and relative humidity of 35–55% throughout the experiment.
2.2. DSS Treatment and Colitis Induction
Six independent trials using C57BL/6 mice were carried out, where all mice (except the normal control) were treated with 3% DSS (molecular weight, 36,000–50,000, MP Biomedicals #160110, Solon, USA) under the same experimental procedures and in the same animal facility. All mice were acclimatized for one week to the laboratory conditions before any experimental inclusion. After one week of the adaptation period, 60 mice were randomly divided into six groups (n = 10 per group; N, D, M, TA, TC, and TH), respectively. The control group received normal tap water (N group), and all others were DSS-treated groups (D, M, TA, TC, and TH) that were maintained on receiving 3% DSS dissolved in sterile drinking water for 7 days (day 0 to day 7) to induce acute colitis [64]. Later, the groups were referred to the respective days (day 0 or 7) on which the data was obtained and analyzed. For the data obtained and analyzed on day 0, the groups were named as N0, D0, M0, TA0, TC0, and TH0, whereas for the data obtained and analyzed on day 7, the groups were named as N7, D7, M7, TA7, TC7, and TH7, respectively. All mice were maintained on the standard normal chow diet for the whole course of the experiment [57, 58].
2.3. Clinical Scoring and Assessment of Colitis
The mice were weighed and visually inspected for the development of disease signs and symptoms (diarrhea and rectal bleeding), and the findings were recorded daily during the modeling period (day 0 to day 7). The Disease Activity Index (DAI), which incorporates the scores of weight loss, diarrhea, and bleeding [65], was calculated based on the data collected according to standardized scoring methods as shown in (Table 1). Fresh DSS solution and distilled water were prepared daily. Fresh feces were collected on day 0 and day 7 and were stored at −80°C until analysis.
| S. No | Weight | Score | Stool consistency | Score | Bleeding | Score |
|---|---|---|---|---|---|---|
| 1 | No loss | 0 | Normal | 0 | No blood | 0 |
| 2 | 1-5% | 1 | Soft | 1 | Visual blood pellet in stool | 1 |
| 3 | 5-10% | 2 | Loose | 2 | Visual blood around the anus and stool | 2 |
| 4 | 10-20% | 3 | Diarrhea | 4 | Gross bleeding | 4 |
| 5 | ≥20% | 4 |
2.4. Histological Scoring
On day 8, all mice had drunk sterile drinking water and then were sacrificed by cervical dislocation on day 9, and the entire colon was removed, the colon length was determined, and the luminal contents were washed out and placed in a sterile tube and stored at −80°C. One-centimeter-long specimen from the most distal part was cut off, and each was fixed in 4% paraformaldehyde overnight and embedded in paraffin for routine H&E histopathology examination and evaluation of histopathological changes [66] according to the score method (Table 2).
| Normal | Minor damage | Moderate | Deeper and extensive | |
|---|---|---|---|---|
| Epithelium damage | 0 | 1 | 2 | 3 |
| Cellular infiltration | 0 | 1 | 2 | 3 |
| Crypt distortion | 0 | 1 | 2 | 3 |
| Goblet cell loss | 0 | 1 | 2 | 3 |
2.5. Bacterial DNA Extraction and PCR Amplification
The bacterial DNA from the fecal contents was extracted with the QIAamp DNA Stool Mini Kit (QIAGEN, Germany). The quantity and quality of the extracted DNA were measured using a NanoDrop ND-1000 spectrophotometer (Thermo Fisher Scientific, Waltham, MA, USA) and agarose gel electrophoresis, respectively. PCR amplification of the bacterial 16S rRNA genes V3-V4 region was performed using the forward primer 338F (5′-ACTCCTACGGGAGGCAGCA-3′ and the reverse primer 806R (5′-GGACTACHVGGGTWTCTAAT-3′). PCR reactions were performed in triplicate with given specifications: a mixture volume of 20 μL containing template DNA (10 ng), 2.5 mM dNTPs (2 μL), FastPfu polymerase (0.4 μL), 5 μM of each primer (0.8 μL), and 5 × FastPfu buffer (4 μL). PCR thermal cycling conditions were as follows: initial denaturation at 98°C for 2 min, followed by 25 cycles consisting of denaturation at 98°C for 15 s, annealing at 55°C for 30 s, and extension at 72°C for 30 s, with a final extension of 5 min at 72°C. PCR amplicons were purified with pure beads (Beckman Coulter, Indianapolis, IN) and quantified using the PicoGreen dsDNA assay kit (Invitrogen, CA, USA). The DNA extraction and PCR amplification were carried out according to the prescribed protocol adopted by the Personalbio, Shanghai Personalbio Technology Co., Ltd.
2.6. Illumina MiSeq Sequencing and Sequence Data Analysis
After the individual quantification step, amplicons were pooled in equal amounts, and paired-end (2 × 250) bp sequencing was performed using the Illumina MiSeq platform with MiSeq Reagent Kit v3 at Shanghai Personal Biotechnology Co., Ltd, Shanghai, China, according to the standard protocols. The Quantitative Insights into Microbial Ecology (QIIME, v1.8.0) pipeline was employed to process the sequencing data as previously described [67]. Briefly, the raw sequencing reads with exact matches to the barcodes were assigned to the respective samples and identified as valid sequences. The low-quality sequences were filtered through the following criteria [3, 68]: sequences that had a length of <150 bp, sequences that had average Phred scores of <20, sequences that contained ambiguous bases, and sequences that contained mononucleotide repeats of >8 bp. Paired-end reads were assembled using FLASH [69]. After chimera detection, the remaining high-quality sequences were clustered into operational taxonomic units (OTUs) at 97% sequence identity by UCLUST [70]. A representative sequence was selected from each OTU using default parameters. OTU taxonomic classification was conducted by BLAST searching the representative sequences set against the Greengenes Database using the best hit [71, 72]. An OTU table was further generated to record the abundance of each OTU in each sample and the taxonomy of these OTUs. OTUs containing less than 0.001% of the total sequences across all samples were discarded. To minimize the difference in sequencing depth across samples, an average, rounded rarefied OTU table was generated by averaging 100 evenly resampled OTU subsets under 90% of the minimum sequencing depth for further analysis.
2.7. Bioinformatics and Statistical Analysis
Sequence data analyses were mainly performed using the QIIME and R packages (v3.2.0). OTU-level alpha diversity indices, such as the Chao1 richness estimator, ACE metric (Abundance-based Coverage Estimator), Shannon diversity index, and Simpson index, were calculated using the OTU table in QIIME. Beta diversity analysis was performed to investigate the structural variation of microbial communities across samples using UniFrac distance metrics [73, 74] and visualized via principal component analysis (PCA), nonmetric multidimensional scaling (NMDS), and unweighted pair-group method with arithmetic means (UPGMA) hierarchical clustering [75]. Taxon abundances at the phylum and genus level were statistically compared among samples or groups by metastats [76] and visualized as stacked charts and tables. LEfSe (linear discriminant analysis effect size) was performed to detect differentially abundant taxa across the groups using the default parameters [77]. PLS-DA (partial least squares discriminant analysis) was also introduced as a supervised model to reveal the microbiota variation among the groups, using the “plsda” function in the R package “mixOmics” [78].
Statistical analysis was performed using GraphPad Prism 8.0 software. The data was presented in the figures as mean ± SD. Differences between the two groups were analyzed using a one-way analysis of variance. Taxon abundances at the phylum and genus level were statistically compared among samples or groups by metastats. Differences with P values of less than 0.05 were considered significant.
3. Results
3.1. DSS Colitis Pathology in Different Trial Treatments
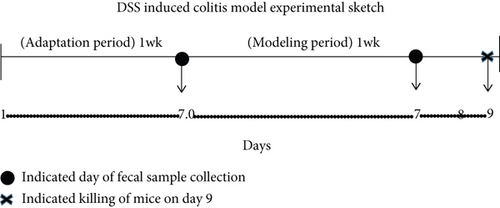
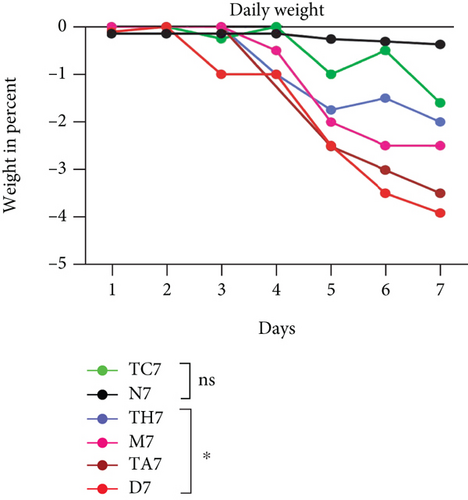
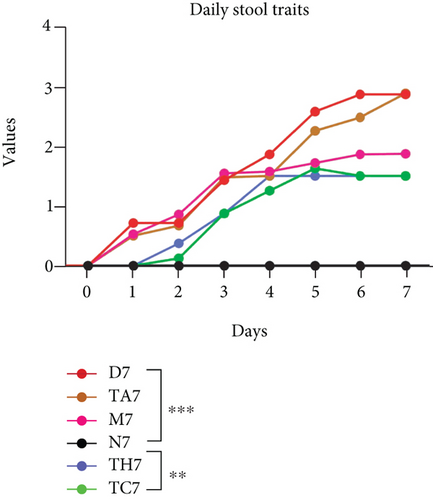
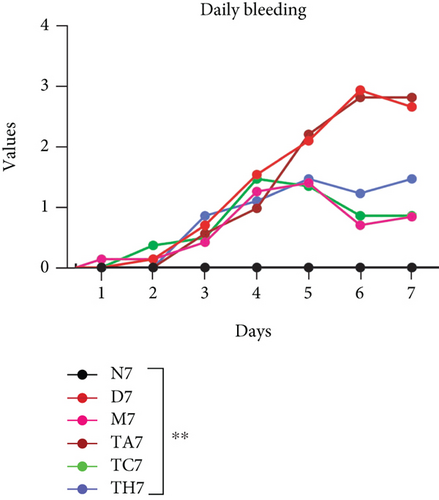
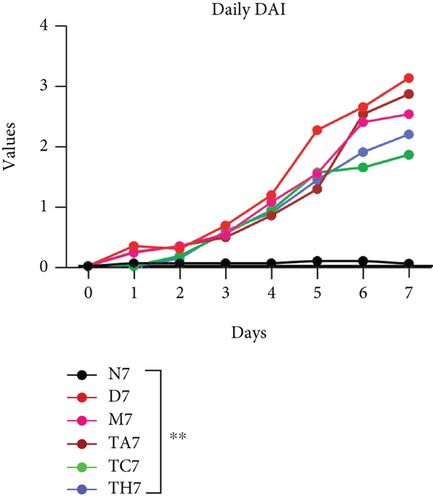
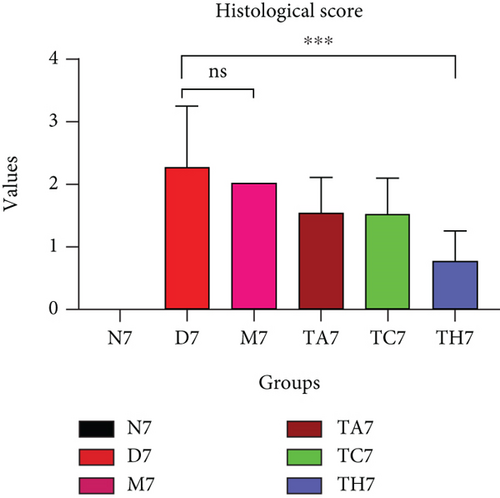
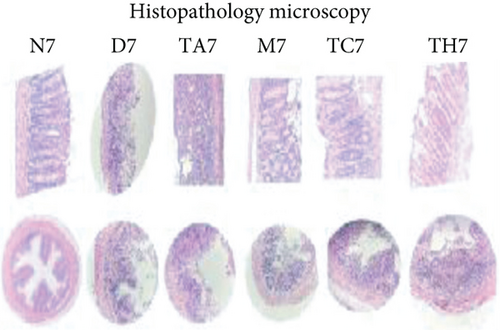
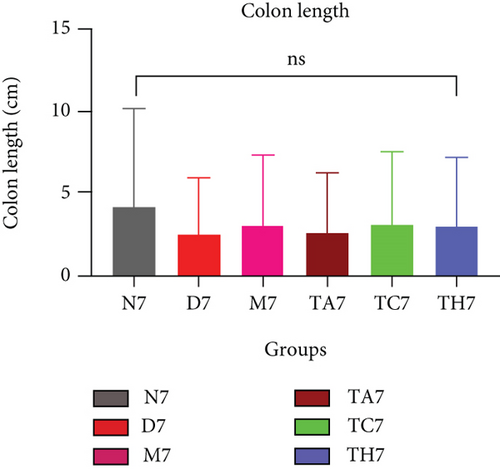
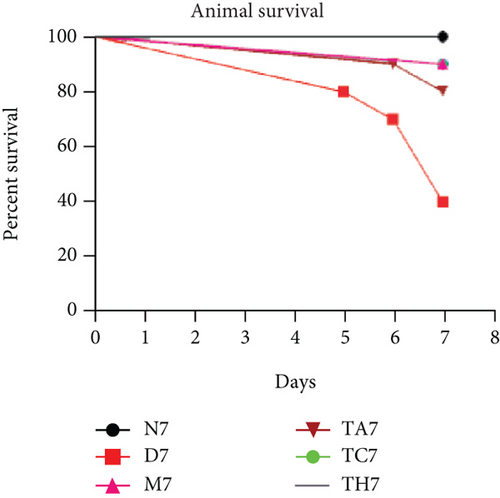
Colitis was induced in mice by the administration of 3% DSS in drinking water for 7 days (scheme sketch for the DSS model as shown in (Figure 1(a)). The Disease Activity Index (DAI) was used to assess the successful induction of colitis during the modeling period and to evaluate the intestinal inflammation severity in mice with colitis. From day 3 onwards following DSS intake, visible signs of disease, including body weight loss, loose feces/diarrhea, and rectal bleeding, were seen in the mice of all DSS groups and were progressively increased till day 7 (Figures 1(b)–1(d). The DAI score was increased significantly compared to the normal group (P < 0.05) (Figure 1(e)). Colon shortening is another index that reflects the severity of colorectal inflammation. Figure 1(h) shows that a shortening of the colon was observed in the DSS groups compared with the normal control, but this decrease was not significant (P > 0.05). H&E-stained colorectal sections showed that mice from the DSS groups exhibited intestinal mucosa epithelial cell injury, distortion of crypts, and loss of goblet cells ranging from a moderate to severe degree in response to DSS treatment compared to the normal group (P < 0.05) (Figures 1(f) and 1(g)). Overall, the data indicated that our model was successfully produced in all groups of mice; however, variation in the severity of DSS-induced colitis was seen in different animal trials, even though all trials were conducted under the same laboratory conditions and protocol. In response to DSS treatment, mice in the D7 and TA7 groups exhibited a greater loss of body weight, a higher score for stool features, and severe bleeding than mice in the other DSS trial groups compared to the normal control, especially from day 5 onwards. In addition, the DAI scores of the mice in the D7 and TA7 groups were also significantly higher than those in the other three DSS trials after day 5. The body weight and DAI in the M7, TC7, and TH7 groups of mice were close to each other and showed almost similar differences compared to the normal N, but less than those in D7 and TA7 mice in response to DSS treatment. Additionally, the mortality rate was higher in D7 mice than in other DSS trial groups’ mice. Five in 10 mice in the D7 group died during the experimental period, whereas two in 10 mice died in the TA7, and only one died in each of all other DSS trial groups by days 6 and 7, respectively (Figure 1(i)). Moreover, the mice in the D7 and TA7 groups showed shorter colon lengths than those of mice in the other 3 trial groups compared to normal (Figure 1(h)). Together, the results showed more severe intestinal inflammation in the D and TA groups than in the M, TC, or TH groups, which revealed that variation in the severity of DSS-induced colitis existed in different animal trials even though the trials were conducted with the same procedure and protocol, hence suggesting an internal factor that may have an influencing effect on DSS colitis induction and severity.
3.2. High-Throughput 16S rRNA Sequencing and Gut Microbial Diversity in All Trials after DSS Treatment
To compare the gut microbiota structures of mice in all trials, sequencing of the bacterial 16S rRNA gene V3-V4 region in the fecal samples was performed on the Illumina MiSeq platform. On average, 34728 ± 3253 (mean ± SD) high-quality reads were obtained for each sample. A total of 738 OTUs were delineated at a threshold of 97% identity and were used for further microbial analysis.
3.2.1. Gut Microbial Alpha and Beta Diversity
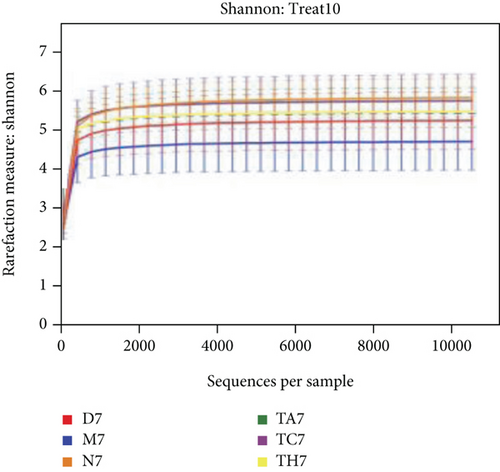
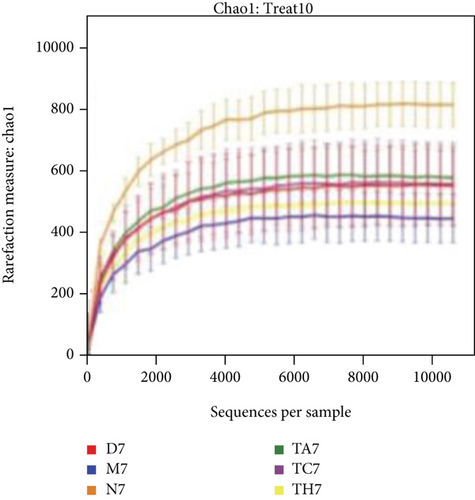
The alpha diversity indices ACE and Chao1 reflect the microbial community richness of species within a single sample, while Shannon’s and Simpson’s indexes represent microbial diversity. Based on the sequencing data, there were no differences in the richness and diversity of the initial gut microbiota in mice from the six trials before DSS treatment on day 0 (Table S1 in Supporting Information). After the DSS administration course (on day 7), the richness and diversity of the gut microbiota were decreased in all mice of the DSS group compared to the normal; however, this difference was not statistically significant (P > 0.05) (Table S2 in Supporting Information). Rarefactions of Chao1 and Shannon diversity curves are shown in Figures 2(a) and 2(b).
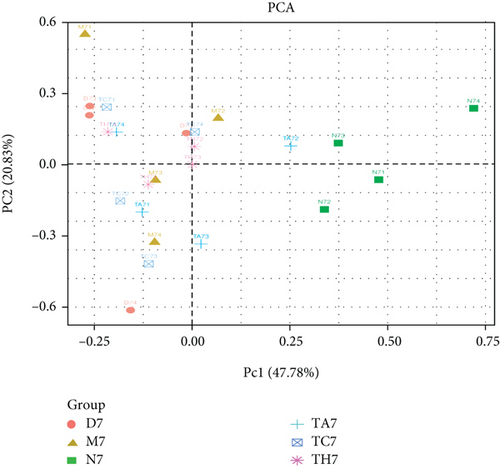
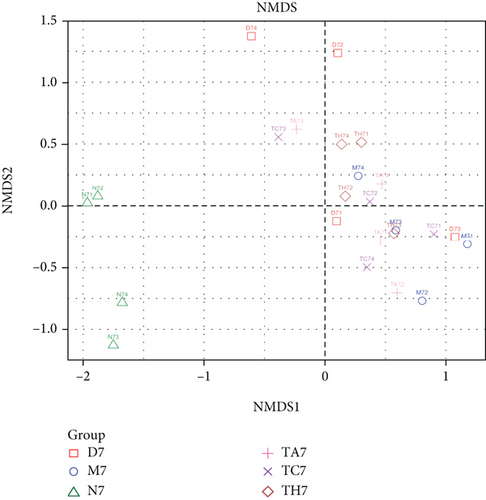
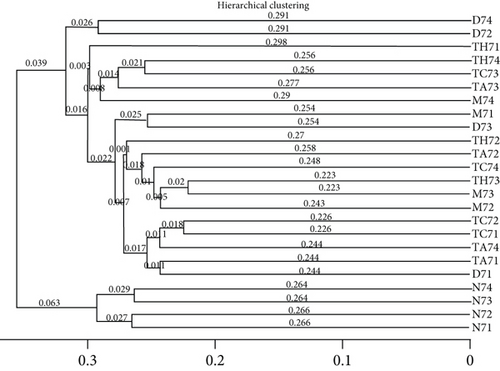
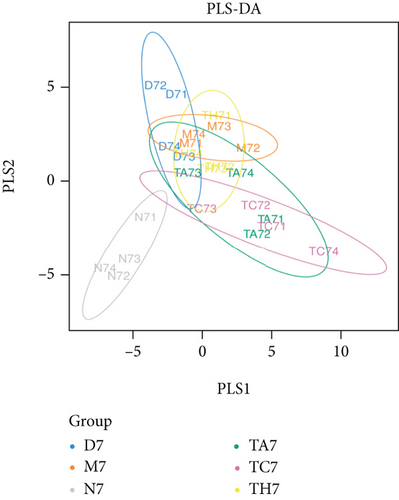
Beta diversity analysis (based on UniFrac distance metrics) via principal component analysis (PCoA), nonmetric multidimensional scaling (NMDS), and unweighted pair group method with arithmetic mean (UPGMA) hierarchical clustering, as well as partial least squares discriminant analysis (PLS-DA), showed a structural variation of microbial communities in all trials, where the gut microbiota deviated from the baseline structure and moved in a similar direction in the DSS group samples vs. normal, indicating that the gut microbiota has been changed after DSS administration (Figures 2(c)–2(f)).
3.3. Structure and Composition Differences of the Gut Microbiota at the Phylum and Genus Level
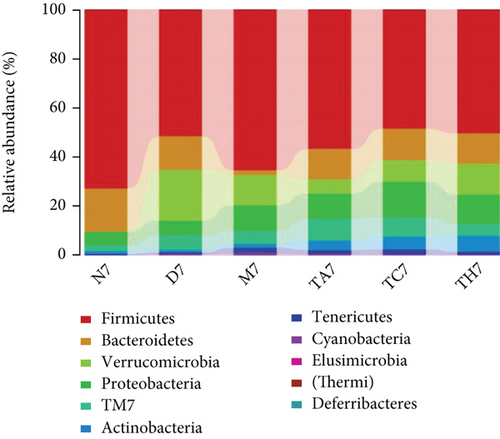
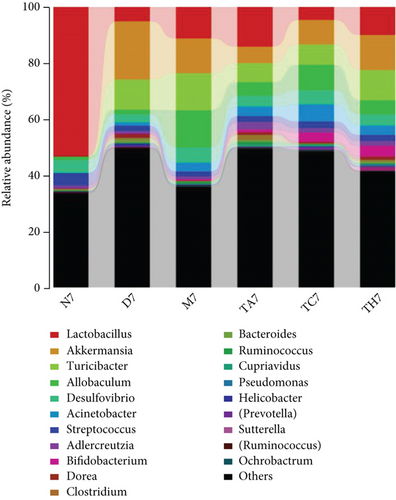
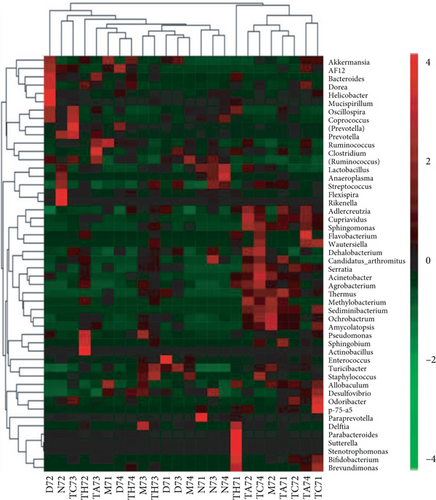
On comparative analysis, we found a gross difference in the abundance and structural composition of the gut microbial taxa between the normal and DSS groups at the phylum and genus level (Figure 3). Histograms of Figure 3(a) illustrate the gut microbial community structural segregation and their relative abundance in the different groups at the phylum level. A total of 11 different bacterial phyla were identified, which were containing Firmicutes, Bacteroidetes, Proteobacteria, Candidate Division TM7, Verrucomicrobia, Actinobacteria, Tenericutes, Cyanobacteria, Deferribacteres, Elusimicrobia, and Thermi. Among them, the most abundant phyla were Firmicutes, Bacteroidetes, and Proteobacteria. In the 6 treatment groups, the bacterial structures were similar, but the composition proportion of different bacteria was largely shifted differently within the different trial groups compared to the normal group, for example, Firmicutes in the normal group N7 (72.8%), D7 (51.6%), M7 (65.4%), TA7 (56.6%), TC7 (48.4%), and TH7 (50.3%), respectively. Similarly, an increase was seen in aggressive phyla (possibly harmful bacterial phyla) such as Proteobacteria in the normal group, N7 (5.3%), D7 (5.7%), M7 (10.1%), TA7 (9.9%), TC7 (14.2%), and TH7 (11.4%), respectively. Meanwhile, the relative abundance of all dominant phyla was addressed in all DSS trials vs. normal to identify the significantly altered bacterial taxa. Among them, a total of seven phyla were significantly different, one protective and six aggressive in all trial groups as shown in Table S3. Generally, the Firmicutes were decreased in all DSS trial groups, but a significant decrease occurred only in TC7 (72.8% in normal vs. 48.4% in TC7, P < 0.05 = 0.017), whereas aggressive bacteria such as Verrucomicrobia were increased in all DSS groups, but a significant increase occurred in D7 only (21% in D7 vs. 0.0% in N7, P < 0.05 = 0.022167). Similarly, TM7 was significantly increased in groups M7, TA7, and TC7; Thermi in groups M7 and TC7; Cyanobacteria in the groups TA7 and TH7; Actinobacteria in the group TA7 only; and Tenericutes in TA7 and TC7. The compositional comparisons at the phylum level across the DSS groups vs. normal revealed inconsistent results but generally showed a decrease in Firmicutes and Bacteroides phyla and an increase in all other 9 phyla. The same was true at the genus level (Figure 3(b)). Analysis results of the sequencing data identified 20 dominant genera, while genera counting less than 0.001% in all trials were counted as other genera. Among these dominant genera, the relative abundance of the Lactobacillus, Streptococcus, and Ruminococcus was commonly decreased, while genera Akkermansia, Turicibacter, Allobaculum, Desulfovibrio, Acinetobacter, Bifidobacterium, Cupriavidus, Pseudomonas, Prevotella, and Ochrobactrum were commonly increased in all DSS groups compared to the normal. However, some other genera, including Adlercreutzia, Dorea, Clostridium, Bacteroides, Ruminococcus, Helicobacter, and Sutterella, were either decreased or increased in different DSS trial groups compared to the normal. In addition, the relative abundance of all counted genera was addressed in different DSS trials vs. normal, aiming to identify the significant microbial taxa (genera). Among them, a total of 22 genera were identified as significantly different, as shown in Table S4. The genera that were significantly decreased in all DSS trials were Lactobacillus and Anaeroplasma, while the genera that were significantly increased in all DSS trials were Turicibacter, Akkermansia, Agrobacterium, and Allobaculum. In addition, some other genus members showed either a significant decrease or an increase in different DSS trial groups, respectively. For example, Helicobacter significantly decreased in M7, TA7, and TH7 while not in D7 and TC7; Coprococcus significantly decreased in M7 and TH7 while not in other groups, and Ruminococcus was significantly decreased in TH7 only. Similarly, Sphingomonas, Thermus, Bifidobacterium, Cupriavidus, Ochrobactrum, Adlercreutzia, Amycolatopsis, Acinetobacter, Sediminibacterium, Enhydrobacter, Odoribacter, Dorea, and Flavobacterium were significantly increased in some DSS groups while not in others. Furthermore, the difference in the gut microbiota structure between the normal and DSS groups and among the DSS groups was confirmed with the heat map analysis. Based on the clustered analysis results and similarity distance (using “Euclidean” distance by default) calculated by their abundance distribution in different samples of each group, using R scripts to draw a heat map for the top 50 most abundant genera (Figure 3(c)). As a result, the heat map of the community compositional and cluster analysis has shown an alteration of the gut microbiota in the DSS trial groups from that of the normal control group as well as also showed great intergroups and intragroup variations among and within the DSS trial groups, whereas the normal control group showed a consistent and uniform distribution of microbial taxa, indicating that change in the gut microbiota thought to be associated with colitis was also not uniform in all DSS groups from the heat map analysis. The PLS-DA and beta diversity analysis have also revealed a scattered distribution in all DSS-treated groups, indicating that the alteration induced by DSS colitis was not uniform and intergroups differences in the gut microbiota structures among the DSS-treated groups mice existed (Figures 2(c)–2(f)). The current data reveals that the gut microbiota was altered after DSS consumption; however, this alteration was not uniform and similar across the DSS groups that were compared to the normal control but has shown variations in the associated microbial taxa or their abundance level in different trial groups (Figure 3; Tables S3 and S4).
3.4. Key Biomarkers Contributed to Distinguishing the DSS Response and Initial Gut Microbiota among All Trials
To investigate the key biomarkers associated with each group, the linear discriminant analysis (LDA) score best analyzes the individual group diversity and abundant biomarkers. LDA linked to effect size measurements was used to detect major bacteria in the different trial groups. The LDA results show that a total of 36 taxa were identified as statistically significant biomarkers in all trial groups, in which 5 were in TH7, 9 were in TC7, 2 were in TA7, 7 were in M7, 4 were in N7, and 9 were in D7, respectively. In TH7, the Actinobacteria had shown a greater influence in the dominant community. In the TC7, Pseudomonadales, Acinetobacter, Gamma Proteobacteria, and Moraxellaceae were found as dominant taxa. In TA7, both taxa Oaxlobacteraceae and cupriavidus were counted as dominant taxa. Similarly, M7 showed Allobaculum, Turicibacteraceae, and Erysipelotrichaceae as the dominant flora, while N7 showed Lactobacillales/lactobacillus and D7 showed Akkermansia and Verrcumicrobiae which were found as dominant microbial taxa that had a great influence in their respective dominant community. An evolutionary clustering analysis taxonomic cladogram was generated based on the LDA score, showing the hierarchy of the major taxa from phylum to genus (i.e., from the inner layer to the outer layer) and the average relative abundance of the relevant taxa associated with each group. A histogram of LDA scores and a taxonomic cladogram have been shown (Figures 4(a) and 4(b)).
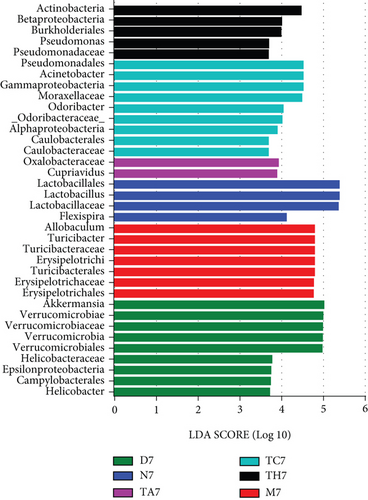
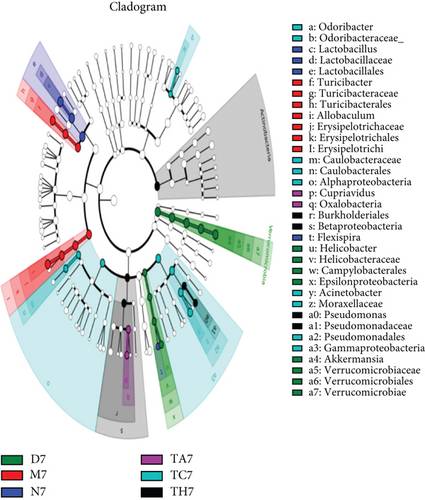
Ideally, the DSS-treated mice that have been gone under the same laboratory and experimental conditions should have the same key biomarkers. However, interestingly, all DSS trial groups showed different key biomarkers as abundant representative microbial taxa respective to each group. We hypothesized that the ununiform change in the gut microbiota structure and different key biomarker association with the different DSS-treated groups might be related to the differences in the initial gut microbiota structure of each group, which may have been responding to DSS treatment differently. To ensure whether this inconsistency was from the initial gut microbiota difference, we compared the gut microbiota between DSS trial groups and the normal group (DSS trial group vs. normal control group) and within all DSS trial groups (DSS-treated group vs. DSS-treated group) before DSS treatment on day 0 (Figure 5 and Table S5). Results showed that the DSS-treated groups (D0, M0, TA0, TC0, and TH0) versus the normal control (N0) showed a magnitude of 5 significantly different phyla in all groups, which were structurally composed of phyla Actinobacteria, Verrucomicrobia, and TM7, while the intergroup difference among DSS-treated groups (DSS-treated group vs. DSS-treated group) showed a magnitude of 10 significantly different phyla in all groups which were structurally composed of Tenericutes, TM7, Actinobacteria, Proteobacteria, Verrucomicrobia, Firmicutes, and Deferribacteres (Table S5). At the phylum level, the DSS-treated groups vs. the normal control (D0 vs. N0, TA0 vs. N0, TC0 vs. N0, TH0 vs. N0, and M0 vs. N0) showed no or less variation with a maximum of one taxon difference to the corresponding groups in comparison, respectively. However, the inter-DSS group comparison displayed slightly more variation with a maximum of 1 to 3 taxon differences to the corresponding groups in comparison, respectively. Similarly, at the genus level, the comparison of the DSS-treated groups (D0, M0, TA0, TC0, and TH0) versus the normal control (N0) showed a magnitude of 21 significantly different genera in all groups, which were structurally composed of Candidatus Arthromitus, Streptococcus, Acinetobacter, Oscillospira, Dorea, Ruminococcus, Coprobacillus, Adlercreutzia, Ruminococcus, Chryseobacterium, Akkermansia, Cupriavidus, Delftia, Anaeroplasma, and p-75-a5. At the genus level, the DSS-treated groups vs. the normal control (D0 vs. N0, TA0 vs. N0, TC0 vs. N0, TH0 vs, N0, and M0 vs, N0) showed a less or moderate difference to the corresponding groups in comparison, respectively, while a greater intergroup variation was shown in the structure of the gut microbiota among the DSS trial group comparison, where a total of 71 significantly different genera in all DSS group comparisons were counted, which were structurally composed of Oscillospira, Ruminococcus, Lactobacillus, Coprobacillus, Desulfovibrio, Staphylococcus, Mucispirillum, Adlercreutzia, Akkermansia, Chryseobacterium, Flexispira, Delftia, Ochrobactrum, Bacteroides, Dorea, Candidatus Arthromitus, Rikenella, Agrobacterium, Ruminococcus, Helicobacter, Coprococcus, Odoribacter, p-75-a5, Acinetobacter, and Veillonella. Among the DSS group comparison on day 0, specifically, the DSS-treated groups (TH0 vs. M0, TH0 vs. D0, TA0 vs. M0, and TA0 vs. D0) showed higher and significant variation while DSS-treated groups (TH0 vs. TC0, TH0 vs. TA0, TC0 vs. TA0, TC0 vs. D0, TC0 vs. M0, and M0 vs. D0) showed a slight or moderate difference in the microbial taxa magnitude and abundance compared to the corresponding DSS trial groups, respectively (Figure 6 and Table S6).
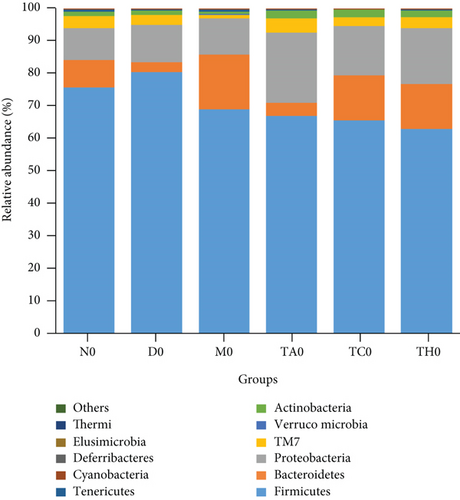
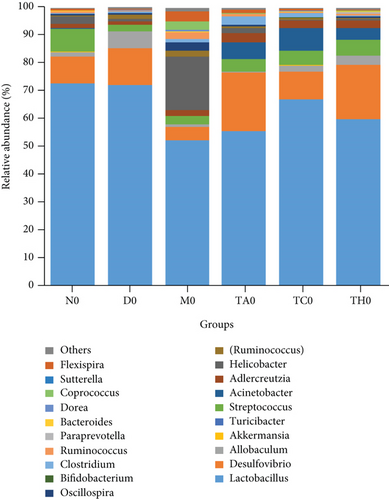
Taken together, the results concluded that the gut microbiota structure and composition at phyla and genus levels had shown no or slight variation in all DSS trials (D0, M0, TA0, TC0, and TH0) compared to the normal group (N0) on day 0. In contrast, a slight to moderate difference was displayed among the DSS-treated groups compared at the phylum level, while a greater intergroup variation was shown among the DSS-treated trial comparisons at the genus level on day 0. No or less variation between the DSS-treated groups vs. normal on day 0 and a greater variation on day 7 imply that changes in the gut microbiota were caused by DSS administration during the modeling period, while a greater intergroup variation in the structure of the gut microbiota (difference in the associated microbial taxa and key biomarker) among the DSS trial group comparison on day 7 implies that this ununiformed differential dysbiotic pattern associated with each DSS trial group during colitis is influenced by the respective group initial gut microbiota composition and structure. All these data clarify an important role of the initial gut microbiota and suggest a causal link of microbial taxa in association with colitis. Generally, our study has shown the same dysbiotic pattern in all DSS groups as was reported in previous studies, where harmful microbial taxa were increased, beneficial microbial taxa were decreased, and the lack to show a specific core microbiome or the same key biomarker associated with all given DSS colitis trial models. Taken together, the overall data indicated that variation in the dysbiotic pattern of DSS trial groups might be associated with each trial group’s respective initial gut microbiota composition, which varies from individual to individual, which may influence response to DSS treatment. Therefore, the confined microbiome associated with colitis is difficult to investigate. For this purpose, mice with harmonized gut microbiota will be a good strategy to validate the results.
4. Discussion
Gut microbiota are known to have a profound and crucial effect on host health, and changes in the gut microbiome have been attributed to IBD pathogenesis [1, 7]. However, the exact conserved microbiome pattern associated with the onset of the disease is unclear. This uncertainty in the gut microbial association has been linked to a variety of potential host and environmental factors such as diet, genotype, age, and living conditions [57, 58, 60, 61]. Here, we have used the mouse model in a controlled condition that allows us to control all possible confounding factors. In addition, multiple studies have also reported that animal sex has a profound impact on microbiome study outcomes and have clearly shown sex-specific differences in the composition of the gut microbiota [59, 79, 80]. We used female sex mice, in part due to the male animals’ aggressive behavior and a possible male gender bias susceptibility to DSS-induced colitis, which may have a potentially negative impact on study outcomes. Furthermore, the sex difference and the aggressive behavior of male mice hamper their housing together, while single housing has an impact on animal wellbeing and is also expensive. Therefore, we preferred to use a unique sex (female mice only) to ease the animal handling and perform the study in limited resources, as well as to avoid sex-dependent gut microbiota interference and observe/assess a uniform effect of the stimulus DSS on the gut microbiota during colitis [81–84].
Much of the gut microbiome knowledge in IBD pathogenesis comes from studies with murine models of colitis [47, 85]. The DSS model of mouse colitis is one of the best and most widely used in vivo experimental models that could best mimic human UC clinical pathology as well as be simple to produce, rapid, reproducible, and controllable [47, 66, 86] and give very clear insights into understanding the pathophysiology of colitis and the microenvironment between gut microbiota, host mucosal immunity, host genetics, diet, and other environmental factors in maintaining gastrointestinal homeostasis [87]. In the present study, we made an effort to investigate a core conserved microbiome that is possibly associated with colitis by inducing DSS colitis models in a large number of mice that were divided into multiple independent groups under the same experimental and housing conditions. The DSS colitis model, with a concentration of 3% for 7 days, mice of 8 weeks old, and type of strain (C57BL6), was used in the relevance of previous studies’ recommendation in an account of successful and easily reproducible induction of DSS acute colitis model [55, 87]. Our study demonstrated the successful induction of acute colitis upon the intake of 3% DSS in drinking for 7 days, which was recognized by the appearance of UC and clinical signs and symptoms including weight reduction, changes in stool features, rectal bleeding, and an increase of DAI. Although all mice of DSS-treated groups showed a successful colitis model on day 7 and well imitated the human UC microenvironment with respect to clinical pathology and gut microbial dysbiosis as described elsewhere in previous studies [47, 48, 88], one or a few mice in each DSS group died before the determined DSS treatment course. It may be due to some intraspecies difference that predisposes the mice to more severe intestinal inflammation, which may lead to death before the determined course. The gut microbiota changes were addressed as a clinical biomarker of colitis, using the phylum and genus taxonomic levels for analysis. Mice with acute colitis after DSS administration showed a clear difference in the microbial community structure, where richness and diversity were decreased, and similar results were also reported in previous studies [15, 89]. The gut microbiota structural pattern in our study has shown that the most abundant phyla were Firmicutes, Bacteroidetes, and Proteobacteria, followed by a second tier of Verrucomicrobia, Candidate Division TM7, and Actinobacteria. Our study showed consistency with previously reported studies which had shown that Bacteroidetes, Firmicutes, Proteobacteria, Verrucomicrobia, and Actinobacteria are the most abundant gut microbial taxa [55, 90]. The dysbiotic pattern of our study showed a decrease in Firmicutes and Bacteriodetes phyla and a decrease in Lactobacillus, Streptococcus, and Ruminococcus genera. Similarly, an increase was shown in Proteobacteria, Candidate Division TM7, Verrucomicrobia, Actinobacteria, Tenericutes, and Cyanobacteria, as well as an increase was also seen in the genera Akkermansia, Turicibacter, Allobaculum, Desulfovibrio, Acinetobacter, Bifidobacterium, Cupriavidus, Pseudomonas, Prevotella, and Ochrabactrum in the DSS-treated groups, which was quite different from the dysbiotic pattern reported in both earlier mentioned studies [55, 90], where a reduced abundance of Bacteroidetes, Verrucomicrobia, Proteobacteria, and Actinobacteria while an increased in the abundances of Firmicutes, Tenericutes, Deferribacteres, and Spirochaetae were reported. In addition, they also showed a reduced abundance of Bifidobacterium spp., Lactobacillus spp., and Akkermansia spp. and increased level of Desulfovibrio spp., Alistipes spp., and Helicobacter spp. which was quite different from our study [55], whereas the study of Yang et al. had reported a high level of Helicobacter and Desulfovibrio while a low level of Lactobacillus species in DSS colitis [90]. Furthermore, Håkansson et al. and Mizoguchi have reported genera Bacteroides distasonis, Clostridium ramosum, Akkermansia muciniphila, and Enterobacteriaceae as dominant microbial community associated with DSS colitis [14, 48]. The most commonly reported dysbiosis pattern of DSS-induced mouse colitis model has been recognized with a decrease in the Lactobacillus group and an increase in Enterobacteriaceae, Akkermansia, and Desulfovibrio [14–16]. However, none of the dysbiotic patterns is consistent in all mouse colitis model studies and showed variations as were also reported in human IBD subjects. For example, in human IBD, the most commonly reported dysbiosis pattern is a decrease in Firmicutes and Bacteroides diversity and an increase in Enterobacteriaceae [23–27], while others reported an increase in Proteobacteria, Bacteroidetes [32], and Actinobacteria [33] and a decrease in Lachnospiracea [33] and Roseburia hominis [34]. In contrast, Seksik et al. reported no alterations in Proteobacteria, Bacteroidetes, and Clostridia, which remained unchanged in CD patients [35]. In accordance with our study, all these data show that DSS has a great effect on the microbial communities and caused a dramatic shift in the microbial community structure and the relative abundance of specific phylotypes following DSS treatment; however, this change was not consistent among all given studies and between our study as what we noted. One obvious reason for this variation could be explained by the fact that differences in specimen type collection (fecal versus tissue), sample anatomic location (cecal mucosa versus distal colonic contents), the disease state of subjects (acute versus chronic), the difference in batch and bred/strains of mice, different housing facility, and experimental protocols, as well as length and concentrations of DSS administration, may explain the inconsistency of results in preclinical research with animal models [66, 67, 91, 92]. Although avoiding all these irreproducibility factors thought to be associated with variation of dysbiosis pattern during colitis, interestingly, our results still showed variability in the associated taxa across the DSS-treated groups compared to the normal as shown by the LDA figure more clearly. Thus, our study failed to draw a defined conclusion of a core conserved microbiome associated with DSS colitis in general. All these data indicate the influence of an internal factor of the gut microbiota that impedes the uniform changes of the gut microbiota in response to DSS treatment. Our DSS intergroup bacterial analysis showed that in response to DSS treatment, some community members were depressed while others increased in abundance; however, this effect was not consistent in terms of degree nor terms of target microbial species of the community across the DSS groups. Thus, DSS showed variable effects for both terms in different DSS trial groups, demonstrating that the effect of DSS treatment on microbial community members in different DSS trials depends on the initial gut microbiota structure and composition, which was shown by the gut microbiota profile of comparative analysis among DSS groups on day 0, where the baseline microbial community structure and abundance level of microbial taxa in each DSS trial group were quite different from each other (see Figures 5 and 6; Tables S5 and S6).
We concluded that variations in the initial gut microbiota are a key factor to the contradictory results observed in DSS-induced colitis experiments under the same experimental condition, where the initial gut microbiota structural composition or their community consortia may affect their susceptibility to DSS and thus respond differently to DSS treatment.
Although many of the gut microbiota influencing factors have been encountered under the control condition, however, this study still has potential limitations such as the cage effect. The cage effect has been recognized as an affecting factor of the gut microbiota [93], which was not encountered in this study, which may influence the outcomes. Our research is of great significance because it advances microbiome research by taking into account the initial gut microbiota during study design and by proposing the investigation of a core microbiome linked to DSS-induced intestinal inflammation, which could aid in the development of precise microbiome-based diagnosis and treatment, for example, a disease-specific personalized FMT formulation to restore dysbiosis and treat IBD and similar other gut microbiota-related disorders. However, the idea to inspect a disease-specific conserved core microbiome association warrants future investigation in a controlled condition with all aspects of the gut microbiota confounding factors.
Ethical Approval
This study protocol was approved by the Ethics Committee of Animal Experiments and the institutional review board of Lanzhou University.
Conflicts of Interest
The authors report that no conflict of interest exists.
Acknowledgments
This work was supported by the Jiangsu Science and Technology Department Major Project (BA2016036) and Gansu Science and Technology Department Major Project (17ZD2FA009). CZ obtained these grants. The authors wish to express their gratitude to Dr. Ahmad du Din (South West Medical University, Liuzhou, China) and Dr. Syed Rafiq Hussain Shah (Dalian Medical University, China) for their guidance during data analysis and literature writing. The authors also thank my colleague Dr. Mian Gul Hilal (Lanzhou University) for his moral support and lab fellow Mr. Zha Lajia, for technical assistance during experiments. We also extend our kind appreciation to MS. Jumei Yang (Lanzhou University Second Hospital, Lanzhou) for the cooperation and supervision during animal experiments in the animal house.
Open Research
Data Availability
The datasets presented in this article are available on a reasonable request. Requests to access the datasets should be directed to CZ, email:[email protected], School of Life Sciences, Lanzhou University, Lanzhou, China.


