A Review for Retrieving Wind Fields by Spaceborne Synthetic Aperture Radar
Abstract
A high-resolution sea surface wind field (SSWF) has high application requirements, such as weather forecast, wind energy evaluation, and oil spill monitoring. The models for retrieving SSWFs based on spaceborne synthetic aperture radar (SAR) are important methods for obtaining high-resolution SSWFs. These models are continuously updated and improved from the prototype to the model to achieve high-resolution and high-precision SSWF retrieval. With the development of SAR technology and the gradual maturation of global ocean observations, SSWF quantitative estimation using SAR has developed from scientific research to operational monitoring. This study summarises the principles and methods of SSWF with multipolarized SAR. Finally, research suggestions and future development directions are put forward.
1. Introduction
Sea surface wind fields (SSWFs) are the main power source for upper ocean movement and an important factor affecting wave generation, water mass formation, and ocean current movement [1]. High-resolution SSWFs retrieved using spaceborne SAR play an important role in numerical weather prediction, maritime transportation, maritime rescue, marine oil spill monitoring, sea ice trajectory prediction, typhoon intensity monitoring, offshore wind energy resource assessment, and more [2]. The estimation of the wind speed (WS) is an important parameter for offshore wind resource assessment, and it can serve the marine fishing and mariculture industries in the “blue breadbasket”-related industries, especially offshore fishing and deep-sea farming, which are closely related to China food security [3, 4].
Traditional SSWF monitoring methods such as on ships, buoys, and land stations cannot meet the increasing demand. These methods can only provide limited space and time coverage data [3]. Spaceborne microwave radiometers and scatterometers provide global-scale SSWF observations [5] with relatively low resolution (about 25 km), which makes it difficult to meet the needs of high-resolution SSWFs [6]. Using spaceborne SAR with a high resolution, a finer-scale SSWF can be retrieved [4]. Additionally, the retrieval of SSWF-based SAR has become a research hotspot [7, 8].
Spaceborne SAR has been widely used in SSWF inversion, and it has achieved fruitful results [9]. In wind direction (WD) inversion research, Gerling [10] found that the linear structural features of SEASAT SAR images were related to the WD, and the WD was estimated based on the image frequency spectrum with a Fourier transform. Subsequently, Fourier transforms, local gradients (LG), and wavelet analysis have been used to retrieve WD. In WS inversion, Jones et al. used SEASAT SAR data and found that there was a certain relationship between the normalised radar cross-section (NRCS) of the SAR and WS [11]. Then, the geophysical model function (GMF) based on the NRCS of copolarized SAR was proposed and continually updated to form a series of empirical models [12, 13]. However, the phenomenon of saturation exists in WS inversion with copolarized SAR when the WS exceeds 25 m/s [14–16]. It was found that C-band cross-polarized SAR could be used to retrieve high WS and was not sensitive to the WD or the radar incidence angle (RIA) [17, 18]. Furthermore, many models have been constructed based on cross-polarized SAR [19, 20].
Therefore, this paper discusses the methods for retrieving SSWF from spaceborne SAR and comprehensively summarises the research status in order to promote the research on SSWF.
2. The Potential and Drawback for SSWF Estimation Using SAR
Compared with other SSWF acquisition methods, such as ships, scatterometers, or radiometers, the potential applications of SAR-based imagery for an SSWF include the following [9]: (1) all-day, all-weather observation capability as well as higher resolution [4]; (2) high-resolution SSWF data obtained for near-shore waters to meet the demand for research on small-scale and medium-scale SSWFs; (3) long-term observations of near-shore SSWFs helping deepen the understanding of the dynamics of the SSWF processes at the sea surface and strengthen the high-resolution SSWF prediction capability of numerical models [20]; (4) in-depth research on the dynamics of small-scale and medium-scale SSWF processes at the surface of the sea, especially in the near-shore region, which can help improve climate models and enhance the ability of climate models to predict small-scale and medium-scale phenomena near the coast [21]; (5) real-time monitoring of disasters. Information on the internal structures of extreme weather events such as tropical cyclones and even typhoons can be obtained, which can aid the in-depth research and dynamic monitoring of typhoons and other disaster events [22]; and (6) SAR inversion of sea surface SSWFs with high resolution but slightly less coverage. The fusion of SSWF data from scatterometers, radiometers, altimeters, SAR, and other sensors to take advantage of the benefits of different sensors and complement each other is more conducive to obtaining more comprehensive and accurate global sea surface SSWF data [9].
The disadvantages include the following aspects: (1) The temporal resolution of the SAR data needs to be further improved. (2) Models concerning the wind speed inversion are mostly based on empirical (EP) fitting models, such as the GMF [23, 24], and research on the physical methods needs to be further improved. In general, wind speeds based on the EP and electromagnetic (EM) models are quite similar for an RIA below 40° since they deliver close NRCS values. Above 40°, wind speeds based on the EM models tend to be overestimated, since the NRCS is smaller. The reason for this is that the contribution of wave breaking and foam to the NRCS has not been considered in the description of EM models. This should be considered in the next steps to improve radar scattering calculation with the EM models [23]. (3) Regarding the inversion of the wind direction, most algorithms are based on the presence of wind streaks, but this feature is not present in every SAR image [9].
The GMF is one of the most important ways to perform the inversion of SSWFs based on SAR data, which is achieved empirically. The advantages of this method are that the model is reliably stable and widely applicable, and the accuracy of the inversion is further improved by the continuous optimisation of the model [23]. There are, of course, shortcomings in the model. The model requires wind direction as an input parameter, which is generally obtained with the inversion of SAR images or from other SSWF data. The former is subject to inaccuracies in the inversion process that may lead to errors in wind speed estimation, while the latter is difficult to reconcile with SAR images for both spatial and temporal scales [25].
3. Wind Direction Retrieval
A precise and accurate estimation of the WDs is one of the main issues for the SSWF retrieval from SAR images [26]. The inferred WDs are typically used as inputs to the GMFs [27]. The lower the estimation errors of the retrieved WDs, the higher the quality of the SAR-derived WSs and consequently the SSWFs.
3.1. Methodology
Boundary layer rolls (BLRs) are atmospheric roll vortices generated by thermal instabilities developing within the marine atmospheric boundary layer (MABL) [28, 29], and they are typically associated with unstable or neutral boundary layer conditions [30, 31]. They appear as black and white linear texture features on the SAR image, that is, wind streaks (or wind rows) [32, 33]. The direction of the streak has a parallel relationship with the sea surface WD [34, 35]. The WD is obtained by determining the direction of the wind streaks in the SAR image [36, 37], laying the foundation for WD inversion [38–40]. When reaching a certain intensity, which for GMFs [41] is WS in the range of 2.4-20 m/s with the error within 2 m/s [5, 40, 42], an SSWF will destroy the stability of the MABL, and a secondary flow pattern (spiral atmospheric boundary layer vortex) will be formed above the primary flow (average SSWF) (Figure 1). The secondary flow acts on the sea surface, resulting in convergence or divergence of the sea surface. When the secondary flow direction acts downward on the sea surface, it forms convergence points that appear as bright spots in the image. When the secondary flow direction acts upward on the sea surface, it forms divergence points that appear as dark spots in the image, resulting in bright and dark stripes on the SAR images. The wind stripes mentioned above are periodic, which provides the basis for wind inversion based on SAR images [43, 44].
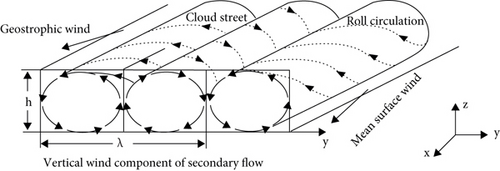


3.2. Method
SAR is a side-looking radar with a fixed observation angle. It cannot measure multiple azimuth angles, which makes it impossible to directly retrieve WS and direction information [9]. Based on the typical features of wind streaks, many methods have been proposed, such as Fourier transform [45–47], LG [38, 48], and wavelet analysis [49, 50]. LG has been widely exploited because the result of the WD has higher resolution and precision. This paper is focused on LG, optimised LG method, wavelet analysis method, and other methods.
3.2.1. Local Gradient
In the SAR image with streaks, the gradient shows the maximum value perpendicular to the streak direction, the main gradient direction of the image is obtained, and the direction perpendicular to this is the WD [38]. The general steps are as follows.
(3) Unusable Points. After calculating all the LGs, the values of the first two rows and the last two columns of the image have to be discarded.
The direction perpendicular to this is the WD, and the obtained WD is blurred in the 180° direction.
3.2.2. Optimised Local Gradient Method
(1) Modified LG (LG-Mod). The LG-Mod method [52] directly extracts the main LG direction (and then the predominant local WD) within the ROIs by using a specific unbiased estimator, avoiding histogram analysis [26]. Figure 2 shows the flowchart of the LG and LG-Mod.
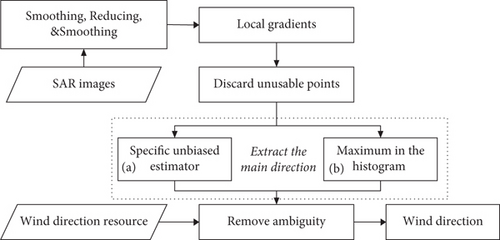
The main difference between the two is the part of the main gradient extraction. The following section introduces the part of the LG-Mod.
| Thresholding | RMSE (°) | MBE (°) |
|---|---|---|
| No | 26.3 | 8.2 |
| α = 0.05; METH = 15° | 21.1 | 6.4 |
| α = 0.05; METH = 10° | 16.5 | 3.8 |
| α = 0.05; METH = 5° | 7.7 | -0.4 |
(2) Improved LG (ILG). For the ILG [53], the calculation process is as shown in Figure 3(a). The difference between the ILG and the LG is that the former combines the smoothing and calculation of the LGs to avoid the difference approximation error effect of the noise.
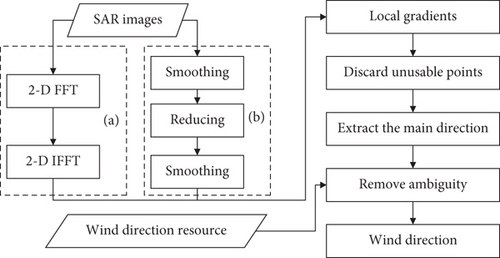
The other steps are the same as those in Koch’s method [38].
3.2.3. Wavelet Analysis Method
The WD based on the wavelet analysis method [54, 55] can quantitatively describe the stripes, through the standard deviation of the mean cross-section of the vertical detail within a wavelet decomposition. The process is shown in Figure 4.
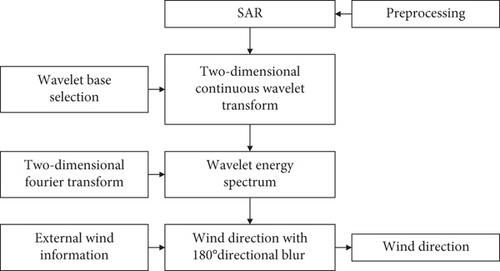
The original SAR image is preprocessed to eliminate the influence of the speckle noise, and then, the image size is reduced.
A two-dimensional continuous wavelet transform was performed (e.g., Daubechies wavelet [49] and Mexican hat [50]) on the SAR image, to obtain the low-frequency wavelet coefficients for the second layer of subdivision.
WD with 180° directional blurring can be obtained by plumbing the line of the two-dimensional wave number spectrum peaks [50].
Finally, the external SSWF data is used to defuzzify the WD, i.e., to obtain the WD.
3.2.4. Other Methods
Since Gerling [10] discovered that there are wind streaks on SAR images that can be exploited to retrieve the WD, other methods, such as detection of the maximum variance direction method [56], the regular method [57, 58], and the method of the gray-level cooccurrence matrix (GLCM) [59, 60], have been proposed.
In terms of the regular method [57, 58], the gradient is solved with numerical differentiation, which can effectively suppress the noise in the image while ensuring a minimum error between the gradient and the “real” image intensity. The method solves the gradient in the following way.
When a = δ2, a unique solution exists [61]. Further, f(x, y) and the gradient can be solved. The rest of the steps are the same as those of the local gradient method [38] for finding the wind direction.
Due to the complexity of SAR imaging and the variability of the atmosphere and the marine environment, not all SAR images contain features of wind streaks, which limits the universal applicability of such methods.
An algorithm of simultaneous WS and WD retrieval (hereinafter called Z-Model1), using CMOD5.N [63] and C-2PO [14], the NRCS of the VV and VH polarizations, and RIA, was proposed [64]. The flowchart for the method is shown in Figure 5(a). The directional ambiguities were resolved by using the different symmetric characteristics of the polarimetric correlation coefficient (PCC) between the VV and VH channels and the NRCS values in quad-polarization. They had odd symmetry and even symmetry with respect to the WD.
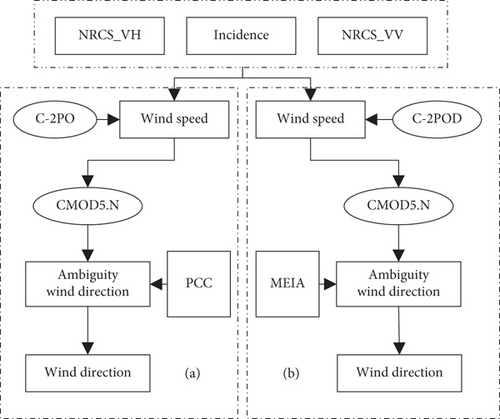
Then, a new model (hereinafter called Z-Model2) was proposed [65], which also achieved the simultaneous inversion of the wind speed and the wind direction by minimizing the cost function constructed by CMOD5.N [63] and C-2POD [65]. Unlike Z-Model1, a parametric two-dimensional sea surface inflow angle model, the model-estimated inflow angle (MEIA) [66, 67], was used to solve the directional ambiguities. The flowchart is shown in Figure 5(b).
Recently, another new approach [22] (hereinafter called the F-Model) has been proposed regarding extreme weather conditions. This approach uses the local gradient method [38] to estimate tropical cyclone (TC) wind directions, and it removes wind direction ambiguities according to TC SSWFs in the northern direction. The procedure of deblurring the WD is shown in Figure 6, as follows: (1) determine the eye centre position of the TC according to [68], (2) ascertain the quadrant of the proper subimage based on the eye centre positions and the specific subimage position, and (3) derive the unique WD according to the criteria in Table 2.
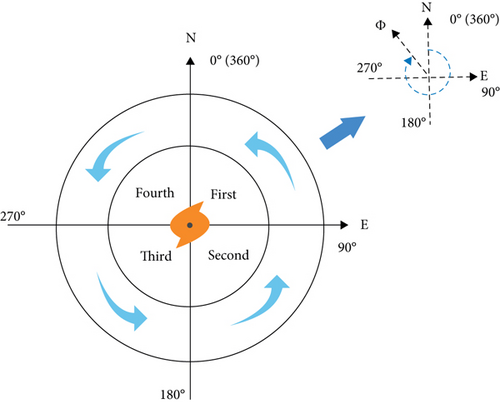
| Quadrant | The first | The second | The third | The fourth |
|---|---|---|---|---|
| Φ | (270°, 360°) | (0°, 90°) | (90°, 180°) | (180°, 270°) |
- Note: where Φ is WD. When the subimage is in the first quadrant, Φ is greater than 270° and less than 360°, and other quadrants and so on.
3.3. Accuracy Verification
The error statistical results of the SAR WD inversion are listed in Table 3. Compared with the SSWF products of the buoy, the numerical model reanalysis data, and the microwave scatterometer, it can be found that the results have good consistency, and the root mean square difference or standard deviation between the data meets the requirements of WD operational accuracy.
| Method | Reference data | Error (°) | SAR data | 180° blur | Reference |
|---|---|---|---|---|---|
| LG | Situ | 26.54 ∗ | Sentinel-1 | Yes | La et al. [25] |
| LG-Mod | Situ | 9.4 ∗ | Sentinel-1 | Yes | Rana et al. [69] |
| ILG | ECMWF | 21.57 ∗∗ | RADARSAT-2 | Yes | Zhou et al. [53] |
| CCMP | 21.61 ∗∗ | Envisat ASAR | Yes | ||
| GLCM | ECMWF | 39.49 ∗∗ | ENVISAT and RADARSAT-2 | Yes | Zheng et al. [59] |
| CCMP | 38.90 ∗∗ | Yes | |||
| Z-Model1 | Situ | 22.5 ∗ | RADARSAT-2 fully polarimetric | No | Zhang et al. [64] |
| Z-Model2 | QuikSCAT | 19.37 ∗ | RADARSAT-2 dual-polarized | No | Zhang et al. [65] |
| Situ | 22.22 ∗ | Gaofen-3 | No | Wang et al. [60] | |
| F-Model | Buoy | 13.3 ∗ | RADARSAT-2 and Sentinel-1A dual-polarized | No | Fan et al. [22] |
- Note: ∗ and ∗∗ indicate RMSE and root mean square, respectively.
4. Wind Speed Retrieval
WS is the main driving force of upper ocean movement, and it is an important factor affecting wave generation, water mass formation, and ocean current movement [70]. Additionally, WS data have important applications for many areas, such as typhoon intensity monitoring and ocean wind energy resource evaluation [71].
4.1. Methodology
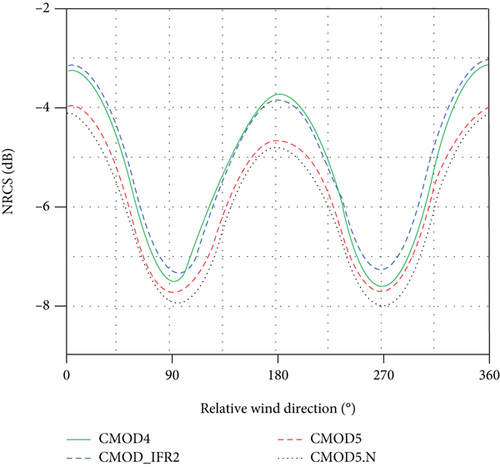
In the microwave band, there is an obvious positive correlation between the intensity of the microwave backscattered signal on the sea surface and the intensity of the WS. For no-WS or extremely low-WS conditions, the sea surface can be regarded as a quasimirror surface. The sea surface echo signal received by the SAR as a side-looking radar is very small. As the WS increases, the sea surface roughness becomes larger, and the sea surface signal is gradually enhanced [27], as shown in Figure 7. The backscattered signal reaches its maximum value when the incident direction of the radar is parallel to the WD, and the intensity of the echo signal when the wind blows toward the radar is slightly stronger than the intensity of the wind away from the radar. The NRCS as a function of the WD relative to the radar observation direction based on different GMFs is shown in Figure 8. The SAR echo signal changes regularly with the WS, which lays the foundation for WS inversion [72, 73].

4.2. Method
In order to quantitatively retrieve the SSWF from the radar backscatter signal, a forward model between the SSWF and the radar backscatter must be established [73, 74]. Models can be divided into two categories: empirical (EP) and electromagnetic (EM) approaches [23]. At present, it is difficult to accurately model the interaction between radar electromagnetic waves and a complicated and rough sea surface, resulting in the accuracy of the microwave remote sensing model of the SSWF based on the physical mechanism being lower than that for the empirical model based on statistics [75–77]. Therefore, studies related to the inversion of an SSWF based on SAR data are mostly based on EP models [4, 11, 27, 78]. EPs based on different polarized modes are introduced in Sections 3.2.1–3.2.3, and EMs are introduced in Section 3.2.4.
4.2.1. Geophysical Model Function
- (1)
The corresponding WS and the direction can be calculated from the observations of the spaceborne radar system
- (2)
The functions can be tabulated or in the form of functions
- (3)
The GMF does not rely on additional meteorological and marine data that is difficult to obtain in real time in business operations. The general form of the GMF is
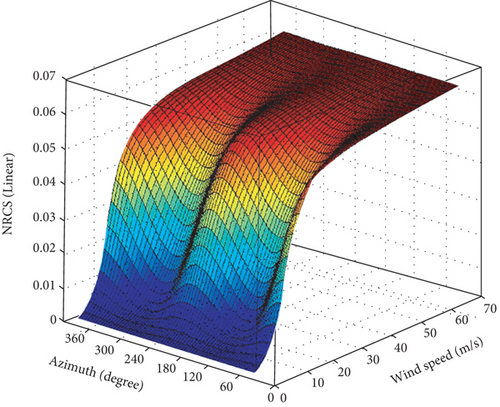
GMFs were originally designed to be used in the SSWF inversion of a microwave scatterometer. Then, they underwent long-term operational optimisation. Because the characteristics of the sea surface backscattering signals obtained by a scatterometer and SAR are similar, they are suitable for the SAR SSWF inversion if the SAR has the same radar wave frequency, polarized mode, and incidence angle distribution range as the scatterometer. Commonly used models are CMOD4 [79], CMOD_IFR2 [80], CMOD 5 [81], CMOD 5.N [63], and CMOD 7 [41].
With the accumulation of SAR data, Mouche and Chapron [82] used ENVISAT-ASAR data and the SSWF of ASCAT, and they established the C-band VV-polarized SAR WS GMF, called C_SARMOD. The comparison with the in situ buoy experiments showed that the RMSE was 1.63 m/s [83]. Lu et al. used RADARSAT-2 and Sentinel-1A VV-polarized SAR images and buoy WS observations to establish the model, called C_SARMOD2, which was verified with buoy observation. Its RMSE was 1.84 m/s [24].
It was necessary to convert the HH-polarized SAR data into VV-polarized backscatter coefficients and then use the GMFs (other empirical models for HH-polarized SAR data are introduced in Section 3.2.2). In order to minimize the possible errors caused by the polarized model, Zhang et al. [84] used Envisat ASAR images and ASACT SSWF data to establish the new model called CMODH. The model was available for HH- and VV-polarized SAR without the need for the polarized ratio model. According to the verification with the WS observed by the buoy, its RMSE was 1.66 m/s [85].
4.2.2. Model for HH-Polarized SAR
For the HH-polarized SAR data, the polarized ratio (PR) model and GMFs are generally used for WS inversion [86, 87]. Other methods are used for HH-polarized SAR, such as Komarov’s model [88].
(1) Polarization Ratio Model. For the HH polarimetric SAR, if using CMOD, PR is first used to convert the NRCS from HH polarization to VV polarization, and then, the GMF is used [89]. These models can be divided into two categories: empirical and theoretical models.
- (a)
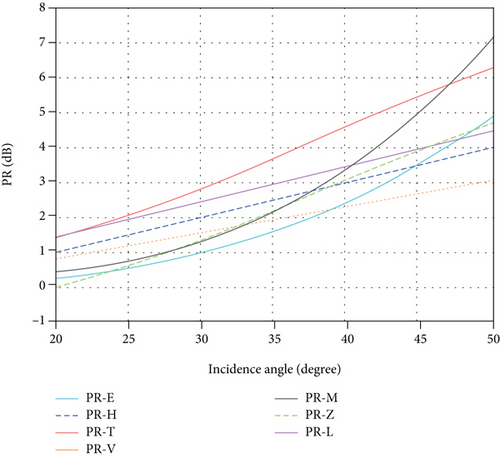
Only Related to the RIA, as shown inTable4. The relationship between the PR and the incident angle for this kind of model is shown in Figure 10.
- (b)
PR Depends on the Incidence Angle and the Azimuth Angle [87]. The general expression is as follows:
- (c)
PR Models Related to the WS. For example, Biao and Perrie [18] proposed a PR model considering the influence of the WS:
(1)2. Theoretical PR. With the widespread applications of spaceborne SAR in the ocean, physical models for the interaction between the ocean surface and radar scattering have been proposed [89], such as the generalised curvature model (GCM) and the two-scale Bragg model [93]. Then, the model should consider the contribution of the wave breaking related to the statistical description of the sea surface [94]. A new physical PR model has extended the improved GCM model [95]. The PRs described above depend on the RIA, WS, and WD [89]. However, the accuracy of the model needs to be further improved, and the application of this kind of PR is rare [96, 97].
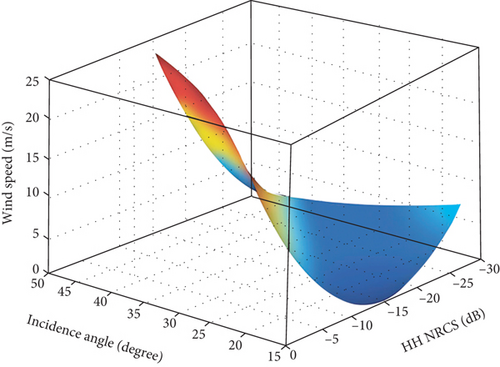
The research [25] shows that (1) for HH-polarized SAR data, Komarov’s model produces better WS estimates than CMOD5.N, which has also been reported in [88], and (2) for VV-polarized SAR data, CMOD5.N produces better WS estimates than Komarov’s model. Additionally, in view of the importance of the wind direction to the GMF, Komarov’s model’s WS inversion effect for the model without consideration of the WD can demonstrate better accuracy.
4.2.3. Model for Cross-Polarized SAR
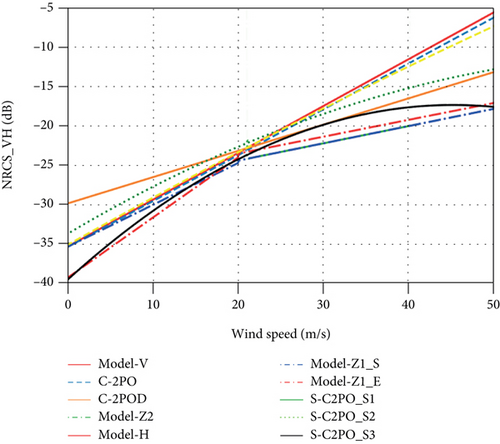
Cross-polarized SAR has a unique advantage for polarimetric synthetic aperture radar. In 2011, Vachon and Wolfe [17] and Zhang et al. [64] found that the sea surface backscattering signal of C-band cross-polarized SAR was not sensitive to the WD and RIA but rather a linear function of the WS, which could be directly used for WS inversion for the first time [18]. Subsequently, Biao and William [14] found that the cross-polarized SAR echo signal could not easily be saturated for the condition of high WS, and they proposed a model called C-2PO that was suitable for high WS inversion. Zhang et al. [19] found that the sea surface echo signal of C-band cross-polarized SAR was dependent on the incident angle by considering the contribution of the cross-polarized band non-Bragg scattering. Using the observation data for the RADARSAT-2 satellite and a hurricane, an improved C-3PO model function was proposed. Zhu et al. [98] proposed a semiempirical algorithm that considered the influence of the WS and the incident angle on a cross-polarized NRCS. The introduction of cross-polarized SAR observation significantly improved the accuracy of the C-band SAR inversion of an SSWF for a high WS [99–105]. Some representative cross-polarized models are shown in Table 5, and the relationship between WS and VH is shown in Figure 12.
The cross-polarized backscatter coefficients do not saturate at WSs up to 60 m/s [106, 107], and the WS inversion using cross-polarized SAR has higher accuracy than that of the copolarized SAR at wind speeds above 20 m/s [14, 15]. Given that the cross-polarized backscatter coefficients are more suitable than the copolarized backscatter coefficients for SSWF inversion under high WS conditions, the utilisation of cross-polarized SAR data is a new frontier for SAR SSWF inversion [9]. However, the high noise equivalent sigma zero [3] leads to large uncertainty in the WS inversion for low to moderate WS conditions, and thus, there are certain limitations that hinder cross-polarized SAR current use.
4.2.4. Electromagnetic Approach
The physical approach attempts to reveal the relationship between radar scattering and an SSWF based on the principle of electromagnetism (EM) [23]. The EM models are constructed based on quasiexact calculations or the asymptotic method. The former includes the method of moment [108] and the forward-backward method [109] and the latter the composite two-scale model [110], the small slope approximation [111], and the Resonant Curvature Approximation (RCA) [112]. When the range of the RIA is from 20° to 60°, the EM models based on asymptotic calculations are more widely used, since their descriptions are much simpler and they work more rapidly, with similar results. Among the EM models based on the asymptotic method, the NRCS calculated with the approximation models is closer to the EP approach [23, 113].
4.3. Accuracy Verification
The authenticity test of an SSWF retrieved with SAR is the premise of its quantitative application [5, 23]. Table 6 shows the error statistical results of some representative SAR SSWF remote sensing products. After comparison with the fixed buoy, numerical model reanalysis data, and microwave scatterometer SSWF remote sensing products, it can be found that the SAR remote sensing SSWF products have good consistency with the other SSWF data, and the root mean square difference or standard deviation between the data is less than 2.0 m/s. However, the inversion accuracy obtained from different satellites or different polarized data for the same satellite is still different, which is associated with the data quality of the satellite load, calibration accuracy, mode function, and the use of external auxiliary data. Overall, for the conditions of low and medium WSs (<20 m/s), the retrieval accuracy of SAR can be similar to or the same as that of other remote sensing methods. However, for the condition of high WSs, the retrieval of an SSWF by SAR still faces challenges.
| Data | Polarization | Reference data | Error | Speed | Reference |
|---|---|---|---|---|---|
| RADARSAT-1 | HH | Buoy | 1.76 | <20 | Monaldo et al. [114] |
| HH | QuikSCAT | 1.54 | <20 | Thompson et al. [115] | |
| ENVISAT/ASAR | VV | Buoy | 1.41 | <15 | Yang et al. [42] |
| VV | ASCAT | 1.77 | <15 | ||
| VV | NOGAPS | 1.61 | <15 | ||
| Sentinel-1 | VV | ASCAT | 1.42 | <20 | Monaldo et al. [40] |
| HH | 1.48 | <25 | |||
| VV+VH | SMAP | 2.59 | <50 | Mouche et al. [116] | |
| Gaofen-3 | VV | ASCAT | 2.04 | <20 | Ren et al. [117] |
| VV | HY2A/SCAT | 1.93 | <20 | ||
| HH | ASCAT | 1.85 | <20 | ||
| HH | HY2A/SCAT | 1.73 | <20 | ||
| HV | NDBC buoys | 2.02 | <20 | Zhu et al. [98] | |
| VH | 1.96 | <20 | |||
| RADARSAT-2 | VH | QuikSCAT | 3.63 | <40 | Zhang et al. [65] |
| VH | SFMR | 2.81 | <40 | Zhang et al. [104] | |
- Note: the error is the standard deviation or root mean square error, and the units of the error and speed are m/s.
5. Conclusion and Outlook
The WD inversion for the SAR image data is based on the wind streak features in the SAR data. Due to the complexity of the SAR imaging and the variability of the sea and air environment, not all of the SAR images contain clear wind streak features [118, 119]. There are certain limitations in obtaining the WD with this method [64, 120]. Hence, scholars have proposed the inversion of the WD based on numerical calculation methods [121, 122] in view of the fact that there are not many applications of this type of algorithm.
In the WS inversion research, the GMF model has undergone a series of updates and improvements, and the accuracy of the model has been improved. This model is the most widely used. However, at high WSs, there is saturation based on the copolarized data [19, 123]. The cross-polarized model is more suitable for the inversion of the WS in extreme weather (such as hurricanes) [124, 125], but in terms of the applicability and accuracy of the model, there is still a large amount of room for improvement.
Overall, however, the SSWFs retrieved based on SAR data already have similar accuracy to those for other microwave remote sensors, as well as high resolution and strong observation capabilities in coastal waters. This type of retrieval has been operationalized in the meteorological and oceanographic departments of many countries.
With the development of SAR technology, the spatial coverage and continuous observation capabilities of SAR SSWF data will be further improved, and the dynamic and continuous observation of global seas is expected to be achieved.
- (1)
The WD inversion method based on the features of wind stripes in SAR images still has a lot of room for research
- (2)
The inversion of high WS (>35 m/s) still has large uncertainties
- (3)
There are few studies considering the interference of rain with the radar backscattered signal on the sea surface
- (4)
The method of combining multiplatform and multisource data is used to obtain SSWF information with higher spatial and temporal resolution
- (5)
The research on ocean SSWF inversion based on machine learning and deep learning has broad prospects
- (6)
For an SSWF, the wave field and the current field are mutually coupled, and the new system of radar satellites provides new opportunities and challenges for sea surface dynamic parameter inversion
Conflicts of Interest
The authors declare that there is no conflict of interest regarding the publication of this paper.
Acknowledgments
This work was jointly supported by the project of Major scientific and technological innovation in Shandong Province (Y9338301).


