Thermodynamic, Nonlinear Kinetic, and Isotherm Studies of Bisphenol A Uptake onto Chemically Activated Carbons Derived from Safou (Dacryodes edulis) Seeds
Abstract
The interest of this work is to evaluate the possibility of using safou seeds to develop a new low-cost adsorbent and study its application to remove bisphenol A from an aqueous solution for a sustainable and ecological use of this biomass. This was done by optimizing some parameters that influence the adsorption process. The central composite design with four centre points was used to optimize the process variables. The concentration of bisphenol A solution, adsorbent dosage, stirring time, and solution pH on the adsorption capacity were considered, while the response measured was the quantity adsorbed. The activated carbon obtained by treatment with H2SO4 was named NSST and that obtained by treatment with H3PO4 was named NSPT. XRD revealed an amorphous character for the ACs, and EDXS showed they are mainly carbonaceous. Under the optimal adsorption conditions, NSPT showed the best performance. Correlation coefficients R2 and R2adj were of 85.13 and 69.12% for NSPT and 83.71 and 66.17% for NSST. A pseudo-second-order nonlinear kinetic model best described the adsorption kinetic of BPA removal by the ACs. Langmuir’s isotherm best described the adsorption of BPA onto both adsorbents. Thermodynamic studies suggested an exothermic and physisorption process.
1. Introduction
Water is the natural resource particularly used in our everyday life and mostly for industrial processes. After use, its release into the environment in more or less highly polluted residual form poses a serious threat to the aquatic fauna because it accumulates in their organisms due to their non- or low biodegradability. These chemicals include endocrine disruptor compounds among which is bisphenol A (BPA). The latter is classified as a priority pollutant by the European Union and the United States Environmental Protection Agency. Also known as 4,4’-(propane-2,2-diyl)diphenol, BPA is an emerging contaminant that is often detected in natural waters at levels of ng/L or μg/L, making it a trace organic contaminant. It is obtained by the reaction between two equivalents of phenol and one equivalent of acetone. This compound is widely applied to produce plastics, resins, and other materials [1]. Bisphenol A, found in tap water, surface water, air, and foodstuffs in considerable quantities [1–3], is now part of the so emerging pollutants. It is capable of mimicking the effects of estrogens that are linked to diabetes, cardiovascular disease, breast and prostate cancer, infertility with changes in sperm quality, and hyperactivity in children [4–6]. In light of the risks, the removal of this chemical from wastewater has attracted attention since the specific migration limit for BPA in food is 0.6 μg/g [7]. Moreover, the maximum concentration in the surface water is 12 μg/L in the USA and 21 μg/L in the Netherlands.
Studies have shown that due to the anaerobic or hypoxic state of water, the degradation of bisphenol A in natural water is slow or does not even occur [8]. Therefore, the concentration of bisphenol A in surface water fluctuates greatly depending on the region and discharge time [9]. From the literature, several industrial processes are described to overcome the problem of water pollution by chemicals [10–12]. At a time when the world is facing a major energy challenge, these processes, which are for the most part energy-intensive, lead to the formation of secondary products, which are often toxic and also contribute to global warming. It thus becomes essential to turn to techniques that require renewable resources to the detriment of fossil resources. It is as a result of this that adsorption that can be done on several types of adsorbent supports [13–16] became the most coveted industrial depollution technique. Recently, safou seeds have shown interesting adsorption properties [17]. Adsorption has attracted further attention due to advantages such as ease of use, low energy consumption, high efficiency, cost-effectiveness, flexibility, and a wide variety of existing adsorbent systems [1, 3, 13, 18]. The latter is even more advantageous when the adsorbent support is available and abundant.
Nowadays, the use of eco-friendly, low-price, nontoxic, renewable, and biodegradable adsorbents revealed exceptional and compelling sorption efficiency for pollutants [19]. Tropical Africa is full of potential valuable fruit species that are not only abundant but also available almost round the year and tend to generate large amounts of waste residue that can be used for activated carbon preparation. As an example, safou seed residues are widely distributed in Cameroon. Based on this observation, the context of this work is to evaluate the possibility of using safou seeds to develop a new low-cost adsorbent and study its application to remove bisphenol A from aqueous solution for a sustainable and ecological use of this biomass. The cultivation of safou is abundant in Cameroon, and after the consumption of the fruits, the seeds are thrown away as waste. However, they are rich in saturated fatty acids and unsaturated fatty acids [20], which give their molecular surface interesting properties for an efficient adsorption of organic pollutants. To the best of our knowledge based on the literature, safou seeds have not yet been the subject of BPA adsorption study using the response surface methodology (RSM).
Since the ability of activated carbon to remove pollutants is severely affected by some factors such as temperature, sorbent dosage, contact time, initial concentration of pollutant, and pH, it is therefore essential to design a suitable process to achieve the maximum uptake capacity of pollutants by the adsorbent [21]. With the traditional methods, the effect of only one variable is studied at a time, and it does not investigate the interactive impact between the variables. Hence, it could not display an overall effect of variables on the appropriate response [22, 23]. The response surface methodology is one of the statistical tools used to rectify this issue. In that case, the RSM has been widely applied in chemical engineering and the environment field. Thus, the central composite design (CCD) under RSM can result in an empirical model due to combined effective parameters and corresponding interactions to optimize the adsorption process [13, 24, 25]. The aims of this research are as follows: (1) to apply ACs characterized by XRD, FTIR, EDXS, pH at the zero-point charge, and BET/BJH methods for an optimal adsorption of BPA in aqueous solution using CCD with four centre points; (2) to reveal the effects of four independent variables (contact time, sorbent dosage, concentration, and pH of pollutant solution) and their interactions on BPA uptake capacity; (3) to model some adsorption kinetics and isotherms by the nonlinear regression method; and (4) to study the effect of temperature on the adsorption process. The interest of this work is the efficient removal of organic pollutants by activated carbon based on agricultural by-products for a sustainable use of local biomass.
2. Materials and Methods
2.1. Materials
2.1.1. Instrumentation
Determination of the functional groups present on the surfaces the materials was done using Fourier transform infrared (FTIR) spectrophotometry. The IR spectra of the ACs were recorded using a Genesis FTIRTM brand spectrophotometer ATI Mattson equipped with a DTGS (deuterated triglycine sulfate) detector in transmission mode between 4000 and 400 cm−1. The pH measurement was performed with a Mettler Toledo AG pH meter. For the determination of the crystalline or amorphous structure of the activated carbons, the diffraction patterns were recorded using an STOE Stadi-p device (STOE & Co. GmbH, Darmstadt, Germany) with a Cu Kα1 radiation (λ = 1.54056 Å, 40 kV, 30 mA) between 0 and 70°. With regard to energy-dispersive X-ray spectrometry (EDXS), a Euro Vector CHNS-O brand device (Euro EA 3000) made it possible to identify the different elements present in the activated carbons. The Brunauer–Emmett–Teller (BET) coupled with Barrett–Joyner–Halenda (BJH) method gave some textural properties of the ACs by N2 adsorption at 77.13 K using a micrometric sorptometer (Thermo Electron Corporation, Sorptomatic Advanced Data Processing). A UV Genesys 10S UV-Vis spectrophotometer of Thermo Scientific was used at the maximum wavelength of 276 nm to determine the residual concentration of BPA in solution.
2.1.2. Chemicals
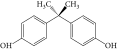
All the chemicals used were of analytical grade; bisphenol A with a purity of 97% was purchased from Sigma-Aldrich (Germany) and used as such. BPA stock solutions were prepared by dissolving 0.1 g BPA in 1 L containing less than 10% methanol. Test solutions were made by diluting the stock solutions. 0.10 mol/L NaOH and 0.10 mol/L HCl were used to adjust the pH of the solutions. Distilled water was used throughout this study. The chemical structure and some properties of bisphenol A are presented in Table 1.
| Chemical structure | |
|---|---|
 |
|
| Molecular formula | C15H16O2 |
| Molecular weight (g/mol) | 228.29 |
| λmax (nm) | 276 |
| Solubility | Soluble in alcohol and slightly soluble in CCl4 |
2.1.3. Adsorbents
Two activated carbons (ACs) prepared by chemical means using H3PO4 and H2SO4 were used in this work. They were labeled as follows: NSPT for that activated with H3PO4, and NSST for that activated with H2SO4. The preparation of the ACs was made using CCD, and the variables whose effects were simultaneously observed are the concentration of the oxidizing agent (varying between 1 and 3 mol/L), the calcination temperature (between 400 and 700°C), and the calcination time in the oven (between 30 and 120 minutes) as described by Atemkeng et al. [17].
2.1.4. Characterization of the Adsorbent
Knowledge of some physicochemical properties of an adsorbent material is useful and contributes to the understanding of phenomena, e.g., in the adsorption process. The ACs have undergone few characterizations such as X-ray powder diffraction (XRD), Fourier transform infrared (FTIR) spectrophotometry, energy-dispersive X-ray spectrometry (EDXS), pH at the zero-point charge, and the BET/BJH method.
3. Methods
3.1. Batch Procedure
3.1.1. Central Composite Design as Optimization Approach
The expected response was the amount of bisphenol A adsorbed obtained from equation (1). The response was labeled as Y1 and Y2, respectively, for the quantity of BPA adsorbed onto NSPT and NSST AC.
3.1.2. Codification of the Levels of the Variable
| Variable level | Low value | Centre point | High value |
|---|---|---|---|
| Coded value | −1 | 0 | 1 |
| Concentration of BPA (mg/L) | 20 | 100 | 180 |
| Activated carbon dosage (mg) | 25 | 62.5 | 100 |
| Stirring time (min) | 6 | 63 | 120 |
| pH of BPA solution | 2 | 6 | 10 |
3.2. Kinetic and Isotherm Studies
The controlling mechanisms for BPA adsorption onto the ACs were deduced. Data from the kinetic experiments were analyzed using four different nonlinear kinetic models. For the adsorption equilibrium, data were analyzed using four model isotherms. The kinetic and isotherm models studied are presented in Table 3.
| Models | Nonlinear forms | References |
|---|---|---|
| Adsorption kinetics | ||
| Pseudo-first-order | [28] | |
| Pseudo-second-order | [29] | |
| Elovich | qt = (ln(αβ)/β) + (ln(t)/β) | [30] |
| Intraparticle diffusion | qt = Kidt1/2 + C | [31] |
| Adsorption isotherms | ||
| Langmuir | Qe = (QmKLCe/1 + KLCe) | [32] |
| Freundlich | Qe = KfCe1/n Qe = Qmexp(−K′ε2) | [32] |
| Dubinin–Radushkevich | ε = RTln(1 + (1/Ce)) | [33] |
| Temkin | Qe = (QmRT/ΔQ)ln(KTCe) | [34] |
3.2.1. Error Function Analysis
For this study, the nonlinear regression method was applied using Microsoft Excel Solver function for fitting the curve. The best fit for experimental data was determined from the coefficient of sum of square of errors (SSE), the average relative error (ARE), the residual root mean square error (RMSE), the nonlinear chi-squared test (χ2), and determination coefficient (R2). The mathematical expression for error function analysis used in this work is presented in Table 4.
| Error functions | Abbreviations | Formulae | References |
|---|---|---|---|
| Sum of square of the errors | SSE | [35] | |
| Average relative error | ARE | [36] | |
| Residual root mean square error | RMSE | [37] | |
| Nonlinear chi-squared test | χ 2 | [38] | |
| Coefficient of determination | R 2 | [36] |
- where qe,calc and qe,meas are, respectively, the calculated adsorbate concentration at equilibrium (mg/g) and the measured adsorbate concentration at equilibrium (mg/g).
3.3. Influence of Temperature on the Adsorption Process
4. Results and Discussion
4.1. Characterization of the Activated Carbons
4.1.1. Fourier Transform Infrared (FTIR) Spectroscopy of NSPT and NSST Activated Carbons
In order to appreciate the effect of impregnation and calcination, the IR spectra of the NSST and NSPT carbons were superimposed on those of the raw agricultural residue NSB. From these spectra, we observe several absorption bands characteristic of the different functional groups present on their surfaces as shown in Figure 1.

The spectral shape of raw safou seeds reveals at 3649.44 cm−1 a vibration band attributable to the O-H bond of polysaccharides, lignin, alcohols, or phenols. At 2923.87 cm−1 and 2854.07 cm−1, bands characteristic of the vibrations of the C-H bonds of the aliphatic CH and CH2 are observed. At 1749.65 cm−1, a band characteristic of the vibrations of the C = C bonds of the aromatic rings appears. Around 1458.04 cm−1, we observe a band that can be attributed to vibrations of the O = C-O bonds of saturated and unsaturated fatty acids and to the C-O bond of the carbonyl groups of lignin [39]. Finally, around 923.91 cm−1, a band is observed that can be attributed to the vibrations of the C-H bond of the polynuclear aromatic rings [40].
For the NSPT and NSST activated carbons, no band appears between 3649.44 and 1800 cm−1. This could be explained by a reorganization of the atoms within the molecular matrix of the precursor during the process of oxidation and carbonization. Furthermore, this could be due to the degradation of the material surface during the calcination process, thereby causing the departure of C, H, and O atoms in the form of gases (CO2, CH4, and CO) and the disappearance of the water molecules [37]. For NSPT carbon treated with phosphoric acid, the band appearing around 1397.25 cm−1 and absent on the spectral shape of the raw material and the NSST carbon can be attributed to the vibration of the C-O bond present in the P-O-P chains of polyphosphates [41]. This can be explained by the incorporation of phosphorus within the molecular matrix of the precursor during its impregnation with H3PO4. These observations are proof that activation and carbonization took place but without completely destroying the surface chemical functions of the precursor.
4.1.2. X-Ray Diffraction (XRD) of NSPT and NSST Powder Activated Carbons
In order to have an idea on the amorphous or crystalline character of the activated carbons, the diffractograms of the samples were recorded and are represented in Figure 2.

These diffractograms show no peak, which may indicate a certain crystallinity of the samples. This observation confirms the amorphous nature of activated carbons, which is an advantageous property for adsorption processes and indicative of a porous structure [42]. Moreover, the observed amorphousness confirms that NSST and NSPT ACs could have high microporosity [43]. Therefore, safou seeds are good precursors for the preparation of powdered activated carbons.
4.1.3. Energy-Dispersive X-Ray Spectrometry (EDXS) of NSPT and NSST Activated Carbons
Results of EDXS analysis of the activated carbons are depicted in Figure 3, while Table 5 summarizes the elements present and their respective proportions.

| ACs | Elemental composition (%) | |||||||||||
|---|---|---|---|---|---|---|---|---|---|---|---|---|
| C | O | Mg | Al | Si | P | S | K | Cu | Zn | Cl | Ca | |
| NSPT | 45.83 | 40.69 | — | 0.98 | 0.86 | 9.38 | 0.38 | 0.05 | 0.90 | 0.67 | — | 0.12 |
| NSST | 52.03 | 39.8 | 0.19 | 0.09 | 0.34 | 0.6 | 2.39 | 2.75 | 0.97 | 0.70 | — | — |
From the observation of the data in Table 5, we notice that these samples contain mainly carbon. One can thus confirm that the materials are activated carbons because they obey the definition of an activated carbon, which is a highly carbonaceous amorphous material. We also observe that the main heteroatom present is oxygen. This can be explained by the presence of many oxygenated chemical functions on the surface of the NSPT and NSST carbons.
4.1.4. BET/BJH Method and pH at the Zero-Point Charge
From Table 6, it can be observed that the use of H2SO4 as an oxidizing agent leads to the development of micropores, while H3PO4 promotes the development of micropores and mesopores. Indeed, the use of phosphoric acid retains carbon and promotes the formation of crosslinks through dehydration, cyclization, and condensation reactions on the one hand. On the other hand, it allows the redistribution of biopolymers, which facilitates their conversion into aromatic rings and forms larger pores. This result can furthermore be used to explain the high removing capacity of NSPT adsorbent compared with that of NSST AC. The higher the porosity of adsorbent material, the higher the specific surface area and the number of sites available for the fixation of pollutants during the adsorption process [1]. The pH at the zero-point charge (pHzpc) was found to be 4.36 for NSPT and 6.94 for NSST as reported by Atemkeng et al. [17].
| CAs | SBET (m2/g) | Micropores | Mesopores | ||||
|---|---|---|---|---|---|---|---|
| SBET (m2/g) | Cv (cm3/g) | Ad (nm) | SBET (m2/g) | Vc (cm3/g) | Ad (nm) | ||
| NSPT | 326.68 | 443.95 | 0.14 | 0.37 | 21.25 | 0.03 | 2.03 |
| NSST | 10.89 | 13.85 | 0.01 | 1.13 | — | ||
- Vc = cumulative volume; Ad = average diameter.
4.2. Batch Mode Adsorption Procedure
4.2.1. The Analysis of BPA in Solution
The endocrine disruptor analysis in the solution was performed in the zero-order BPA absorption spectrum. As shown in Figure 4, the solution used contained 20 mg/L BPA, whose zero-order absorption spectrum was read at wavelengths between 240 and 400 nm. As indicated, the analyte showed the maximum wavelength (λmax) at 276 nm while preparing the calibration curve of BPA at λmax.

The UV-Vis spectrum in Figure 1 recorded between 240 and 400 nm shows an absorption band at 276 nm. This band comes from the π − π∗ transitions characteristic of energy absorption by the C = C ethylenic chromophores of the aromatic ring of BPA [44]. Indeed, after absorption of energy by these chromophores, an excitation of one or more electrons from the π orbitals to the π∗ orbitals occurs.
4.2.2. Experimental Design
The results obtained under the experimental conditions are shown in Table 7. By referring to the values of the residues in this table, it can be seen that they are much lower than the experimental and theoretical values. Thus, there is a good correlation between these experimental and theoretical values because they are close. The quantities of bisphenol A adsorbed by the NSPT and NSST activated carbons are, respectively, represented by Y1 and Y2.
| Test n° | Concentration (mg/L) | Mass (mg) | Time (min) | pH | Quantity ads (mg/g) by NSPT, Y1 | Quantity ads (mg/g) by NSST, Y2 | ||||
|---|---|---|---|---|---|---|---|---|---|---|
| Exp val | Pre val | Residue | Exp val | Pre val | Residue | |||||
| 1 | −1 | 1 | 1 | 1 | 6.793 | 7.830 | 1.037 | 6.747 | 7.473 | 0.726 |
| 2 | 0 | 0 | 0 | 1 | 9.963 | 12.430 | 2.467 | 10.072 | 11.308 | 1.236 |
| 3 | −1 | 1 | −1 | −1 | 6.065 | 4.599 | 1.466 | 6.179 | 6.036 | 0.143 |
| 4 | −1 | 1 | −1 | 1 | 6.724 | 7.250 | 0.526 | 5.315 | 4.092 | 1.223 |
| 5 | −1 | −1 | −1 | 1 | 18.727 | 17.133 | 1.594 | 4.079 | 5.772 | 1.693 |
| 6 | 1 | 1 | 1 | 1 | 15.339 | 12.766 | 2.573 | 15.407 | 10.267 | 5.14 |
| 7 | 0 | 0 | 0 | 0 | 12.872 | 12.670 | 0.202 | 13.850 | 12.111 | 8.261 |
| 8 | −1 | 0 | 0 | 0 | 10.581 | 10.223 | 0.358 | 11.159 | 9.289 | 1.87 |
| 9 | 1 | 1 | −1 | 1 | 9.248 | 9.024 | 0.224 | 9.339 | 10.136 | 0.797 |
| 10 | 0 | 0 | 0 | −1 | 11.744 | 10.495 | 1.249 | 11.853 | 11.212 | 0.641 |
| 11 | 0 | 0 | 1 | 0 | 12.468 | 13.471 | 1.003 | 12.613 | 13.365 | 0.752 |
| 12 | 0 | 1 | 0 | 0 | 11.497 | 12.105 | 0.254 | 7.334 | 10.074 | 2.74 |
| 13 | 1 | −1 | −1 | 1 | 13.268 | 13.522 | 0.254 | 13.631 | 12.197 | 1.434 |
| 14 | 1 | 1 | 1 | −1 | 13.543 | 14.495 | 0.952 | 9.470 | 8.508 | 0.962 |
| 15 | −1 | −1 | 1 | 1 | 16.897 | 16.177 | 0.72 | 11.079 | 10.348 | 0.269 |
| 16 | 1 | −1 | 1 | 1 | 14.904 | 15.728 | 0.824 | 15.449 | 16.523 | 1.074 |
| 17 | 0 | 0 | −1 | 0 | 10.868 | 11.083 | 0.215 | 11.050 | 10.44 | 0.61 |
| 18 | 1 | 1 | −1 | −1 | 7.702 | 8.763 | 1.061 | 7.793 | 7.442 | 0.351 |
| 19 | −1 | −1 | −1 | −1 | 8.625 | 11.534 | 2.909 | 9.08 | 10.138 | 1.058 |
| 20 | 1 | 0 | 0 | 0 | 10.505 | 12.080 | 1.575 | 10.613 | 13.079 | 2.466 |
| 21 | 1 | −1 | −1 | −1 | 11.992 | 10.313 | 1.679 | 11.719 | 11.925 | 0.206 |
| 22 | 0 | 0 | 0 | 0 | 13.813 | 12.670 | 1.143 | 11.959 | 12.111 | 0.152 |
| 23 | 0 | 0 | 0 | 0 | 13.804 | 12.670 | 1.134 | 12.359 | 12.111 | 0.248 |
| 24 | −1 | −1 | 1 | −1 | 12.989 | 12.570 | 0.419 | 12.716 | 12.850 | 0.134 |
| 25 | −1 | 1 | 1 | −1 | 7.088 | 7.170 | 0.082 | 7.201 | 7.553 | 0.352 |
| 26 | 0 | −1 | 0 | 0 | 16.443 | 17.054 | 0.611 | 15.898 | 13.753 | 2.145 |
| 27 | 0 | 0 | 0 | 0 | 13.850 | 12.670 | 0.91 | 12.068 | 12.111 | 0.043 |
| 28 | 1 | −1 | 1 | −1 | 14.7 | 14.510 | 0.19 | 14.245 | 14.386 | 0.141 |
- Exp val = experimental value; pre val = predicted value; ads = adsorbed; residue = |Exp val − pre val|.
4.2.3. Analysis of Variance
| Adsorption of bisphenol A onto NSPT AC | Adsorption of bisphenol A onto NSST AC | ||||||||
|---|---|---|---|---|---|---|---|---|---|
| Variable | Df | Y1 | Variable | Df | Y2 | ||||
| MS | f-ratio | p-value | MS | f-ratio | p-value | ||||
| A | 1 | 15.5162 | 4.63 | 0.0508 | A | 1 | 64.6422 | 19.33 | 0.0007 ∗ |
| B | 1 | 110.241 | 32.88 | 0.0001 ∗ | B | 1 | 60.9077 | 18.22 | 0.0009 ∗ |
| C | 1 | 25.6853 | 7.66 | 0.016 ∗ | C | 1 | 39.7297 | 11.88 | 0.0043 ∗ |
| D | 1 | 16.849 | 5.03 | 0.043 ∗ | D | 1 | 0.0412 | 0.01 | 0.913 |
| A2 | 1 | 5.9425 | 1.77 | 0.2060 | A2 | 1 | 2.5426 | 0.76 | 0.399 |
| AB | 1 | 28.9875 | 8.65 | 0.0115 ∗ | AB | 1 | 0.1449 | 0.04 | 0.838 |
| AC | 1 | 10.0014 | 2.98 | 0.107 | AC | 1 | 0.0626 | 0.02 | 0.893 |
| AD | 1 | 5.7025 | 1.70 | 0.214 | AD | 1 | 21.518 | 6.44 | 0.024 ∗ |
| B2 | 1 | 9.4018 | 2.80 | 0.117 | B2 | 1 | 0.1781 | 0.05 | 0.821 |
| BC | 1 | 2.3608 | 0.70 | 0.416 | BC | 1 | 1.4286 | 0.43 | 0.524 |
| BD | 1 | 8.6789 | 2.59 | 0.131 | BD | 1 | 5.8648 | 1.75 | 0.208 |
| C2 | 1 | 0.3980 | 0.12 | 0.735 | C2 | 1 | 0.0057 | 0.00 | 0.967 |
| CD | 1 | 3.9700 | 1.18 | 0.296 | CD | 1 | 3.4754 | 1.04 | 0.326 |
| D2 | 1 | 3.7599 | 1.12 | 0.308 | D2 | 1 | 2.1658 | 0.65 | 0.435 |
| R2 = 85.13%; R2adjusted = 69.12% | R2 = 83.71%; R2adjusted = 66.17% | ||||||||
- ∗ = significant factor; Df = degree of freedom; MS = mean square.
These tables indicate that equation models (7) and (8) can be used adequately to describe the adsorption of bisphenol A over a wide range of operating conditions. With regard to the adsorption of this pollutant, the quadratic interactions AB, AD, A2, and the effect of D, A, B, and C have a significant influence. They all have probability values ≤0.05. Thus, it can be concluded that this statistical model is adequate to predict the adsorption of bisphenol A by NSPT and NSST ACs in the range of variables studied. For the models presented by the quadratic equations, values of correlation coefficients R2 and R2adjusted of 85.23% and 69.12% for Y1 and of 83.71% and 66.17% for Y2 imply each that the regression model establishes an acceptable correlation between the experimental values. They can thus provide a better relational explanation between the independent variables and the response.
4.2.4. Pareto Diagram and Analysis of Adsorption Response Surfaces of Bisphenol A
Figure 5 presents Pareto diagrams and response surfaces that show the variation in the amount of BPA adsorbed. The response surfaces obtained offer the possibility of observing the behavior of the quantity of bisphenol A adsorbed. One can note the synergistic or antagonistic effect of all the variables investigated. From Pareto diagrams, it is possible to establish an interaction link between the variables taken into account during the adsorption process. It can be observed that the quadratic interactions AD, AB, and the effects of the concentration of the pollutant solution, the duration of agitation, and its pH have a significant and synergistic effect on the quantity of bisphenol A adsorbed.


From Figure 5(a), it is observed that the quantity of bisphenol A adsorbed by the NSST AC increases with the pH. Here, we are witnessing a protonation of the –OH functions of bisphenol A molecules. This phenomenon promotes the establishment of electrostatic interactions of an attractive nature between the bisphenol A molecules positively charged in solution and the NSST activated carbon whose surface is negatively charged. This is due to the fact that the pHZPC (6, 94) of NSST AC is greater than pH 6 of the analyte solution [45].
Figure 5(b) shows that the quantity of adsorbed pollutant decreases when the mass of carbon increases from 25 to 100 mg. This behavior may be due to the number of adsorption sites, which decreases with the amount of adsorbent [46]. Indeed, the increase in adsorbent dosage makes it possible to increase the adsorption sites, but the bisphenol A molecules have more difficulty approaching these sites because of the congestion. This crowding could be due to the formation of clusters of carbon particles when the mass increases. This thus induces a reduction in the total adsorption surface by preventing the diffusion of analyte molecules inside the pores of the carbon. Consequently, this results in a decrease in the amount of bisphenol A adsorbed per unit mass [47].
Finally, the quantity of bisphenol A adsorbed by NSPT and NSST adsorbents increases when the concentration increases from 20 to 180 mg/L. This phenomenon can be explained by the fact that at low concentration, there are still adsorption sites not occupied by the molecules of BPA. Thus, the increase in the concentration of the pollutant in the medium will shift the equilibrium of the system in the direction that favors the accumulation of the analyte on the AC surface. Vacant adsorption sites will be more occupied with the increase in the concentration of the pollutant [48].
4.2.5. Model Validation and Experimental Confirmations
After optimizing the adsorption of bisphenol A, the optimal preparation conditions were obtained. The predicted optimal conditions were 90 mg/L and 180 mg/L of pollutant solution for adsorption onto NSPT and NSST activated carbons, respectively. As for the activated carbon mass, it was 25 mg for each. The stirring time was 90 min for adsorption onto NSPT and 120 min onto NSST, while the pollutant solution pH was 6. Under these predicted optimal conditions, the amounts of bisphenol A adsorbed were 16.706 mg/g for adsorption onto NSST and 17.825 mg/g onto NSPT. The results obtained experimentally from these predicted conditions are compared with those predicted and summarized in Table 9.
| NSPT activated carbon | ||||||
|---|---|---|---|---|---|---|
| Variable | Y1 (mg/g) | Residue | ||||
| A (mg/L) | B (mg) | C (min) | D | |||
| Exp val | Pre val | |||||
| 90 | 25 | 90 | 6 | 21.198 | 17,825 | 3.373 |
| NSST carbon activated | ||||||
| Variable | Y2 (mg/g) | Residue | ||||
| A (mg/L) | B (mg) | C (min) | D | |||
| Exp val | Pre.val | |||||
| 180 | 25 | 120 | 6 | 18.882 | 16.706 | 2.176 |
- Exp val = experimental value; pre val = predicted value; residue = |Exp val − pre val|.
In view of the low residual values in this table that are well below the predicted and experimental values, it can be concluded that the responses obtained experimentally are close to those predicted. Under optimal conditions, there is no significant difference between the predicted results and those resulting from experimentation.
4.3. Bisphenol A Adsorption Kinetic onto NSPT and NSST Activated Carbons
Figure 6 presents the nonlinear regression model of the kinetic models and the variation of the quantity of pollutant adsorbed, respectively, by NSPT and NSST ACs according to the stirring time.


From Figure 6, the amounts of bisphenol A adsorbed increase in three phases over time. During the first 15 minutes, the adsorption process is fast with both adsorbents. This observation may be due to the fact that the adsorption sites initially present on the adsorbent surfaces are still free and the mass transfer forces are important. Indeed, when bisphenol A molecules are put together with activated carbon, interactions are established between the adsorption sites and the adsorbate molecules. This could result in the formation of several types of bonds contributing to the retention of the pollutant on the surface of the activated carbons. The adsorption process is less rapid following the second phase, and equilibrium is reached after 80 minutes. The quantities of bisphenol A adsorbed onto NSPT and NSST activated carbons are, respectively, 19.182 and 14.901 mg/g. This observation can be explained by the fact that there is a reduction in the number of adsorption sites after the binding of the first BPA molecules. Thus, those still present in solution compete for the few sites still available. In addition, the pore openings could be clogged by the already adsorbed molecules, thus preventing others from diffusing inside the pores [49]. According to Alvarez et al. [50], the presence of carboxylic and hydroxyl functions on the AC surface would prevent the adsorption of organic compounds. During this phase, the quantities adsorbed can be attributed to π-π interactions. Qualified as dispersive interactions, they take place between the π electrons of the aromatic nucleus (deficient in electrons) of the pollutants and the π electrons of the surface of the activated carbon (rich in electrons) [5, 51]. Figure 7 illustrates the possible interactions that contribute to the bisphenol A adsorption mechanism adapted from Tran et al. [52].

The third phase is observed beyond 80 minutes with the gradual formation of a plateau reflecting the saturation of the adsorption sites.
In order to decide on the kinetics that better describes the sorption process involved, the different error functions mentioned earlier have been determined. The different values of these errors are shown in Table 10 for each of the kinetic models studied.
| Adsorption of bisphenol A onto NSST activated carbon | |||||||
|---|---|---|---|---|---|---|---|
| Model | Parameter | Value | R2 | χ2 | ARE | SSE | RMSE |
| Lagergren | Qe (mg/g) | 18.07 | 0.984 | 0.265 | 0.032 | 4.681 | 2.164 |
| K1 (min−1) | 0.246 | ||||||
| Pseudo-second-order | Qe (mg/g) | 14.901 | 0.994 | 0.096 | 0.075 | 1.688 | 1.299 |
| K2 (g/min.mg) | 0.025 | ||||||
| h0 (mg/g.min) | 9.238 | ||||||
| t1/2 (min) | 2.064 | ||||||
| Elovich | α (mg/g.min) | 6884.398 | 0.887 | 0.314 | 0.274 | 5.216 | 2.284 |
| β (g/mg) | 0.686 | ||||||
| Intraparticle diffusion | Kp (mg/g.min0.5) | 1.795 | 0.977 | 0.476 | 0.857 | 6.962 | 2.639 |
| C (mg/g) | 0.998 | ||||||
| Adsorption of bisphenol A onto NSPT activated carbon | |||||||
| Model | Parameter | Value | R2 | χ2 | ARE | SSE | RMSE |
| Lagergren | Qe (mg/g) | 14.181 | 0.966 | 0.510 | 0.105 | 6.385 | 2.527 |
| K1 (min−1) | 0.201 | ||||||
| Pseudo-second-order | Qe (mg/g) | 19.182 | 0.993 | 0.097 | 0.010 | 1.222 | 1.105 |
| K2 (g/min.mg) | 0.024 | ||||||
| h0 (mg/g.min) | 5.380 | ||||||
| t1/2 (min) | 2.810 | ||||||
| Elovich | α (mg/g.min) | 377.943 | 0.947 | 0.145 | 0.157 | 1.952 | 1.397 |
| β (g/mg) | 0.671 | ||||||
| Intraparticle diffusion | Kp (mg/g.min0.5) | 1.687 | 0.974 | 0.329 | 3.182 | 4.483 | 2.117 |
| C (mg/g) | 0.700 | ||||||
With regard to this table, we note that the values of the coefficients of determination R2 are close to unity. This would mean that each of the kinetic models is likely to describe the adsorption of bisphenol A molecules onto ACs. However, based on the low values of χ2, it appears that the pseudo-second-order kinetic model better describes the adsorption kinetics of bisphenol A on each of the activated carbons. This conclusion can be confirmed based on the other error functions investigated as mentioned in Table 10. These error functions (ARE, SSE, and RMSE) have the lowest values. In view of the values of the initial adsorption speeds h0 and the half-reaction times t1/2, the adsorption of bisphenol A takes place more quickly onto NSST AC than onto NSPT AC. It could then be concluded that the limiting step of the adsorption process may be a chemical reaction and not a mass transport [29]. Moreover, according to Tran et al. [52], the pseudo-second-order kinetic model describes π-π type interactions for an adsorbate/adsorbent system. With regard to the Elovich model, low values of the β desorption rate constants were observed. These values of the order of 0.6 imply a tendency that there is a multiplicity of sites available for adsorption [53]. As for the Lagergren model, the values of the error functions do not plead in its favor. This observation then indicates that the interactions thus brought into play during the sorption process are not of the van der Waals type. The value of the thickness C of the layers of bisphenol A attached to the surface of the activated carbons is different from zero. This indicates that intraparticle diffusion is also involved in adsorption kinetics as part of the diffusion process. It is still not the only process controlling the scope of the diffusion rate involved in all the steps [54].
4.4. Bisphenol A Adsorption Isotherms: Nonlinear Regression Model and Error Functions
The adsorption isotherms have been described by nonlinear regression models, and the plots are presented in Figure 8 in the form of quantities adsorbed as a function of the residual concentration.


Figure 8 shows the variation of the quantity of adsorbed pollutant as a function of residual concentration. The different values of the related error functions are shown in Table 11.
| Adsorption of bisphenol A onto NSST activated carbon | |||||||
|---|---|---|---|---|---|---|---|
| Model | Parameter | Value | R2 | χ2 | ARE | SSE | RMSE |
| Langmuir | Qm (mg/g) | 12,684 | 0.968 | 0.248 | 6.299 | 2.055 | 1.433 |
| KL (L/mg) | 0,632 | ||||||
| RL | 0,010 | ||||||
| Freundlich | 1/n | 0.011 | 0.931 | 0.794 | 2.515 | 4.531 | 2.129 |
| KF (L/mg) | 0.138 | ||||||
| Temkin | KT (L/mg) | 0.048 | 0.899 | 0.836 | 11.401 | 9.372 | 3.061 |
| ΔQ (kJ/mol) | 426.88 | ||||||
| D-R | Qm (mg/g) | 18.525 | 0.840 | 0.954 | 6.879 | 10.141 | 3.184 |
| E (kJ/mol) | 0.002 | ||||||
| KD-R (L/mg) | 0.014 | ||||||
| Adsorption of bisphenol A onto NSPT activated carbon | |||||||
| Model | Parameter | Value | R2 | χ2 | ARE | SSE | RMSE |
| Langmuir | Qm (mg/g) | 26.247 | 0.998 | 0.022 | 2.427 | 0.512 | 0.716 |
| KL (L/mg) | 0.019 | ||||||
| RL | 0.248 | ||||||
| Freundlich | 1/n | 0.478 | 0.980 | 0.201 | 0.922 | 4.731 | 2.175 |
| KF (L/mg) | 3.420 | ||||||
| Temkin | KT (L/mg) | 0.214 | 0.944 | 0.131 | 4.639 | 2.865 | 1.693 |
| ΔQ (kJ/mol) | 117.48 | ||||||
| D-R | Qm (mg/g) | 35.437 | 0.933 | 0.769 | 2.622 | 9.06 | 3.615 |
| E (kJ/mol) | 8.452 | ||||||
| KD-R (L/mg) | 0.007 | ||||||
With regard to Table 10, the determination coefficient values of R2 are all close to unity. The low values of χ2 and calculated error functions show that the Langmuir isotherm best describes the adsorption process of bisphenol A onto the activated carbons. In this specific case, the value of the Langmuir separation factor RL is such that 0 < RL < 1. This observation reflects a favorable adsorption [1]. It can thus be assumed that the adsorption is of a homogeneous nature on the surface of the carbons and is probably done by the formation of a monolayer, while the binding sites have equivalent energies. For this phenomenon, the adsorption sites have the same chemical affinity [55] because there is no interaction between the adsorbed pollutant molecules.
With regard to the energy values obtained from the Dubinin–Radushkevich model, the process dominating the adsorption of BPA onto NSPT is ion exchange because 8 < E < 16 kJ/mol. For the adsorption onto NSST, the dominant sorption process is physisorption [56]. The heats of adsorption obtained from the Temkin model for the adsorption of bisphenol A on the different ACs are all positive. These involve an exothermic adsorption process [57, 58]. The values of 1⁄n determined from the Freundlich model show that there is an affinity between bisphenol A and activated carbons. Indeed, the more this value tends towards unity, the greater the affinity. They therefore reflect a significant affinity between the various adsorbate/adsorbent systems studied. These values of 0 < 1/n < 1 are suggesting a favorable adsorption of bisphenol A and heterogeneity of the AC adsorption sites [59].
4.5. Effect of Temperature on the Adsorption Process of Bisphenol A
The study of the influence of temperature on the adsorption process was made by varying the temperature from 303 to 353 K. It was made using the NSPT AC obtained by impregnation with H3PO4 having shown the best adsorption performance. The variation in the amount of bisphenol A adsorbed as a function of the temperature of the reaction medium is shown in Figure 9.


With regard to Figure 9(a), the increase in the temperature of the reaction medium leads to a reduction in the quantity of bisphenol A adsorbed. This phenomenon, in accordance with Svante August Arrhenius law, suggests that the surface reaction is exothermic, and therefore, each increase in temperature disadvantages its progress [60]. In another aspect, the increase in temperature further leads to the solubilization of bisphenol A molecules, thus leading to a decrease in the quantity adsorbed [61]. The plot of ln (KD) = f (1/T) presented in Figure 9(b) made it possible to deduce the entropy, the standard enthalpy, and the standard free enthalpy relating to the adsorbent/adsorbate system studied. The results are listed in Table 12.
| Pollutant | T (K) | ΔS° (J/mol.K) | ΔH° (kJ/mol) | ΔG° (kJ/mol) |
|---|---|---|---|---|
| BPA | 303 | −140.856 | −40.185 | 3.489 |
| 313 | 3.703 | |||
| 323 | 4.623 | |||
| 333 | 5.270 | |||
| 353 | 10.895 |
From Table 11, an examination of the negative value of ΔS° shows that the adsorption takes place in a more or less orderly way at the adsorbent/adsorbate interface. The value of the standard adsorption enthalpy of less than 40 kJ/mol shows that physisorption is the dominant process [1, 62]. Furthermore, the ΔH° values are negative, indicating that the adsorption of BPA onto NSPT activated carbon is exothermic. The same observation was reported by Wang and Zhang [5]. One can also note that the values of ΔG° > 0 increase with the increase in temperature. This could be explained by the fact that adsorption becomes difficult and unfavorable when the temperature increases: the adsorption process was nonspontaneous [63]. Moreover, this observation indicates an increase in disorder with energy redistribution during adsorption at the adsorbate/adsorbent interface [62]. However, it is essential to note that the entropy could increase more because it is influenced by that of the universe; during the adsorption process, the system was not isolated.
5. Conclusion
The response surface methodology was successfully used to investigate the effects of initial concentration, adsorbent dosage, stirring time, and solution pH on the adsorption capacity of bisphenol A onto two activated carbons. The optimal conditions were obtained for 180 mg/L and 90 mg/L BPA solution, respectively, for NSST and NSPT materials. 25 mg adsorbent dosage and the solution pH 6 were all the same for adsorption on both adsorbents. Stirring time was, respectively, 90 min and 120 min for adsorption onto NSPT and NSST. These optimal conditions resulted in 18.882 and 21.198 mg/g removal for NSST and NSPT, respectively. From the analysis of the response surfaces, all the investigated parameters were found to have significant effects on BPA adsorption. The effect of the analyte concentration, the pH, and the adsorbent dosage were found to have the greatest synergistic impact on the quantity adsorbed. The sorption process was rapid and followed a pseudo-second-order model. The experimental data agreed well with Langmuir’s isotherm model. This study has shown that the response surface methodology based on a central composite design is a suitable method to optimize the operating conditions and maximize removal efficiency of bisphenol A in aqueous solution. A thermodynamic study revealed an exothermic and physisorption process.
Conflicts of Interest
The authors declare that they have no conflicts of interest.
Acknowledgments
The present study was done at the Research Unit of Noxious Chemistry and Environmental Engineering, Department of Chemistry, Faculty of Science, University of Dschang. The authors appreciate the contribution of Dr. Rufis Fregue Tiegam Tagne and Dr. Ranil Clément Tonleu Temgoua.
Open Research
Data Availability
The data used to support the findings of this work can be obtained from the corresponding authors upon request.